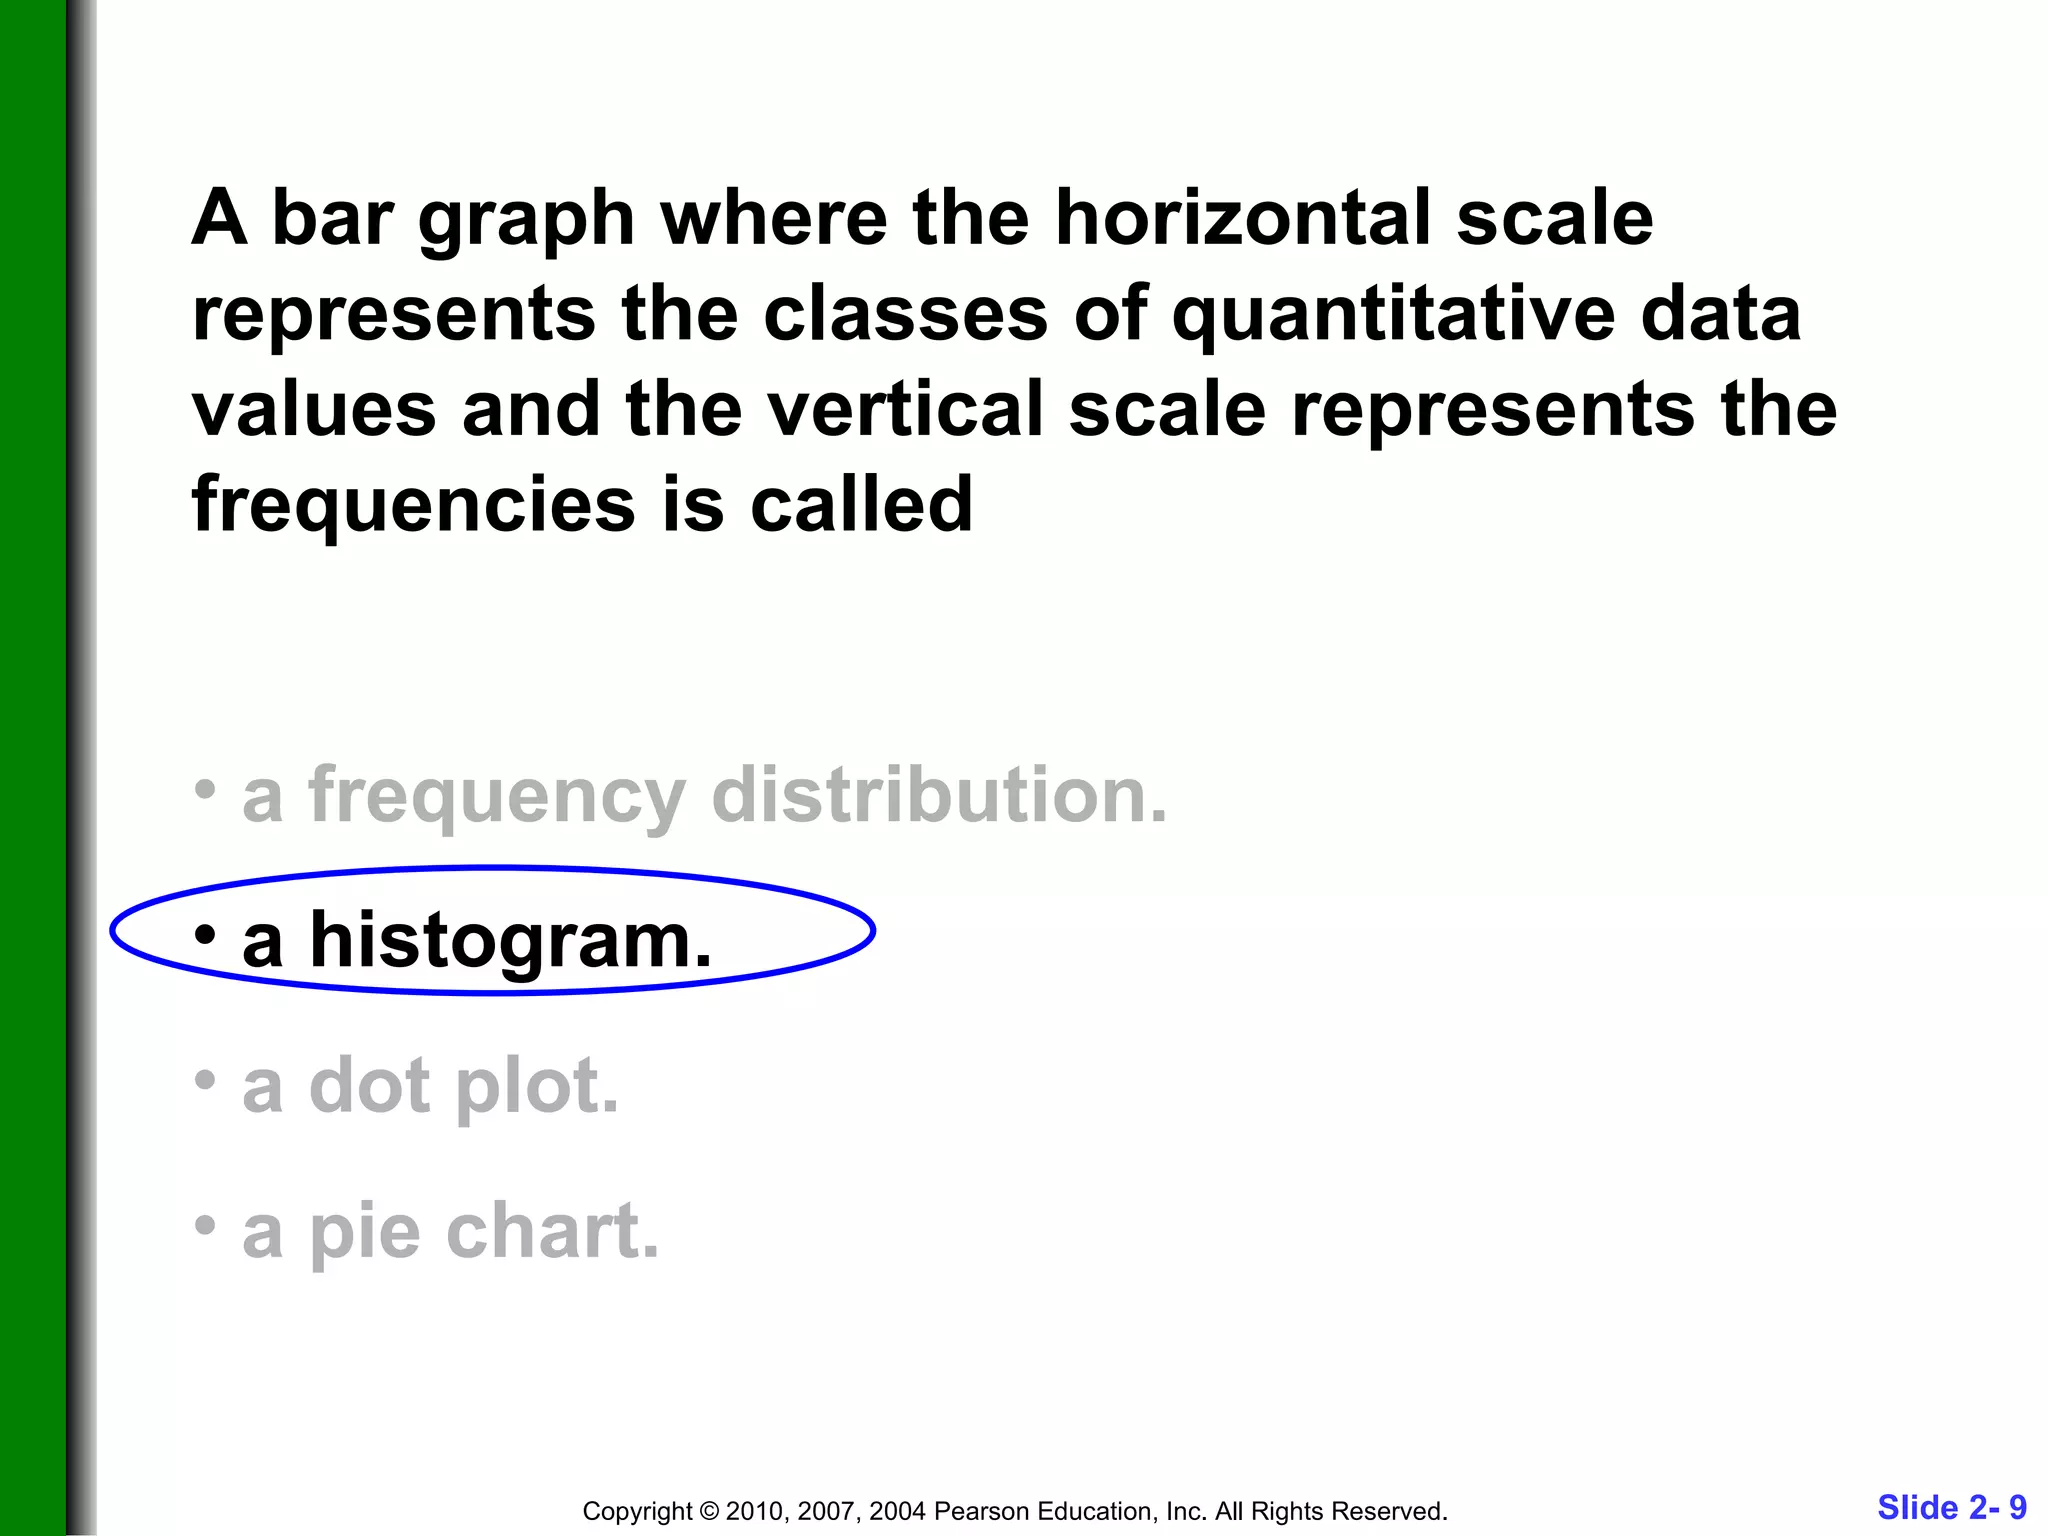
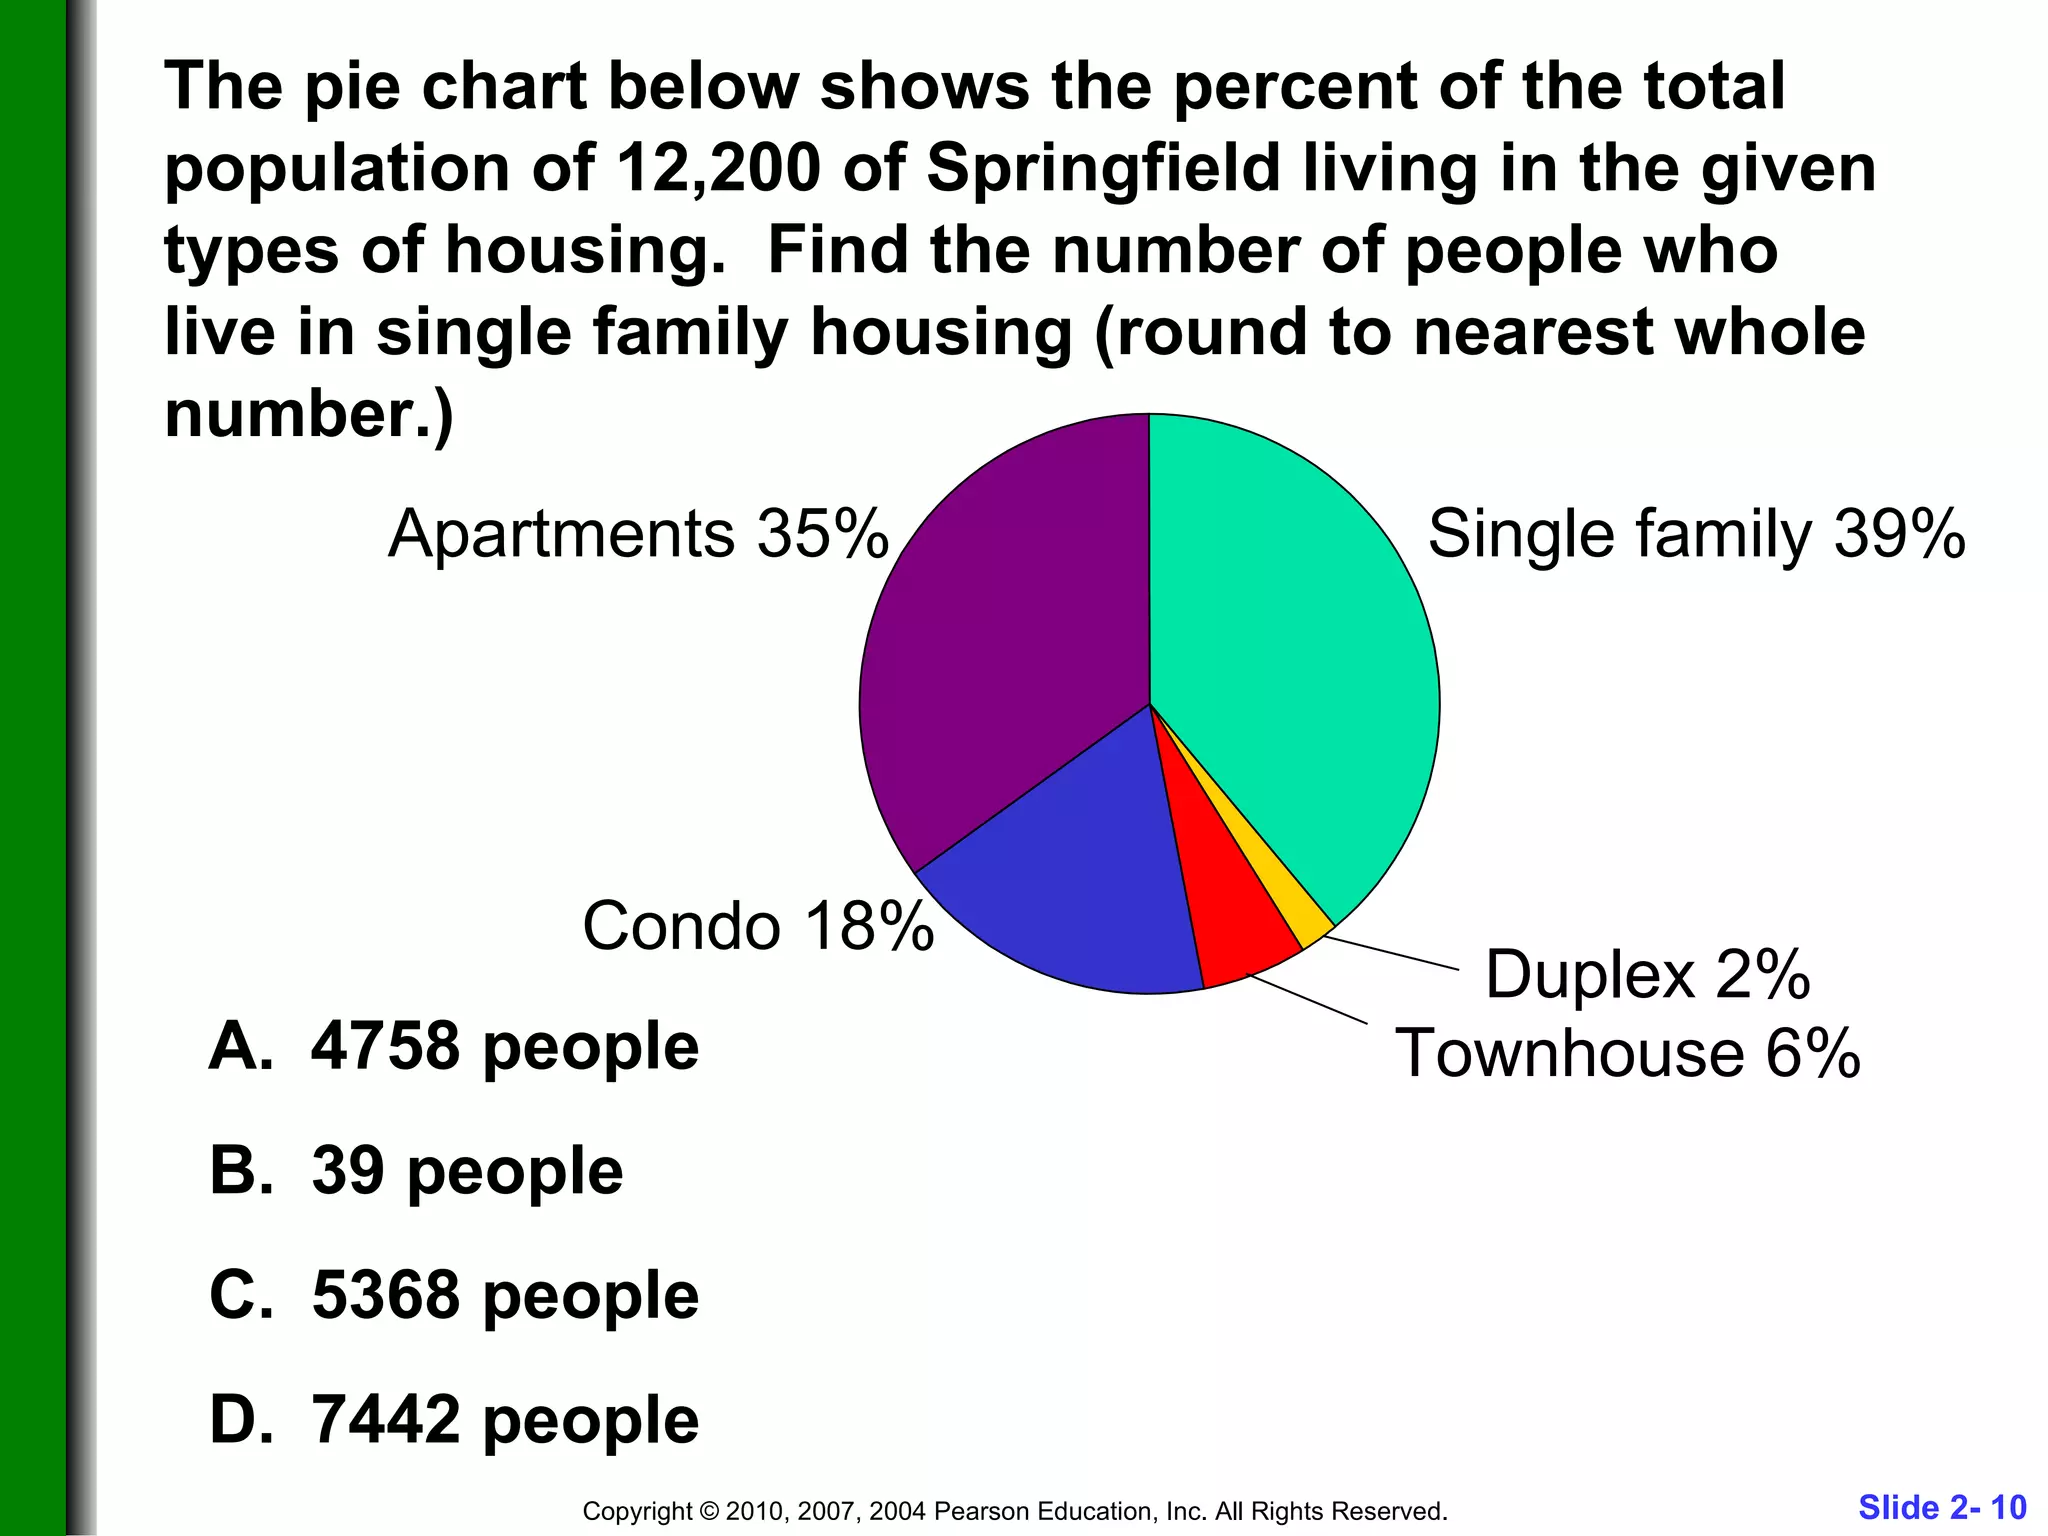
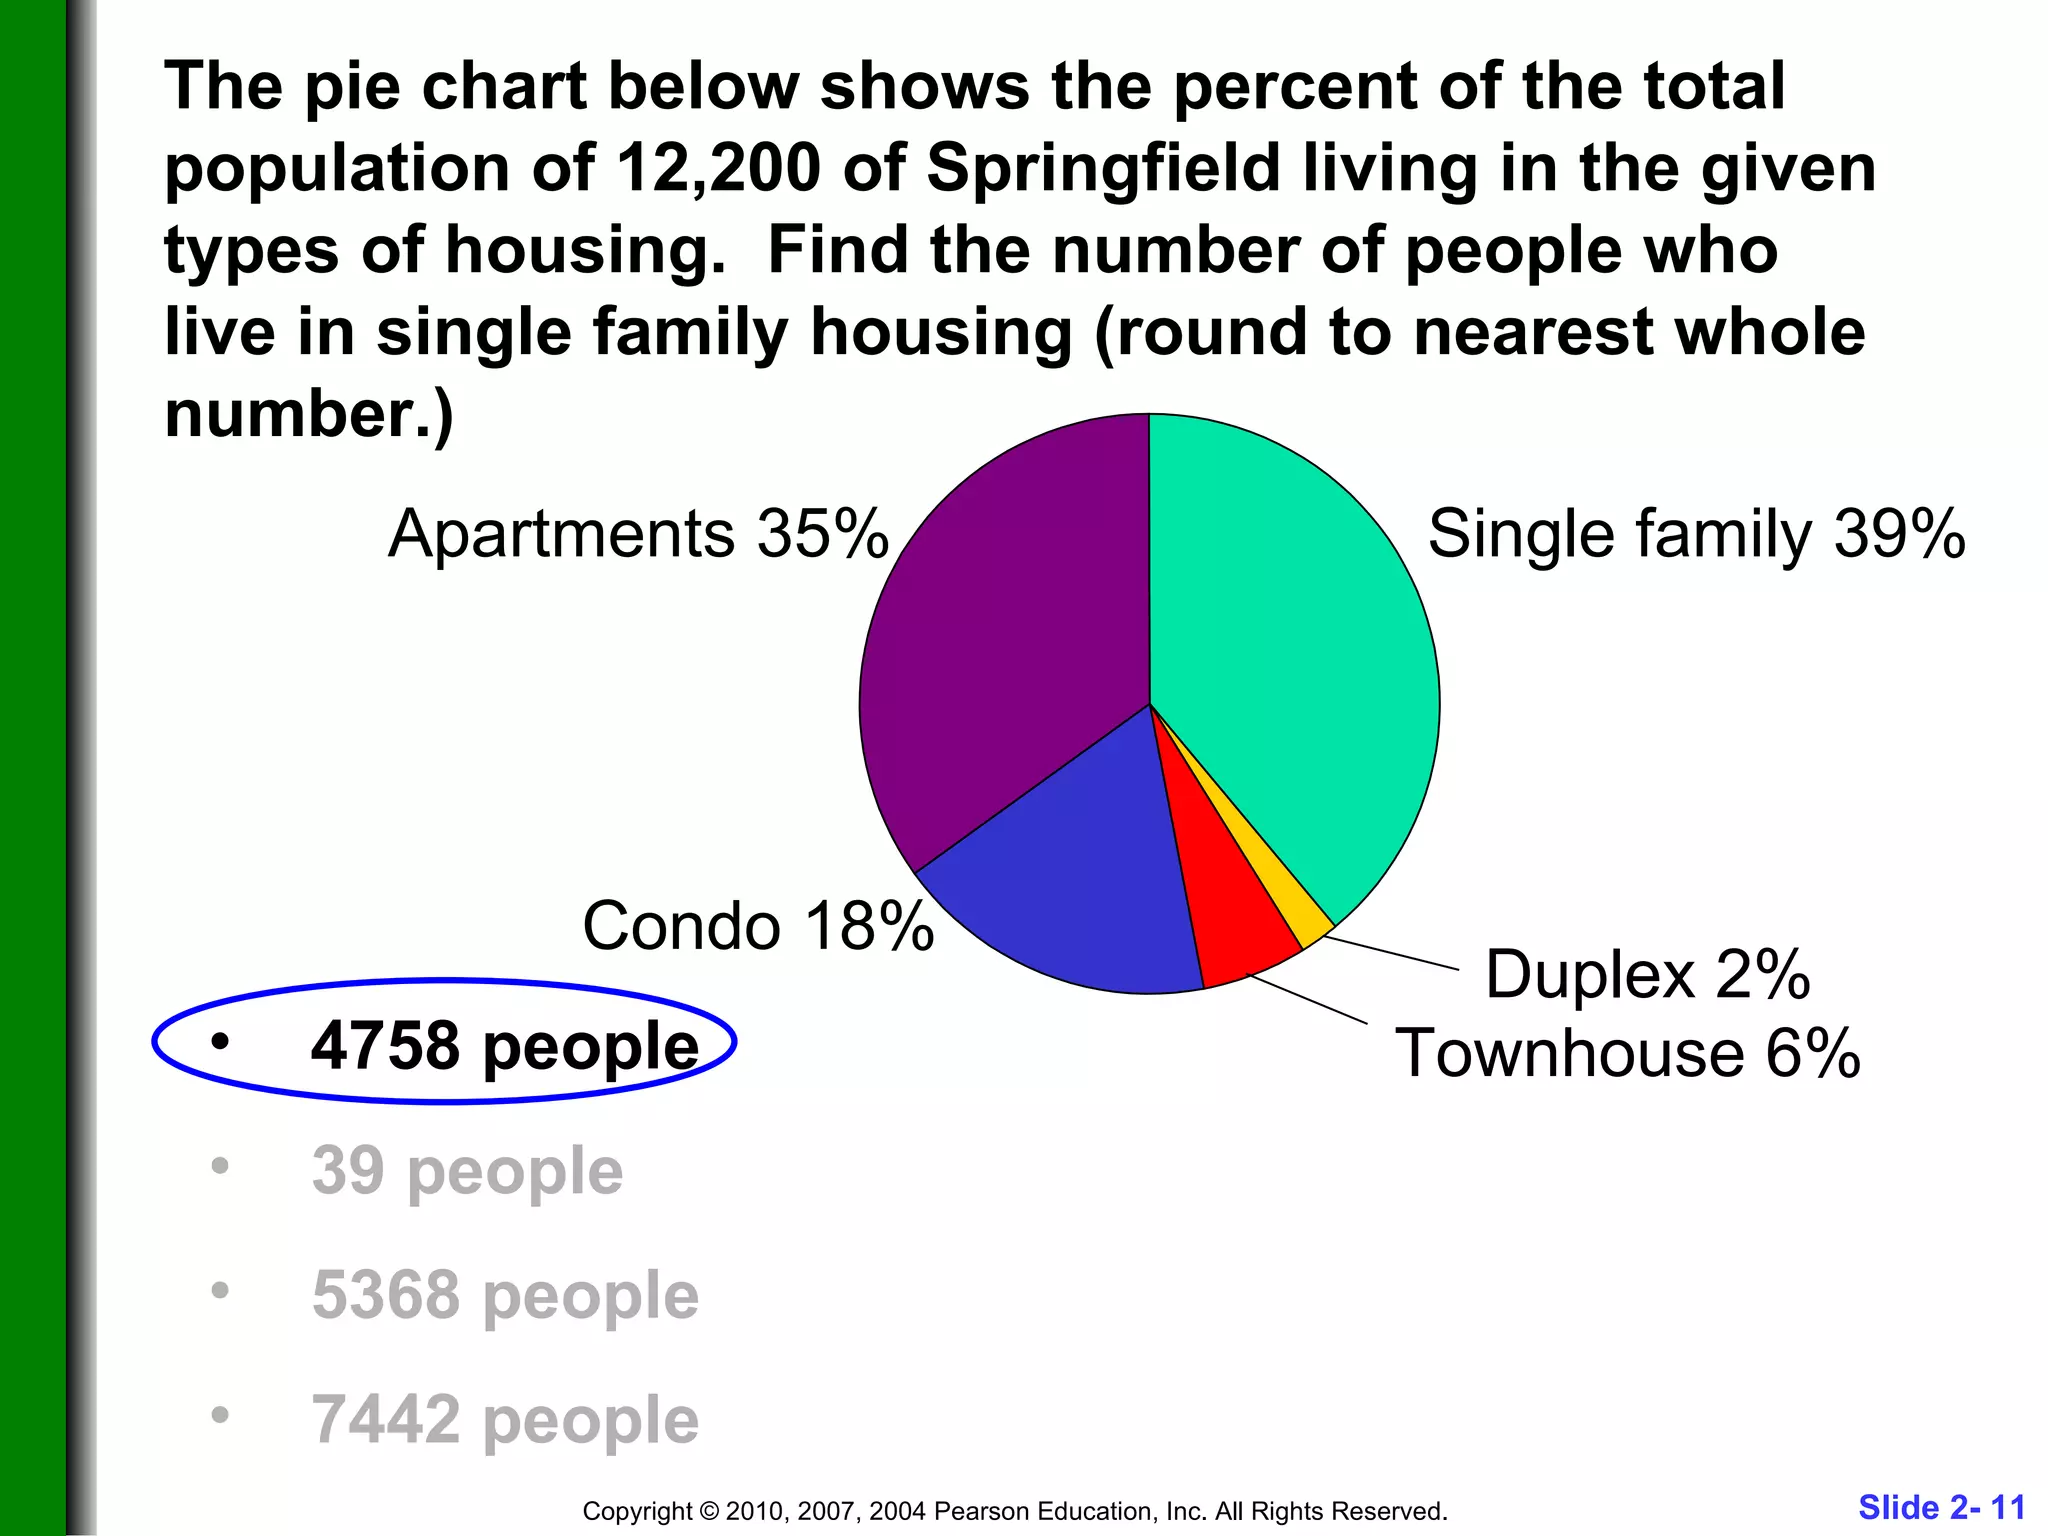
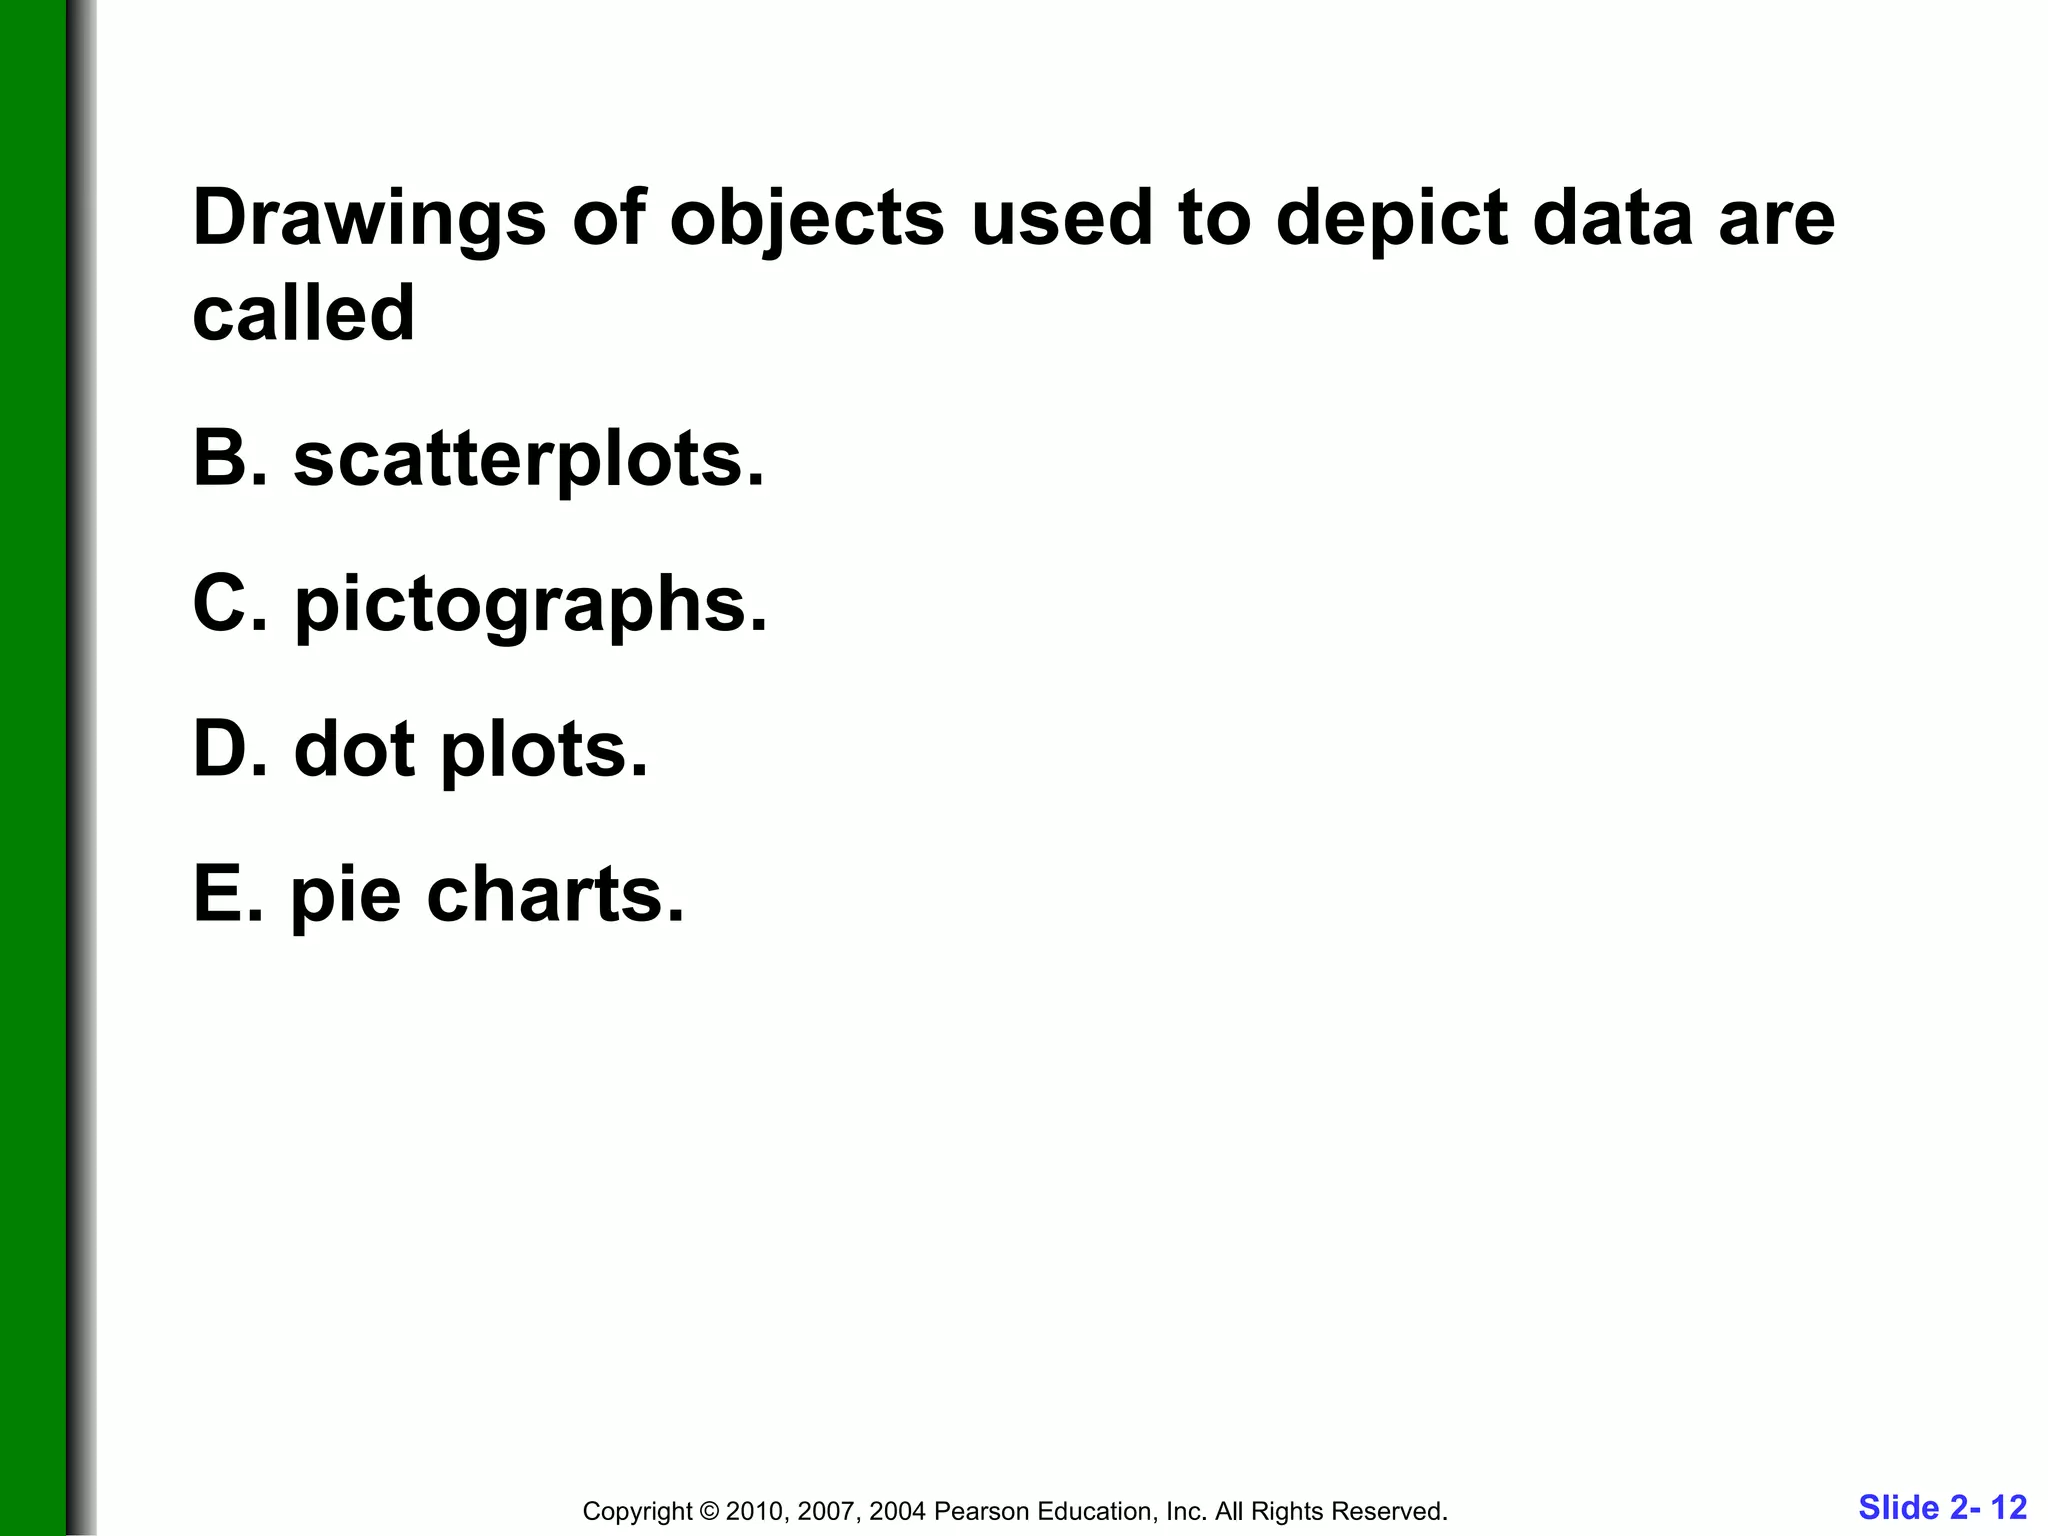
Active Learning Lecture Slides  For use with Classroom Response Systems Elementary Statistics   Eleventh Edition  and the Triola Statistics Series  by Mario F. Triola Chapter 2:  Summarizing and Graphing Data
A sample value that lies very far away from the majority of the other sample values is the center. a distribution. an outlier. a variance.
A table that lists data values along with their counts is an olgive. a frequency distribution. a cumulative table. a histogram.
The smallest numbers that can actually belong to different classes are upper class limits. class boundaries. midpoints. lower class limits.
A bar graph where the horizontal scale represents the classes of quantitative data values and the vertical scale represents the frequencies is called a frequency distribution. a histogram. a dot plot. a pie chart.
The pie chart below shows the percent of the total population of 12,200 of Springfield living in the given types of housing.  Find the number of people who live in single family housing (round to nearest whole number.) 4758 people 39 people 5368 people 7442 people Single family 39% Duplex 2% Townhouse 6% Condo 18% Apartments 35%
Drawings of objects used to depict data are called scatterplots. pictographs. dot plots. pie charts.

C2 Study Slides - MAT 151

  • 1.
    Active Learning LectureSlides For use with Classroom Response Systems Elementary Statistics Eleventh Edition and the Triola Statistics Series by Mario F. Triola Chapter 2: Summarizing and Graphing Data
  • 2.
    A sample valuethat lies very far away from the majority of the other sample values is the center. a distribution. an outlier. a variance.
  • 3.
    A sample valuethat lies very far away from the majority of the other sample values is the center. a distribution. an outlier. a variance.
  • 4.
    A table thatlists data values along with their counts is an olgive. a frequency distribution. a cumulative table. a histogram.
  • 5.
    A table thatlists data values along with their counts is an olgive. a frequency distribution. a cumulative table. a histogram.
  • 6.
    The smallest numbersthat can actually belong to different classes are upper class limits. class boundaries. midpoints. lower class limits.
  • 7.
    The smallest numbersthat can actually belong to different classes are upper class limits. class boundaries. midpoints. lower class limits.
  • 8.
    A bar graphwhere the horizontal scale represents the classes of quantitative data values and the vertical scale represents the frequencies is called a frequency distribution. a histogram. a dot plot. a pie chart.
  • 9.
    A bar graphwhere the horizontal scale represents the classes of quantitative data values and the vertical scale represents the frequencies is called a frequency distribution. a histogram. a dot plot. a pie chart.
  • 10.
    The pie chartbelow shows the percent of the total population of 12,200 of Springfield living in the given types of housing. Find the number of people who live in single family housing (round to nearest whole number.) 4758 people 39 people 5368 people 7442 people Single family 39% Duplex 2% Townhouse 6% Condo 18% Apartments 35%
  • 11.
    The pie chartbelow shows the percent of the total population of 12,200 of Springfield living in the given types of housing. Find the number of people who live in single family housing (round to nearest whole number.) 4758 people 39 people 5368 people 7442 people Single family 39% Duplex 2% Townhouse 6% Condo 18% Apartments 35%
  • 12.
    Drawings of objectsused to depict data are called scatterplots. pictographs. dot plots. pie charts.
  • 13.
    Drawings of objectsused to depict data are called scatterplots. pictographs. dot plots. pie charts.