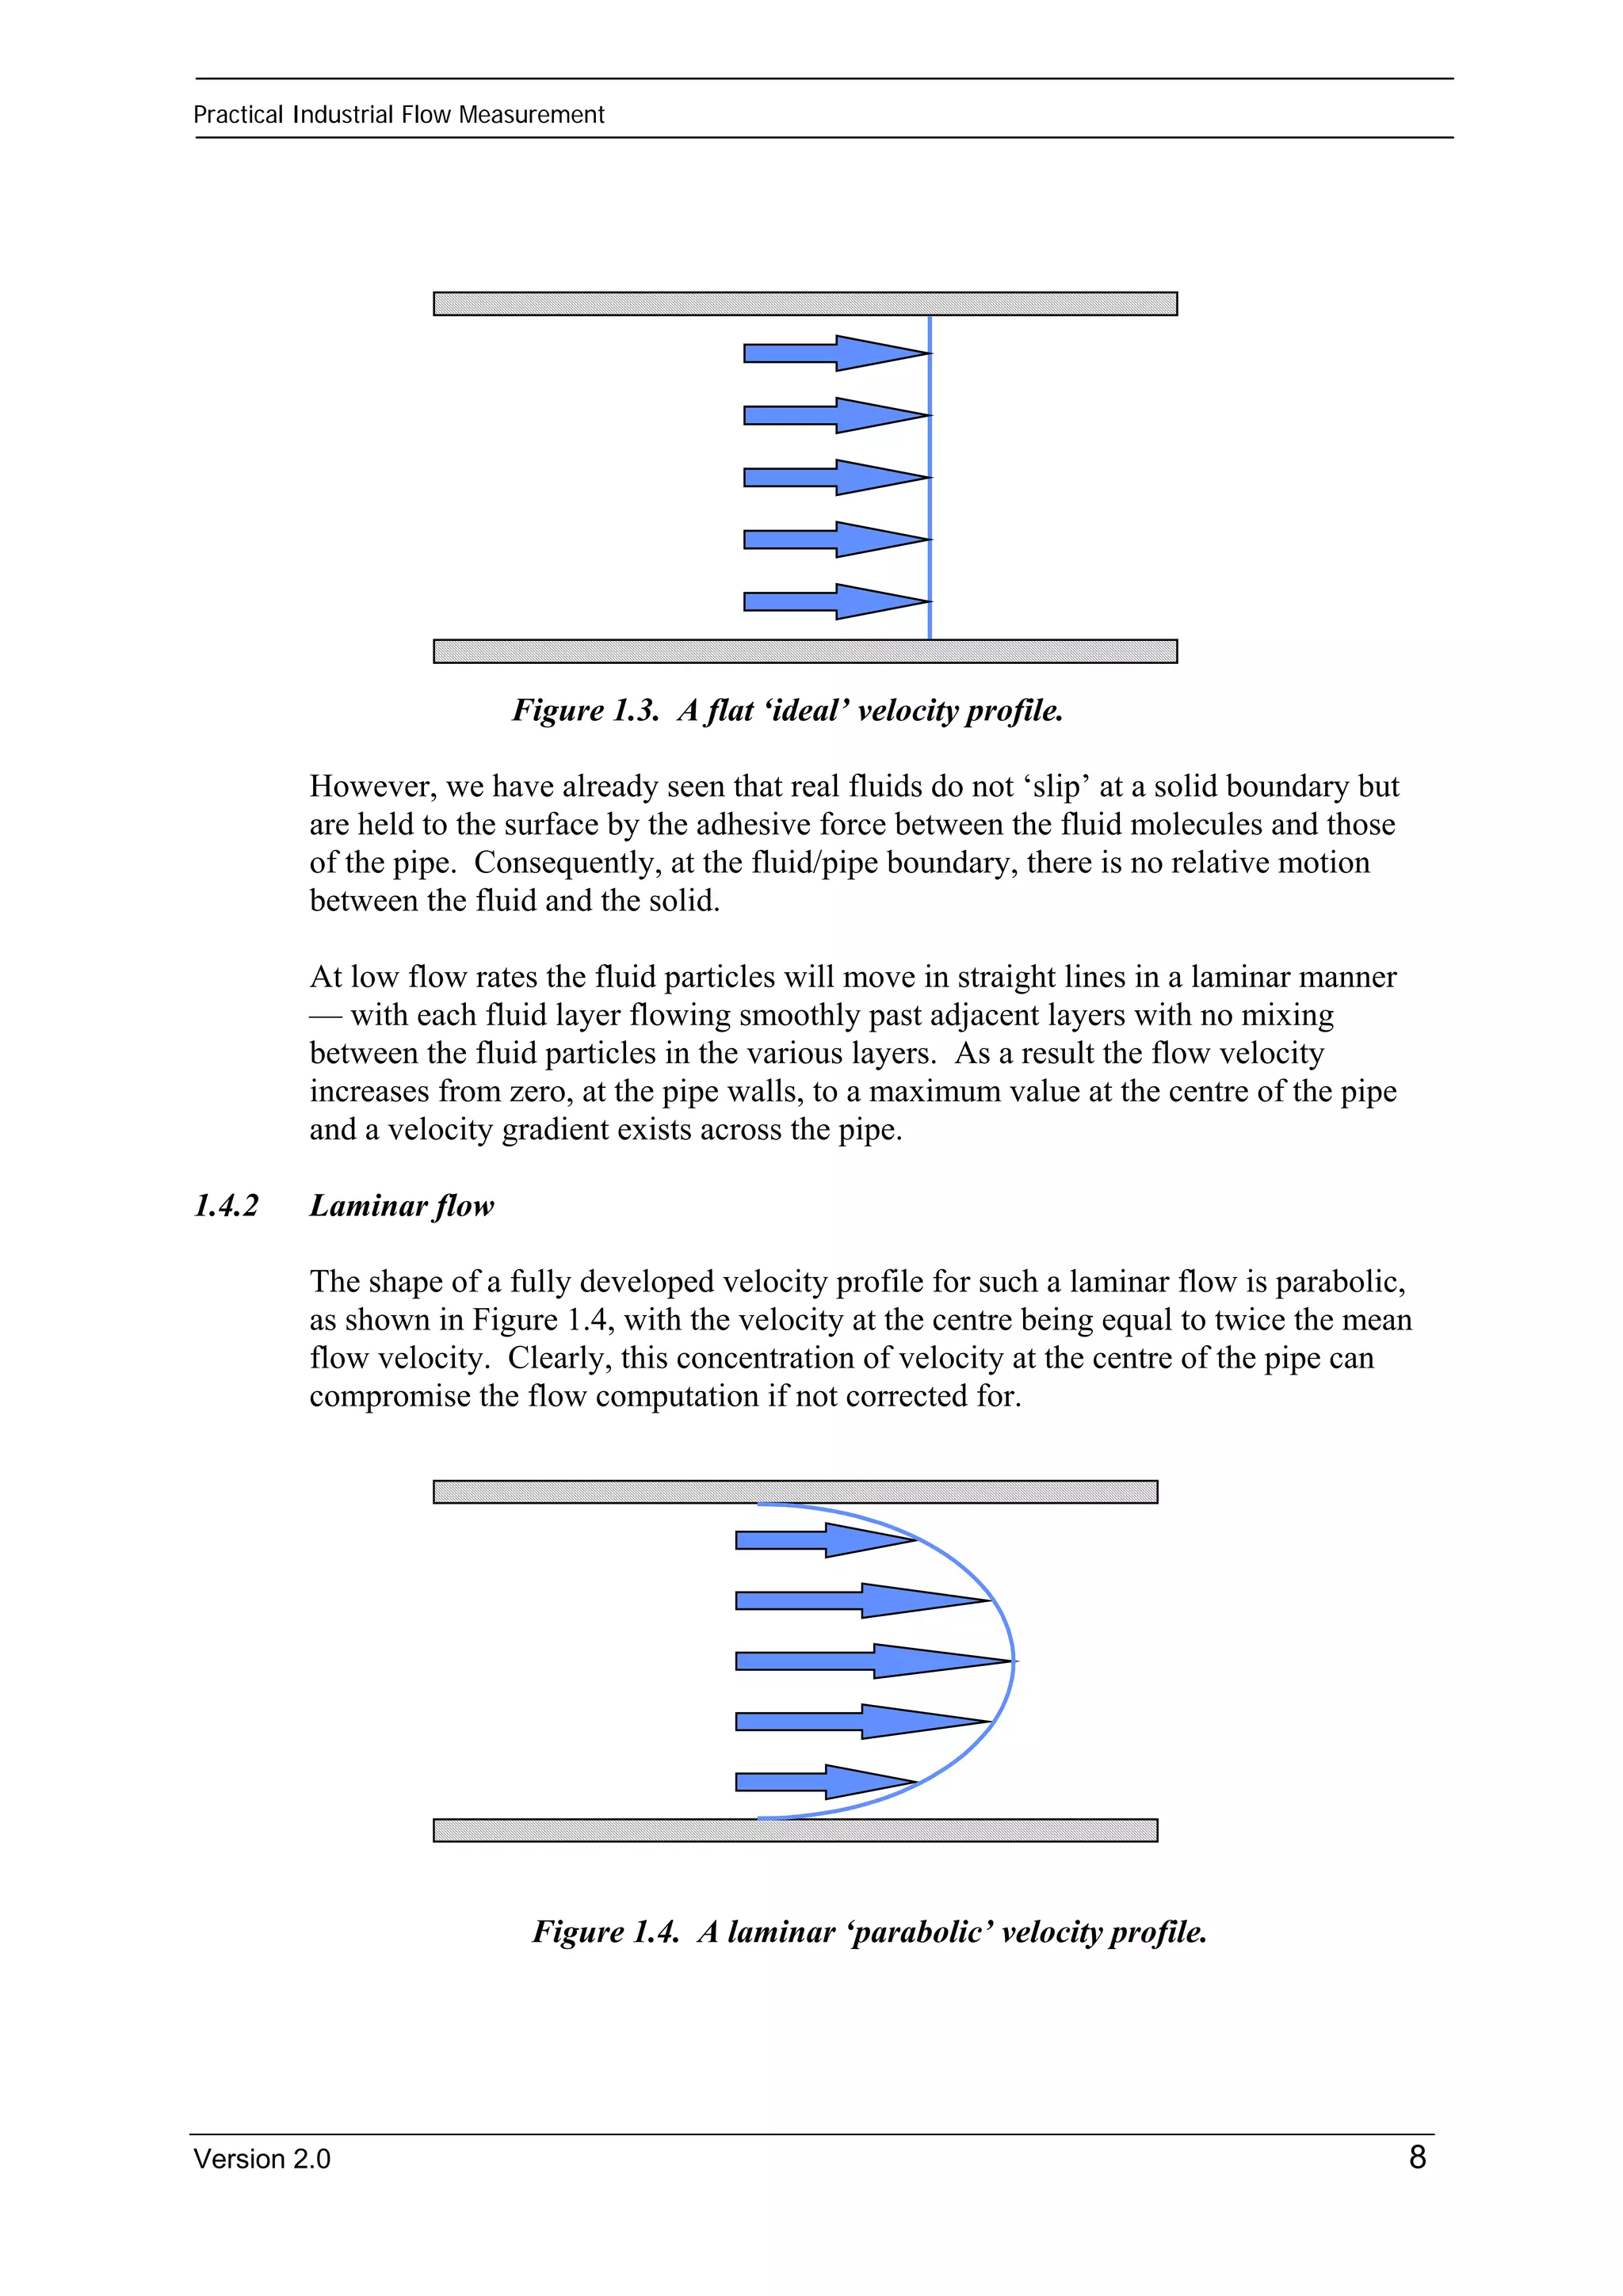
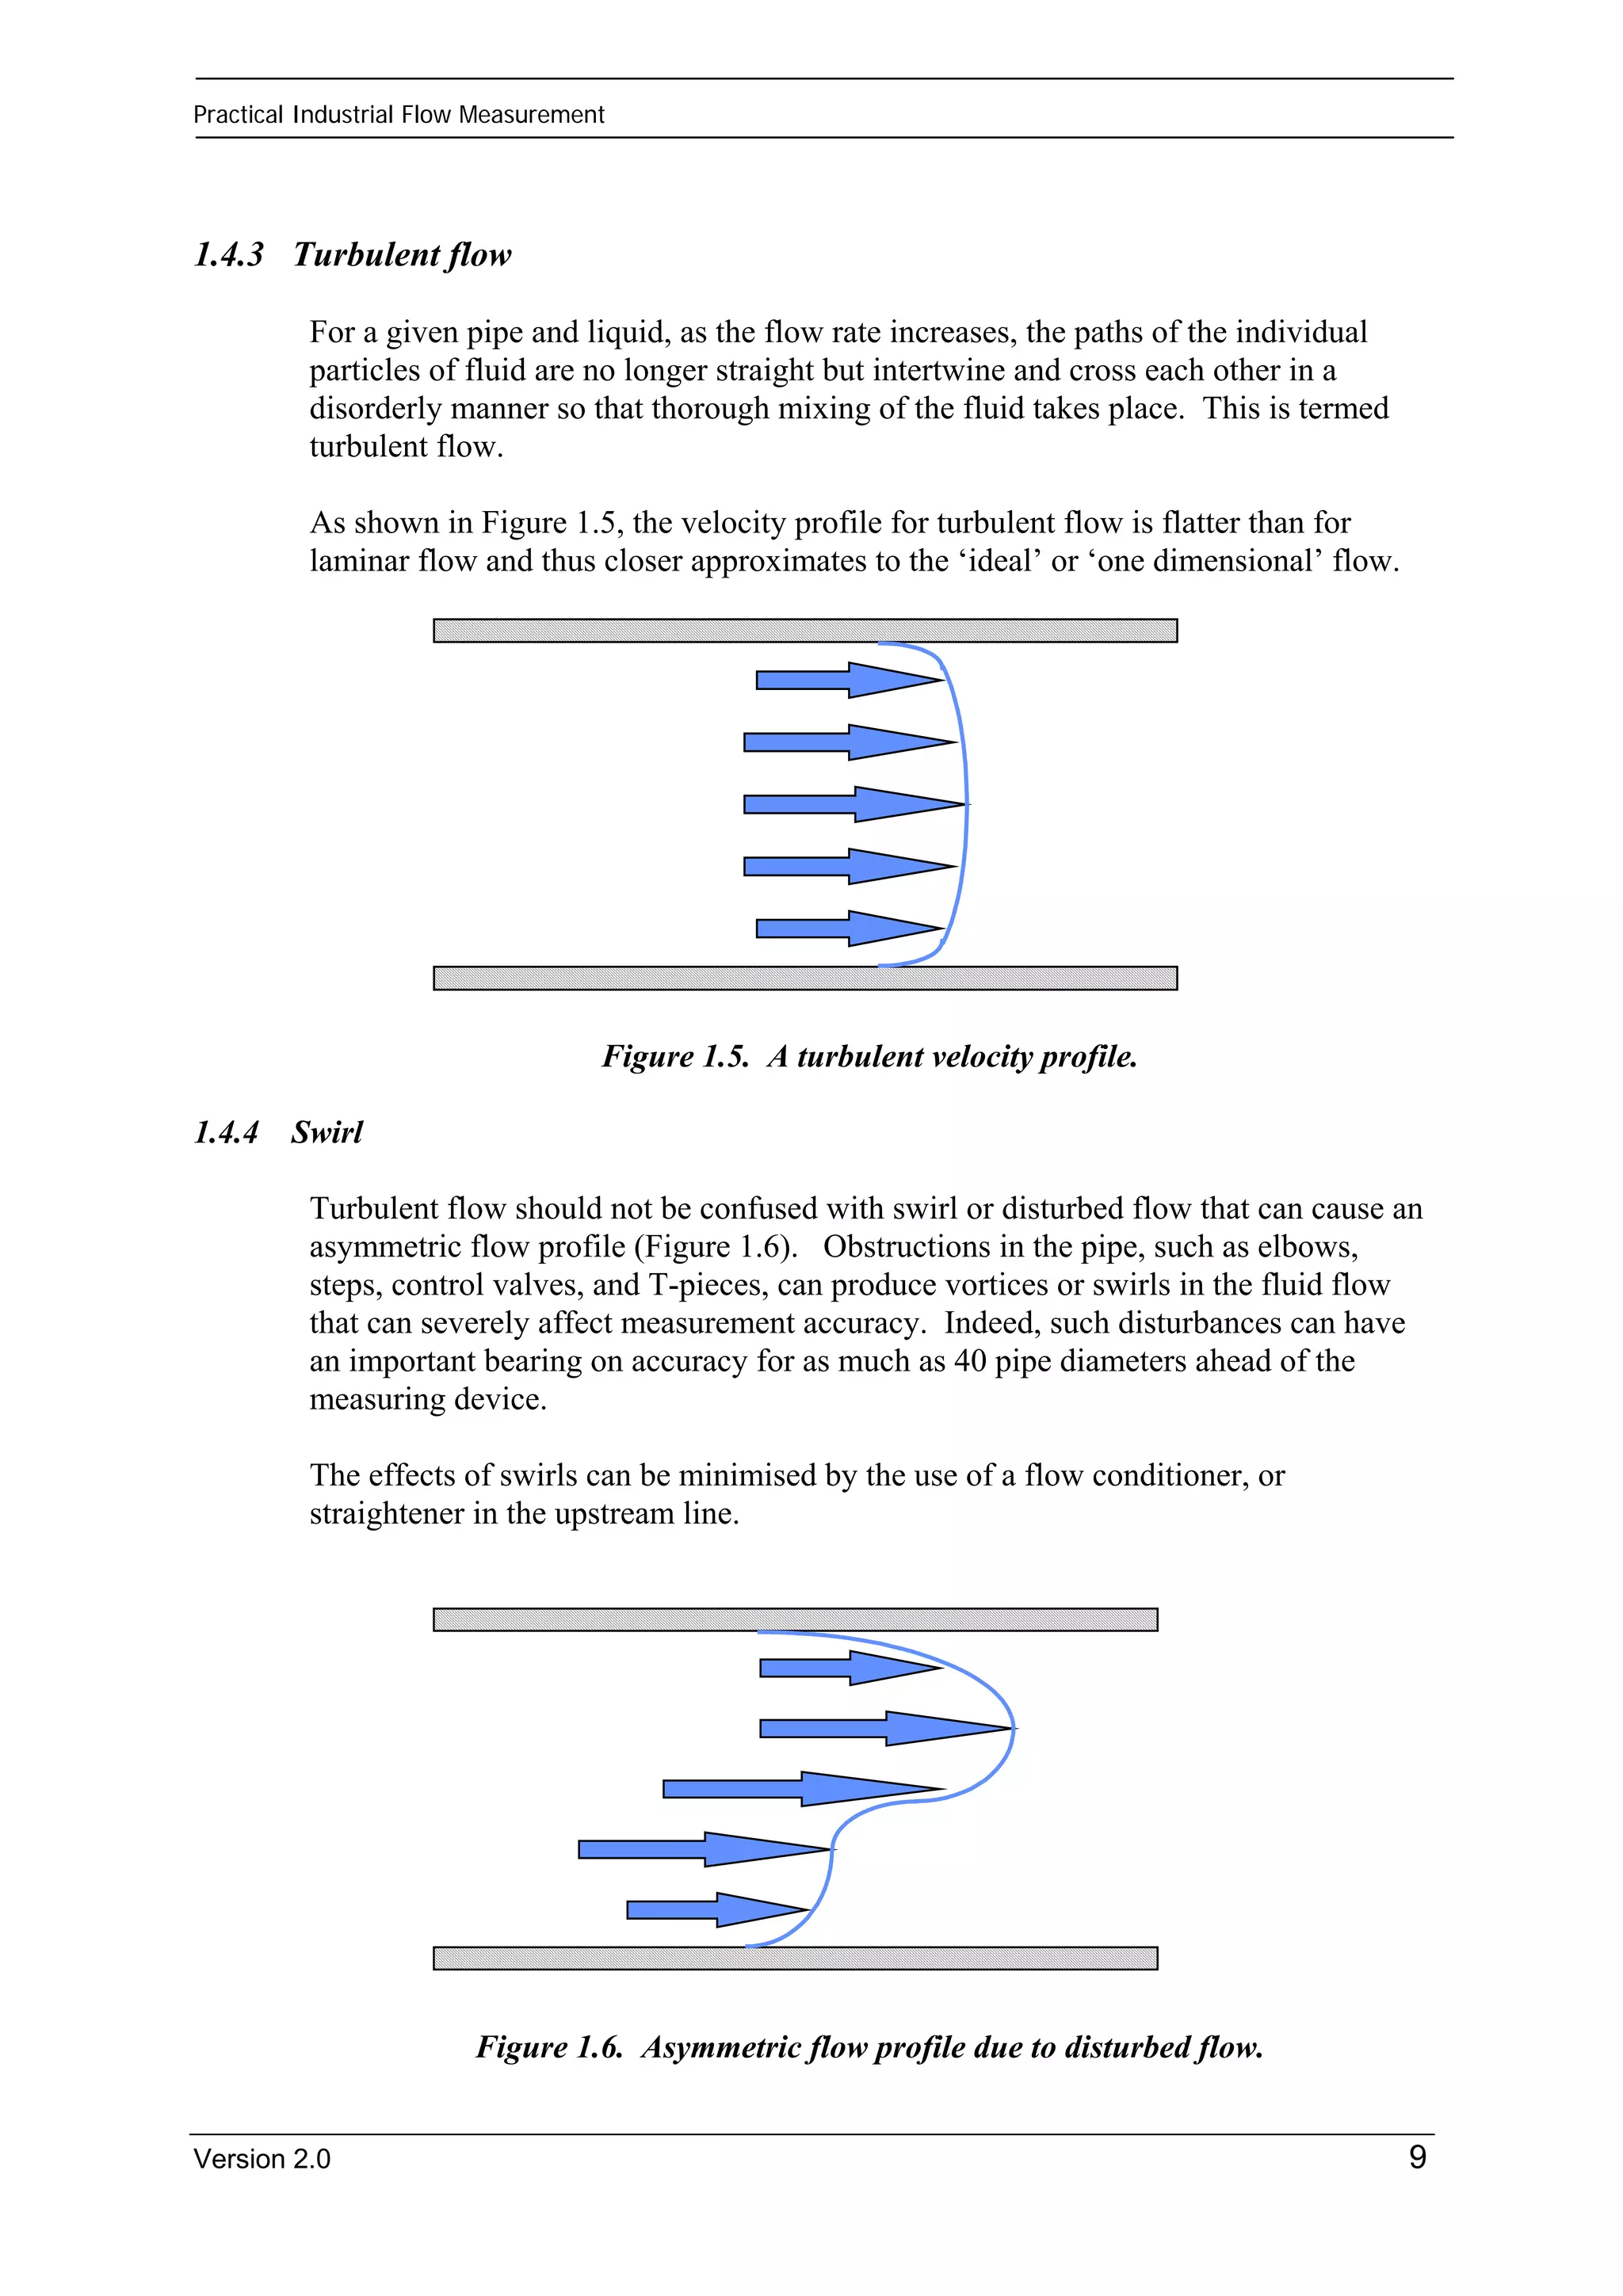
This document provides an overview of basic fluid properties important for flow measurement. It discusses viscosity and different fluid types, including Newtonian and non-Newtonian fluids. It also describes ideal, laminar and turbulent flow profiles, and how the Reynolds number characterizes these behaviors. Key flow measurement parameters are introduced, such as volumetric and mass flow rates for single and multi-phase flows. The objectives are to describe fluid properties, flow profiles, and flow measurement concepts.
RheoSense Webinar: Fundamentals of Viscosity: A Historical PerspectiveGrace Baek
How do we measure viscosity?
Download the webinar to view how great engineering minds have tackled this question over the years.
We trace the historical development of viscosity and viscometers; starting with the fundamental principles established by Sir Isaac Newton and leading up to modern-day viscometry methods.
www.RheoSense.com
http://www.rheosense.com/viscosity-webinars
http://www.rheosense.com/applications
Project for engineering and school students.
In this project, you can find everything related to the concept of viscosity :- Definition, Derivation, Units, Kinematic viscosity. Newton's law of viscosity, variation of viscosity with temperature, types of fluids are also included. If you find it helpful to you, give some feedback.
Thank You very much :)
This is an article on viscosity. It compares dynamic, absolute and kinematic viscosities, as well as their units. It is detailed and very good reading.
A non-Newtonian fluid is a fluid that does not follow Newton's law of viscosity, i.e., constant viscosity independent of stress. In non-Newtonian fluids, viscosity can change when under force to either more liquid or more solid. Ketchup, for example, becomes runnier when shaken and is thus a non-Newtonian fluid.
I have prepared this presentation after successful commissioning of two such Multivariable Transmitters with 1595 Conditioning Orifice, used to measure raw gas of two trains in OMV (Pakistan) Exploration GmbH. Sawan gas processing plant,
Simple, basic principles and techiniques for flow measurement.
college presentation
Please like and leave a comment if it was useful.
Also leave suggestions, if any.
It will help me improve.
Viscosity and yield point exp. by jarjis
Experiment Number 5: Yield Point.
Koya University.
Faculty of Engineering.
Drilling Lab
Supervised By Muhammad Jamal
Determine Plastic Viscosity, Apparent Viscosity, And Yield point of a drilling fluid (mud) by using Fann VG viscometer.
=============
This a report about Filtration. written by Jarjis Muhammad, Petroleum Engineering Dep. Koya University. For more Information please contact me: www.facebook.com/Jarjis.shaqlawaee
Rheology is the investigation of the progression of issue, fundamentally in a fluid state, yet in addition as "delicate solids" or solids under conditions in which they react with plastic stream as opposed to distorting flexibly because of an applied power. Rheology is the study of misshapening and stream inside a material.
CFD Lecture (8/8): CFD in Chemical SystemsAbhishek Jain
Above lecture can be downloaded from www.zeusnumerix.com
The presentation aims at explaining to the user the simulations that happen in the chemical industry. These simulations are characterized by the chemical reactions, mixing of fluids, particle flow etc. The standard NS equations requirement introduction of source terms and special methods for CFD simulations and these have been introduced.
Speaks about the different aspects of flow measurement i.e. flow types, fluid types, its units, selection parameters; definition of common terms, coanda effect coriolis effect . it also speaks about the factors affecting flow measurement.
THE WORKSHOP:
This practical workshop covers all the essentials of process control and tools to optimise the operation of your plant and process, including the ability to perform effective loop tuning.
Practical process control is aimed at engineers and technicians who wish to have a clear, practical understanding of the essentials of process control and loop tuning, as well as how to optimise the operation of their particular plant or process. These persons would typically be primarily involved in the design, implementation and upgrading of industrial control systems. Mathematical theory has been kept to a minimum with the emphasis throughout on practical applications and useful information.
Inspection, Testing and Commissioning of Electrical Switchboards, Circuit Bre...Living Online
THE WORKSHOP:
Whether you are designing, specifying, installing, testing or commissioning electrical equipment from small to large commercial and industrial installations, you need to have a thorough understanding of switchboards, switchgear, circuit breakers and associated protective relays.
The overall focus of this workshop is on electrical inspection, testing and commissioning and will commence with a detailed examination of switchgear (and circuit breakers). Circuit breakers are critical components in electrical distribution systems and their operation significantly affects the overall operation of the system. Protection relays are then discussed. These are used in power systems to maximise continuity of supply and are found in both small and large power systems from generation, through transmission, distribution and utilisation of power in plant, industrial and commercial equipment.
We cover commissioning and periodic inspection of cables and their various failure modes and how to detect these faults. The often neglected topic of switchboards will be detailed next, followed by the interesting topic of interfacing to the control system (either PLC’s or other control devices).
Case studies and practical sessions are used throughout to illustrate key practical principles.
This workshop covers key elements in a practical and project focused way. Many people assume (wrongly) that inspecting, testing and commissioning is a fairly straightforward process and is simply a rubber stamp confirmation of a so-called outstanding design. Our experience in the field demonstrates quite the opposite; where the litany of problems ranges from design and installation errors to equipment manufacturing defects. It is best that these problems are identified and corrected before the inevitable downtime comes in an operational installation where many thousands of dollars are lost in correcting the faults. The situation today is made more challenging by the heightened safety requirements and interfacing to low powered electronic control and monitoring devices (such as PLC’s) using software that has to also be verified.
Hands on Data Communications, Networking & TCP/IP TroubleshootingLiving Online
THE WORKSHOP:
Data communication is given high priority in today’s industrial environment. This workshop is designed to be hands-on, providing the participants with essential knowledge and helping them to understand and troubleshoot systems.
This is a comprehensive two-day hands-on workshop that covers practical aspects of data communication such as serial communications, Ethernet networking, TCP/IP, Modbus, wireless communications and security.
This workshop is for enthusiastic engineers and technicians who wish to develop and enhance their practical knowledge in the field of data communications and networking. It will help them to understand the concepts behind data transmission, the various protocols involved, and the topologies that govern data exchange among various systems in industry. It will also equip them with the skills and tools to design and/or maintain these systems on an ongoing basis.
Fundamentals of Instrumentation, Process Control, PLCs and SCADA for Plant Op...Living Online
THE WORKSHOP:
This course represents a tremendous opportunity to gain expertise in all the key areas of the fast growing area of industrial automation in two days. Presented by an expert in the area but who is passionate with getting the key chunks of know-how and expertise across to you in a simple understandable manner which you can immediately apply to your job. This is most definitely not a boring lecture style presentation but an intensive learning experience where you will walk away with real skills as a result of the hands-on practical exercises, calculations, case studies and group sessions to ensure an understanding of the concepts and ideas discussed. You will undertake practical sessions at approximately 20 to 30 minute intervals to maximise the absorption rate.
Practical Alarm Management for Engineers and TechniciansLiving Online
The manual focuses on simple and practical information for personnel ranging from operators all the way up to supervisors, engineers and managers.
FOR MORE INFORMATION: http://www.idc-online.com/content/practical-alarm-management-engineers-and-technicians-26?id=8
Forklift Classes Overview by Intella PartsIntella Parts
Discover the different forklift classes and their specific applications. Learn how to choose the right forklift for your needs to ensure safety, efficiency, and compliance in your operations.
For more technical information, visit our website https://intellaparts.com
Courier management system project report.pdfKamal Acharya
It is now-a-days very important for the people to send or receive articles like imported furniture, electronic items, gifts, business goods and the like. People depend vastly on different transport systems which mostly use the manual way of receiving and delivering the articles. There is no way to track the articles till they are received and there is no way to let the customer know what happened in transit, once he booked some articles. In such a situation, we need a system which completely computerizes the cargo activities including time to time tracking of the articles sent. This need is fulfilled by Courier Management System software which is online software for the cargo management people that enables them to receive the goods from a source and send them to a required destination and track their status from time to time.
Industrial Training at Shahjalal Fertilizer Company Limited (SFCL)MdTanvirMahtab2
This presentation is about the working procedure of Shahjalal Fertilizer Company Limited (SFCL). A Govt. owned Company of Bangladesh Chemical Industries Corporation under Ministry of Industries.
COLLEGE BUS MANAGEMENT SYSTEM PROJECT REPORT.pdfKamal Acharya
The College Bus Management system is completely developed by Visual Basic .NET Version. The application is connect with most secured database language MS SQL Server. The application is develop by using best combination of front-end and back-end languages. The application is totally design like flat user interface. This flat user interface is more attractive user interface in 2017. The application is gives more important to the system functionality. The application is to manage the student’s details, driver’s details, bus details, bus route details, bus fees details and more. The application has only one unit for admin. The admin can manage the entire application. The admin can login into the application by using username and password of the admin. The application is develop for big and small colleges. It is more user friendly for non-computer person. Even they can easily learn how to manage the application within hours. The application is more secure by the admin. The system will give an effective output for the VB.Net and SQL Server given as input to the system. The compiled java program given as input to the system, after scanning the program will generate different reports. The application generates the report for users. The admin can view and download the report of the data. The application deliver the excel format reports. Because, excel formatted reports is very easy to understand the income and expense of the college bus. This application is mainly develop for windows operating system users. In 2017, 73% of people enterprises are using windows operating system. So the application will easily install for all the windows operating system users. The application-developed size is very low. The application consumes very low space in disk. Therefore, the user can allocate very minimum local disk space for this application.
Quality defects in TMT Bars, Possible causes and Potential Solutions.PrashantGoswami42
Maintaining high-quality standards in the production of TMT bars is crucial for ensuring structural integrity in construction. Addressing common defects through careful monitoring, standardized processes, and advanced technology can significantly improve the quality of TMT bars. Continuous training and adherence to quality control measures will also play a pivotal role in minimizing these defects.
Cosmetic shop management system project report.pdfKamal Acharya
Buying new cosmetic products is difficult. It can even be scary for those who have sensitive skin and are prone to skin trouble. The information needed to alleviate this problem is on the back of each product, but it's thought to interpret those ingredient lists unless you have a background in chemistry.
Instead of buying and hoping for the best, we can use data science to help us predict which products may be good fits for us. It includes various function programs to do the above mentioned tasks.
Data file handling has been effectively used in the program.
The automated cosmetic shop management system should deal with the automation of general workflow and administration process of the shop. The main processes of the system focus on customer's request where the system is able to search the most appropriate products and deliver it to the customers. It should help the employees to quickly identify the list of cosmetic product that have reached the minimum quantity and also keep a track of expired date for each cosmetic product. It should help the employees to find the rack number in which the product is placed.It is also Faster and more efficient way.
Student information management system project report ii.pdfKamal Acharya
Our project explains about the student management. This project mainly explains the various actions related to student details. This project shows some ease in adding, editing and deleting the student details. It also provides a less time consuming process for viewing, adding, editing and deleting the marks of the students.
Overview of the fundamental roles in Hydropower generation and the components involved in wider Electrical Engineering.
This paper presents the design and construction of hydroelectric dams from the hydrologist’s survey of the valley before construction, all aspects and involved disciplines, fluid dynamics, structural engineering, generation and mains frequency regulation to the very transmission of power through the network in the United Kingdom.
Author: Robbie Edward Sayers
Collaborators and co editors: Charlie Sims and Connor Healey.
(C) 2024 Robbie E. Sayers
Immunizing Image Classifiers Against Localized Adversary Attacksgerogepatton
This paper addresses the vulnerability of deep learning models, particularly convolutional neural networks
(CNN)s, to adversarial attacks and presents a proactive training technique designed to counter them. We
introduce a novel volumization algorithm, which transforms 2D images into 3D volumetric representations.
When combined with 3D convolution and deep curriculum learning optimization (CLO), itsignificantly improves
the immunity of models against localized universal attacks by up to 40%. We evaluate our proposed approach
using contemporary CNN architectures and the modified Canadian Institute for Advanced Research (CIFAR-10
and CIFAR-100) and ImageNet Large Scale Visual Recognition Challenge (ILSVRC12) datasets, showcasing
accuracy improvements over previous techniques. The results indicate that the combination of the volumetric
input and curriculum learning holds significant promise for mitigating adversarial attacks without necessitating
adversary training.
Event Management System Vb Net Project Report.pdfKamal Acharya
In present era, the scopes of information technology growing with a very fast .We do not see any are untouched from this industry. The scope of information technology has become wider includes: Business and industry. Household Business, Communication, Education, Entertainment, Science, Medicine, Engineering, Distance Learning, Weather Forecasting. Carrier Searching and so on.
My project named “Event Management System” is software that store and maintained all events coordinated in college. It also helpful to print related reports. My project will help to record the events coordinated by faculties with their Name, Event subject, date & details in an efficient & effective ways.
In my system we have to make a system by which a user can record all events coordinated by a particular faculty. In our proposed system some more featured are added which differs it from the existing system such as security.
Hybrid optimization of pumped hydro system and solar- Engr. Abdul-Azeez.pdffxintegritypublishin
Advancements in technology unveil a myriad of electrical and electronic breakthroughs geared towards efficiently harnessing limited resources to meet human energy demands. The optimization of hybrid solar PV panels and pumped hydro energy supply systems plays a pivotal role in utilizing natural resources effectively. This initiative not only benefits humanity but also fosters environmental sustainability. The study investigated the design optimization of these hybrid systems, focusing on understanding solar radiation patterns, identifying geographical influences on solar radiation, formulating a mathematical model for system optimization, and determining the optimal configuration of PV panels and pumped hydro storage. Through a comparative analysis approach and eight weeks of data collection, the study addressed key research questions related to solar radiation patterns and optimal system design. The findings highlighted regions with heightened solar radiation levels, showcasing substantial potential for power generation and emphasizing the system's efficiency. Optimizing system design significantly boosted power generation, promoted renewable energy utilization, and enhanced energy storage capacity. The study underscored the benefits of optimizing hybrid solar PV panels and pumped hydro energy supply systems for sustainable energy usage. Optimizing the design of solar PV panels and pumped hydro energy supply systems as examined across diverse climatic conditions in a developing country, not only enhances power generation but also improves the integration of renewable energy sources and boosts energy storage capacities, particularly beneficial for less economically prosperous regions. Additionally, the study provides valuable insights for advancing energy research in economically viable areas. Recommendations included conducting site-specific assessments, utilizing advanced modeling tools, implementing regular maintenance protocols, and enhancing communication among system components.
4. Practical Industrial Flow Measurement
Objectives
When you have completed this chapter you should be able to:
• Describe the basic concept of viscosity
• Define the differences between Newtonian and non-Newtonian fluids including
plastic, pseudoplastic and dilatant
• Describe the differences between ideal, laminar and turbulent flow profiles and
how the Reynolds number may be used to describe their behaviour
• Examine the problems of swirl
• List the various parameters used to define flow measurement
1.1 Introduction
Over the last fifty years, the importance of flow measurement has grown, not only
because of its widespread use for accounting purposes, such as the custody transfer
of fluid from supplier to consumer, but also because of its application in
manufacturing processes. Throughout this period, performance requirements have
become more stringent — with unrelenting pressure for improved reliability,
accuracy, linearity, repeatability and rangeability.
These pressures have been caused not only by major changes in manufacturing
processes, but also because of several dramatic circumstantial changes, such as the
increase in the cost of fuel and raw materials and the need to minimise pollution.
Industries involved in flow measurement and control include:
• food and beverage;
• medical;
• mining and metallurgical;
• oil and gas transport;
• petrochemical;
• pneumatic and hydraulic transport of solids;
• power generation;
• pulp and paper; and
• water distribution.
Fluid properties can vary enormously from industry to industry. The fluid may be
toxic, flammable, abrasive, radio-active, explosive or corrosive; it may be single-phase
(clean gas, water or oil) or multi-phase (e.g. slurries, wet steam, unrefined
petroleum, or dust laden gases). The pipe carrying the fluid may vary from less than
1 mm to many metres in diameter. The fluid temperature may vary from close to
absolute zero to several hundred degrees centigrade, and the pressure may vary from
high vacuum to many atmospheres.
Because of this large variation in fluid properties and flow applications, many
flowmeter techniques have been developed with each suited to a particular area.
Version 2.0 3
5. Practical Industrial Flow Measurement
However, of the numerous flow metering techniques that have been proposed in the
past, only a few have found widespread application and no one single flowmeter can
be used for all applications.
1.2 Basic fluid properties
One of the most important primary properties of a fluid (liquid or gas) is its viscosity
— its resistance to flow or to objects passing through it.
In essence viscosity is an internal frictional force between the different layers of the
fluid as they move past one another. In a liquid, this is due to the cohesive forces
between the molecules whilst in a gas it arises from collisions between the
molecules.
Different fluids possess different viscosities: treacle is more viscous than water; and
gearbox oil (SAE 90) is more viscous than light machine oil (e.g. 3-in-1).
If the fluid is regarded as a collection of moving plates, one on top of the other, then
the viscosity is a measure of the resistance offered by a layer between adjacent
plates.
Figure 1.1 shows a thin layer of fluid sandwiched between two flat metal plates —
the lower plate being stationary and the upper plate moving with velocity V. The
fluid directly in contact with each plate is held to the surface by the adhesive force
between the molecules of the fluid and those of the plate. Thus the upper surface of
the fluid moves at the same speed V as the upper plate whilst the fluid in contact
with the stationary plate remains stationary. Since the stationary layer of fluid
retards the flow of the layer just above it and this layer, in turn, retards the flow of
the next layer, the velocity varies linearly from 0 to V, as shown.
Moving plate v
Stationary plate
Velocity
gradient
Figure 1.1. Explanation of viscosity with a thin layer of fluid sandwiched between
two flat metal plates.
Version 2.0 4
6. Practical Industrial Flow Measurement
In this manner, the fluid flows under the action of a shear stress due to the motion of
the upper plate. It is also clear that the lower plate exerts an equal and opposite shear
stress in order to satisfy a ‘no-slip’ condition at the lower stationary surface. It
follows, therefore, that the shear stress at any point in the flow, is directly
proportional to the velocity gradient or ‘shear rate’. Thus:
Shear stress ∝ Shear gradient
or: Shear stress = K. Shear gradient
where: K is the dynamic viscosity (μ) measured in Pascal-Seconds (Pa.s).
In the cgs system, dynamic viscosity was formerly measured in poise, centipoise or
(in the case of gases) micropoise where:
1 Pa.s = 10 poise
The viscosity of a fluid varies with changes in both pressure and temperature. To
this effect, Table 1.1 lists the viscosity of various fluids at specified temperatures —
the viscosity of liquids such as motor oil, for example, decreasing rapidly as
temperature increases.
Surprisingly, pressure has less effect on the viscosity of gases than on liquids.
A pressure increase from 0 to 70 bar (in air) results in only an approximate 5%
increase in viscosity. However, with methanol, for example, a 0 to 15 bar increase
results in a 10-fold increase in viscosity. Some liquids are more sensitive to changes
in pressure and some less.
The term dynamic viscosity is used to distinguish it from kinematic viscosity.
Kinematic viscosity is density related viscosity and is given by:
v = μ / ρ
where:
v = kinematic viscosity measured in m2/s;
μ = dynamic viscosity measured in Pa.s; and
ρ = density of the liquid (kg/m3).
Kinematic viscosity was formerly measured in stokes or centistokes where:
1 stoke = 1/104 m2/s
Version 2.0 5
7. Practical Industrial Flow Measurement
Table 1. Comparison of the viscosities of various fluids.
Fluid Temperature
(°C)
Viscosity μ
(Pa.s)
Molasses 20 100
Glycerine 20 1,5
Engine oil (SAE
30 0,2
10)
Milk 20 5 x 10 -3
Blood 37 4 x 10 -3
Water 0 1,8 x 10 -3
Ethyl alcohol 20 1,2 x 10 -3
Water 20 1 x 10 -3
Water 100 0,3 x 10 -3
Air 20 0.018 x 10 -3
Water vapour 100 0,013 x 10 -3
Hydrogen 0 0,009 x 10 -3
1.3 Non-Newtonian fluids
The majority of fluids used in engineering systems exhibit Newtonian behaviour in
that, for a given value of pressure and temperature, the shear stress is directly
proportional to the shear rate. Thus, if the shear stress is plotted against shear rate
the result is a straight line passing through the origin (Figure 1.2).
There are, however, certain fluids that do not exhibit this behaviour. Examples
include: tar, grease, printers’ ink, colloidal suspensions, hydrocarbon compounds
having long-chain molecules, and polymer solutions.
Ideal plastic
Newtonian
Shear rate
Shear
stress
Yield point
Pseudoplastic
Dilatant
Figure 1.2. The shear stress plotted against shear rate for a number of
materials. For Newtonian materials the shear stress plotted against
shear rate results in a straight line passing through the origin.
Version 2.0 6
8. Practical Industrial Flow Measurement
1.3.1 The ideal plastic
The so-called ‘ideal plastic’ again exhibits a linear relationship between shear stress
and shear rate. However, such substances will only flow after a definite yield point
has been exceeded (Figure 1.2).
When at rest, these materials possess sufficient rigidity to resist shear stresses
smaller than the yield stress. Once exceeded, however, this rigidity is overcome and
the material flows in much the same manner as a Newtonian fluid.
Examples of materials exhibiting this type of behaviour include: tar; chewing gum;
grease; slurries; sewage slugs; and drilling muds.
1.3.2 Pseudoplastic
A pseudoplastic substance, such as printer’s ink, is characterised by certain polymers
and hydrocarbons possessing long-chain molecules and suspensions of asymmetric
particles. Although exhibiting a zero yield stress, the relationship between shear
stress and shear rate is non-linear and the viscosity decreases as the shear stress
increases.
1.3.3 Dilatant
Dilatant materials also exhibit a non-linear relationship between shear stress and
shear rate and a zero yield stress. However, in this case, the viscosity increases as
the shear stress increases.
This type of behaviour is found in highly concentrated suspensions of solid
particles. At low rates of shear, the liquid lubricates the relative motion of adjacent
particles, thereby maintaining relatively low stress levels. As the shear rate
increases, the effectiveness of this lubrication is reduced and the shear stresses are
consequently increased.
1.4 Velocity profiles
One of the most important fluid characteristics affecting flow measurement is the
shape of the velocity profile in the direction of flow.
1.4.1 Ideal profile
In a frictionless pipe in which there is no retardation at the pipe walls, a flat ‘ideal’
velocity profile would result (Figure 1.3) in which all the fluid particles move at the
same velocity.
Version 2.0 7
9. Practical Industrial Flow Measurement
Figure 1.3. A flat ‘ideal’ velocity profile.
However, we have already seen that real fluids do not ‘slip’ at a solid boundary but
are held to the surface by the adhesive force between the fluid molecules and those
of the pipe. Consequently, at the fluid/pipe boundary, there is no relative motion
between the fluid and the solid.
At low flow rates the fluid particles will move in straight lines in a laminar manner
— with each fluid layer flowing smoothly past adjacent layers with no mixing
between the fluid particles in the various layers. As a result the flow velocity
increases from zero, at the pipe walls, to a maximum value at the centre of the pipe
and a velocity gradient exists across the pipe.
1.4.2 Laminar flow
The shape of a fully developed velocity profile for such a laminar flow is parabolic,
as shown in Figure 1.4, with the velocity at the centre being equal to twice the mean
flow velocity. Clearly, this concentration of velocity at the centre of the pipe can
compromise the flow computation if not corrected for.
Figure 1.4. A laminar ‘parabolic’ velocity profile.
Version 2.0 8
10. Practical Industrial Flow Measurement
1.4.3 Turbulent flow
For a given pipe and liquid, as the flow rate increases, the paths of the individual
particles of fluid are no longer straight but intertwine and cross each other in a
disorderly manner so that thorough mixing of the fluid takes place. This is termed
turbulent flow.
As shown in Figure 1.5, the velocity profile for turbulent flow is flatter than for
laminar flow and thus closer approximates to the ‘ideal’ or ‘one dimensional’ flow.
Figure 1.5. A turbulent velocity profile.
1.4.4 Swirl
Turbulent flow should not be confused with swirl or disturbed flow that can cause an
asymmetric flow profile (Figure 1.6). Obstructions in the pipe, such as elbows,
steps, control valves, and T-pieces, can produce vortices or swirls in the fluid flow
that can severely affect measurement accuracy. Indeed, such disturbances can have
an important bearing on accuracy for as much as 40 pipe diameters ahead of the
measuring device.
The effects of swirls can be minimised by the use of a flow conditioner, or
straightener in the upstream line.
Figure 1.6. Asymmetric flow profile due to disturbed flow.
Version 2.0 9
11. Practical Industrial Flow Measurement
1.5 Reynolds number
The onset of turbulence is often abrupt and in order to be able to predict the type of
flow present in a pipe, for any application, use is made of the Reynolds number, Re
— a dimensionless number given by:
Version 2.0
10
Re = ρvD/μ
where:
ρ = density of fluid (kg/m3)
μ = viscosity of fluid (Pa.s)
v = mean flow velocity (m/s)
D = diameter of pipe (m).
Osborne Reynolds (1842-1912) showed that irrespective of the pipe diameter, type of
fluid, or velocity, then the flow is:
Laminar: Re < 2000
Transitional: Re 2000 - 4000
Turbulent: Re > 4000
From the foregoing it is seen that, in addition to viscosity, Re is also dependent on
density.
Since most liquids are pretty well incompressible, the density varies only slightly
with temperature. However, for gases, the density is strongly dependent on the
temperature and pressure in which (for ideal gas):
PV = mRT
where:
P = pressure (Pa);
V = volume of the gas (m3);
T = temperature (K)
m = number of moles; and
R = universal gas constant (8,315 J/(mol.K))
Since:
ρ = m/V = P/RT
Most gases may be considered ideal at room temperatures and low pressures.
Both laminar and turbulent flow profiles require time and space to develop. At an
entrance to a pipe, the profile may be very flat — even at low Re. And it may stay
laminar, for a short time, even at high Re.
12. Practical Industrial Flow Measurement
1.6 Flow measurement
In flow measurement a number of parameters can be used to describe the rate at
which a fluid is flowing:
1.6.1 Volumetric flow rate
The volumetric flow rate, Q, represents the total volume of fluid flowing through a
pipe per unit of time and is usually expressed in litres per second (ℓ/s) or cubic
metres per hour (m3/h). The measurement of volumetric flow rate is most frequently
achieved by measuring the velocity of a fluid as it travels through a pipe of known
cross sectional area.
1.6.2 Velocity
The term velocity is often used very loosely to describe the speed at which the fluid
passes a point along the pipe. In reality, most modern flowmeters measure either the
point velocity or the mean velocity.
1.6.3 Point velocity
The point velocity is the flow velocity in a localised region or point, in the fluid and
is, generally of little use in practice. It is used mainly in research to determine, for
example, velocity profiles or flow patterns.
1.6.4 Mean flow velocity
v
The mean flow velocity, , can be obtained by measuring the volumetric flowrate,
Q, and dividing it by the cross-sectional area of the pipe, A:
Version 2.0
11
= Q/A (m/s)
v
v
Alternatively, if the velocity profile is known the mean flow velocity can be
obtained by averaging the velocity over the velocity profile, giving equal weighing to
equal annular regions.
An example of the calculation of the mean velocity of the flow conduit by area-weighting
point-velocity measurements is illustrated in Figure 1.7, in which a
number of velocity bands are scaled across the cross-sectional area of a 320 mm
diameter conduit.
13. Practical Industrial Flow Measurement
76 cm/s
107 cm/s
120 cm/s
130 cm/s
A
B
C
D
Radius
(mm) 160 120 80 40 0
Figure 1.7. Example of area weighted technique for determining the mean velocity
Version 2.0
12
of a fluid.
The mean velocity can be determined using standard averaging techniques in which
the velocities of each band are summed and then divided by the number of bands:
VAV = (VA + VB + VC + VD)/4 = 108.25 cm/s.
In the area-weighted technique, the scaled areas, velocities and the products of each
area, times its local velocity, are tabulated for each velocity band (Table 5). The
area-weighted mean velocity is calculated by summing the velocity-area products,
and dividing the sum of the cross-sectional area of the flow conduit.
Table 5. Calculations for determination of area-weighted mean velocity
Band Radius
(cm)
Velocity
(cm/s)
Area
(cm2)
Vn . An
ABCD
4.0
8.0
12.0
16.0
130
120
107
76
50.26
150.80
251.33
351.86
6533
18096
26892
26741
Total 804.25 78262
( )
V
V ⋅
A
Total area
= n n = 97.31 cm /
s
The error thus obtained using the standard averaging technique is:
( )
Error
V V
AV
V
AV
=
−
= 10.11%
14. Practical Industrial Flow Measurement
1.7 Mass flow rate
Most chemical reactions are largely based on their mass relationship and,
consequently, in order to control the process more accurately, it is often desirable to
measure the mass flow of the product. The mass flow rate, W, gives the total mass
of fluid flowing at any instant in time. A knowledge of volume flow rate, Q and the
fluid density, ρ, determines the mass flow rate from:
Version 2.0
13
W = Q. ρ (kg/s)
Some flowmeters, such as Coriolis meters, measure the mass flow directly.
However, in many cases, mass flow is determined by measuring the volumetric flow
and the density and then calculating the mass flow as shown above. Sometimes the
density is inferred from the measurement of the pressure and temperature of the
fluid. This type of measurement is referred to as the inferred method of measuring
mass flow.
1.8 Multi-phase flows
For multi-phase flows, the mass or volume flow rate of one of the constituents is
often of interest. For example, in the case of a slurry, the mass flow rate of the solid
phase is usually the required variable.
1.8.1 Rangeability
Rangeability is the ratio of maximum to minimum flow. Rangeability is used to give
a relative measure of the range of flows that can be controlled.
Rangeability
Q
Q
= max
min