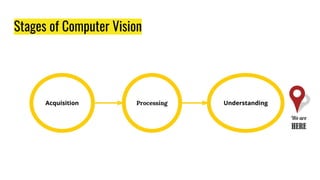
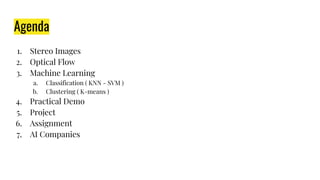
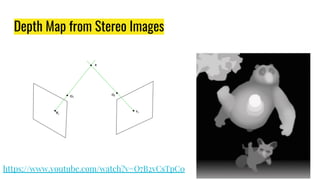
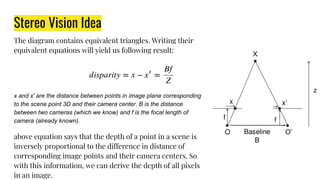
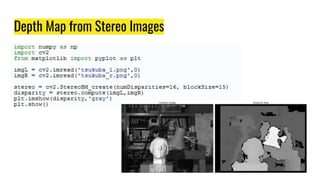
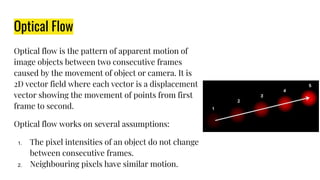
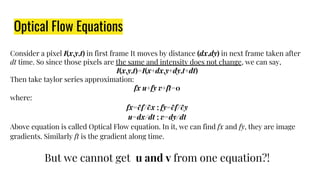
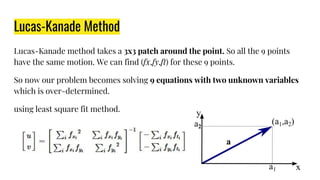
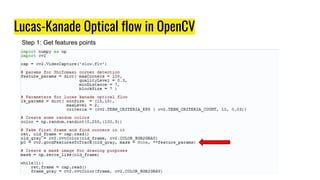
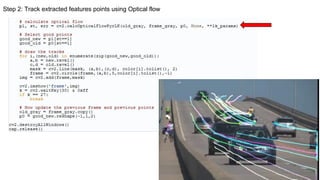
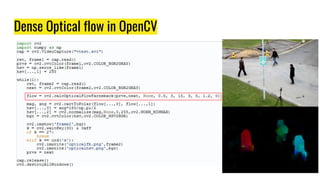
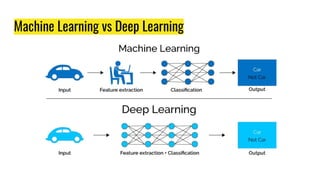
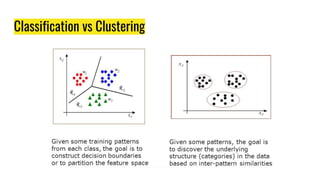
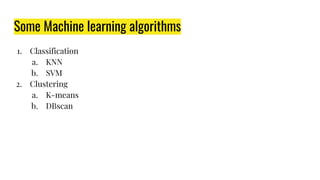
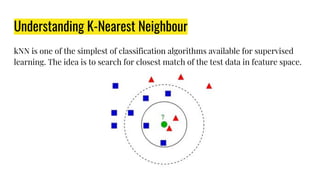
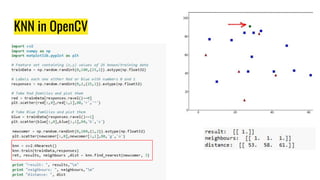
The document provides an agenda for a practical session on digital image processing. It discusses stages of computer vision including stereo images, optical flow, and machine learning techniques like classification and clustering. Stereo vision and depth maps from stereo images are explained. Optical flow concepts like the Lucas-Kanade method are covered. Machine learning algorithms like KNN, SVM, and K-means clustering are also summarized. The document concludes with information about a project, assignment, and notable AI companies in Egypt.
Build Your Own 3D Scanner: Surface ReconstructionDouglas Lanman
Build Your Own 3D Scanner:
Surface Reconstruction
http://mesh.brown.edu/byo3d/
SIGGRAPH 2009 Courses
Douglas Lanman and Gabriel Taubin
This course provides a beginner with the necessary mathematics, software, and practical details to leverage projector-camera systems in their own 3D scanning projects. An example-driven approach is used throughout; each new concept is illustrated using a practical scanner implemented with off-the-shelf parts. The course concludes by detailing how these new approaches are used in rapid prototyping, entertainment, cultural heritage, and web-based applications.
Video surveillance is active research topic in
computer vision research area for humans & vehicles, so it is
used over a great extent. Multiple images generated using a fixed
camera contains various objects, which are taken under different
variations, illumination changes after that the object’s identity
and orientation are provided to the user. This scheme is used to
represent individual images as well as various objects classes in a
single, scale and rotation invariant model.The objective is to
improve object recognition accuracy for surveillance purposes &
to detect multiple objects with sufficient level of scale
invariance.Multiple objects detection& recognition is important
in the analysis of video data and higher level security system. This
method can efficiently detect the objects from query images as
well as videos by extracting frames one by one. When given a
query image at runtime, by generating the set of query features
and it will find best match it to other sets within the database.
Using SURF algorithm find the database object with the best
feature matching, then object is present in the query image.
Edge detection is still difficult task in the image processing field. In this paper we implemented fuzzy techniques for detecting edges in the image. This algorithm also works for medical images. In this paper we also explained about Fuzzy inference system, which is more robust to contrast and lighting variations.
Hybrid Technique for Copy-Move Forgery Detection Using L*A*B* Color Space IJEEE
Copy-move forgery is applied on an image to hide a region or an object. Most of the detection techniques either use transform domain or spatial domain information to detect the forgery. This paper presents a hybrid method to detect the forgery making use of both the domains i.e. transform domain in whichSVD is used to extract the useful information from image and spatial domain in which L*a*b* color space is used. Here block based approach and lexicographical sorting is used to group matching feature vectors. Obtained experimental results demonstrate that proposed method efficiently detects copy-move forgery even when post-processing operations like blurring, noise contamination, and severe lossy compression are applied.
This Algorithm is better than canny by 0.7% but lacks the speed and optimization capability which can be changed by including Neural Network and PSO searching to the same.
This used dual FIS Optimization technique to find the high frequency or the edges in the images and neglect the lower frequencies.
Divide the examined window into cells (e.g. 16x16 pixels for each cell).
2- For each pixel in a cell, compare the pixel to each of its 8 neighbors (on its left-top, leftmiddle,
left-bottom, right-top, etc.). Follow the pixels along a circle, i.e. clockwise or counterclockwise.
3- Where the center pixel's value is greater than the neighbor's value, write "1". Otherwise,
write "0". This gives an 8-digit binary number (which is usually converted to decimal for
convenience).
4- Compute the histogram, over the cell, of the frequency of each "number" occurring (i.e.,
each combination of which pixels are smaller and which are greater than the center).
Study and Comparison of Various Image Edge Detection TechniquesCSCJournals
Edges characterize boundaries and are therefore a problem of fundamental importance in image processing. Image Edge detection significantly reduces the amount of data and filters out useless information, while preserving the important structural properties in an image. Since edge detection is in the forefront of image processing for object detection, it is crucial to have a good understanding of edge detection algorithms. In this paper the comparative analysis of various Image Edge Detection techniques is presented. The software is developed using MATLAB 7.0. It has been shown that the Canny’s edge detection algorithm performs better than all these operators under almost all scenarios. Evaluation of the images showed that under noisy conditions Canny, LoG( Laplacian of Gaussian), Robert, Prewitt, Sobel exhibit better performance, respectively. . It has been observed that Canny’s edge detection algorithm is computationally more expensive compared to LoG( Laplacian of Gaussian), Sobel, Prewitt and Robert’s operator
Performance analysis of chain code descriptor for hand shape classificationijcga
Feature Extraction is an important task for any Image processing application. The visual properties of any image are its shape, texture and colour. Out of these shape description plays important role in any image classification. The shape description method classified into two types, contour base and region based. The contour base method concentrated on the shape boundary line and the region based method considers whole area. In this paper, contour based, the chain code description method was experimented for different hand shape.
The chain code descriptor of various hand shapes was calculated and tested with different classifier such as k-nearest- neighbour (k-NN), Support vector machine (SVM) and Naive Bayes. Principal component analysis (PCA) was applied after the chain code description. The performance of SVM was found better than k-NN and Naive Bayes with recognition rate 93%.
Image Interpolation Techniques with Optical and Digital Zoom Concepts -semina...mmjalbiaty
full details about Spatial and Intensity Resolution , optical and digital zoom concepts and the common three interpolation algorithms for implementing zoom in image processing
3D Reconstruction from Multiple uncalibrated 2D Images of an ObjectAnkur Tyagi
3D reconstruction is the process of capturing the shape and appearance of real objects. In this project we are using passive methods which only use sensors to measure the radiance reflected or emitted by the objects surface to infer its 3D structure.
Initial Introduction of Image processing is included in these slides which contain 1. Introduction of Image Processing
2.Elements of visual perception
3. Image sensing and Quantization
4.A simple image formation model
5.Basic concept of Sampling and Quantization
Reader will find it easy to understand the topics described here in slides . A detailed description of each topic illustrated here.
Please read and if you like do comments also.... Thanks
Template matching is a basic method in image analysis to extract useful information from images. In this
paper, we suggest a new method for pattern matching. Our method transform the template image from two
dimensional image into one dimensional vector. Also all sub-windows (same size of template) in the
reference image will transform into one dimensional vectors. The three similarity measures SAD, SSD, and
Euclidean are used to compute the likeness between template and all sub-windows in the reference image
to find the best match. The experimental results show the superior performance of the proposed method
over the conventional methods on various template of different sizes.
A STUDY AND ANALYSIS OF DIFFERENT EDGE DETECTION TECHNIQUEScscpconf
In the first study [1], a combination of K-means, watershed segmentation method, and Difference In Strength (DIS) map were used to perform image segmentation and edge detection
tasks. We obtained an initial segmentation based on K-means clustering technique. Starting from this, we used two techniques; the first is watershed technique with new merging
procedures based on mean intensity value to segment the image regions and to detect their boundaries. The second is edge strength technique to obtain accurate edge maps of our images without using watershed method. In this technique: We solved the problem of undesirable over segmentation results produced by the watershed algorithm, when used directly with raw data images. Also, the edge maps we obtained have no broken lines on entire image. In the 2nd study level set methods are used for the implementation of curve/interface evolution under various forces. In the third study the main idea is to detect regions (objects) boundaries, to isolate and extract individual components from a medical image. This is done using an active contours to detect regions in a given image, based on techniques of curve evolution, Mumford–Shah functional for segmentation and level sets. Once we classified our images into different intensity regions based on Markov Random Field. Then we detect regions whose boundaries are not necessarily defined by gradient by minimize an energy of Mumford–Shah functional forsegmentation, where in the level set formulation, the problem becomes a mean-curvature which will stop on the desired boundary. The stopping term does not depend on the gradient of the image as in the classical active contour. The initial curve of level set can be anywhere in the image, and interior contours are automatically detected. The final image segmentation is one
closed boundary per actual region in the image.
A COMPARATIVE ANALYSIS OF RETRIEVAL TECHNIQUES IN CONTENT BASED IMAGE RETRIEVALcscpconf
Basic group of visual techniques such as color, shape, texture are used in Content Based Image Retrievals (CBIR) to retrieve query image or sub region of image to find similar images in image database. To improve query result, relevance feedback is used many times in CBIR to help user to express their preference and improve query results. In this paper, a new approach for image retrieval is proposed which is based on the features such as Color Histogram, Eigen Values and Match Point. Images from various types of database are first identified by using edge detection techniques .Once the image is identified, then the image is searched in the particular database, then all related images are displayed. This will save the retrieval time. Further to retrieve the precise query image, any of the three techniques are used and comparison is done w.r.t. average retrieval time. Eigen value technique found to be the best as compared with other two techniques.
A comparative analysis of retrieval techniques in content based image retrievalcsandit
Basic group of visual techniques such as color, shape, texture are used in Content Based Image
Retrievals (CBIR) to retrieve query image or sub region of image to find similar images in
image database. To improve query result, relevance feedback is used many times in CBIR to
help user to express their preference and improve query results. In this paper, a new approach
for image retrieval is proposed which is based on the features such as Color Histogram, Eigen
Values and Match Point. Images from various types of database are first identified by using
edge detection techniques .Once the image is identified, then the image is searched in the
particular database, then all related images are displayed. This will save the retrieval time.
Further to retrieve the precise query image, any of the three techniques are used and
comparison is done w.r.t. average retrieval time. Eigen value technique found to be the best as
compared with other two techniques.
Introducing New Parameters to Compare the Accuracy and Reliability of Mean-Sh...sipij
Mean shift algorithms are among the most functional tracking methods which are accurate and have almost simple computation. Different versions of this algorithm are developed which are differ in template updating and their window sizes. To measure the reliability and accuracy of these methods one should normally rely on visual results or number of iteration. In this paper we introduce two new parameters which can be used to compare the algorithms especially when their results are close to each other.
Performance Improvement of Vector Quantization with Bit-parallelism HardwareCSCJournals
Vector quantization is an elementary technique for image compression; however, searching for the nearest codeword in a codebook is time-consuming. In this work, we propose a hardware-based scheme by adopting bit-parallelism to prune unnecessary codewords. The new scheme uses a “Bit-mapped Look-up Table” to represent the positional information of the codewords. The lookup procedure can simply refer to the bitmaps to find the candidate codewords. Our simulation results further confirm the effectiveness of the proposed scheme.
Machine Learning Tutorial Part - 2 | Machine Learning Tutorial For Beginners ...Simplilearn
This presentation on Machine Learning will help you understand what is clustering, K-Means clustering, flowchart to understand K-Means clustering along with demo showing clustering of cars into brands, what is logistic regression, logistic regression curve, sigmoid function and a demo on how to classify a tumor as malignant or benign based on its features. Machine Learning algorithms can help computers play chess, perform surgeries, and get smarter and more personal. K-Means & logistic regression are two widely used Machine learning algorithms which we are going to discuss in this video. Logistic Regression is used to estimate discrete values (usually binary values like 0/1) from a set of independent variables. It helps to predict the probability of an event by fitting data to a logit function. It is also called logit regression. K-means clustering is an unsupervised learning algorithm. In this case, you don't have labeled data unlike in supervised learning. You have a set of data that you want to group into and you want to put them into clusters, which means objects that are similar in nature and similar in characteristics need to be put together. This is what k-means clustering is all about. Now, let us get started and understand K-Means clustering & logistic regression in detail.
Below topics are explained in this Machine Learning tutorial part -2 :
1. Clustering
- What is clustering?
- K-Means clustering
- Flowchart to understand K-Means clustering
- Demo - Clustering of cars based on brands
2. Logistic regression
- What is logistic regression?
- Logistic regression curve & Sigmoid function
- Demo - Classify a tumor as malignant or benign based on features
About Simplilearn Machine Learning course:
A form of artificial intelligence, Machine Learning is revolutionizing the world of computing as well as all people’s digital interactions. Machine Learning powers such innovative automated technologies as recommendation engines, facial recognition, fraud protection and even self-driving cars.This Machine Learning course prepares engineers, data scientists and other professionals with knowledge and hands-on skills required for certification and job competency in Machine Learning.
We recommend this Machine Learning training course for the following professionals in particular:
1. Developers aspiring to be a data scientist or Machine Learning engineer
2. Information architects who want to gain expertise in Machine Learning algorithms
3. Analytics professionals who want to work in Machine Learning or artificial intelligence
4. Graduates looking to build a career in data science and Machine Learning
Learn more at: https://www.simplilearn.com/
Similar to Practical Digital Image Processing 5 (20)
Solomonoff's theory of inductive inference is Ray Solomonoff's mathematical formalization of Occam's razor. It explains observations of the world by the smallest computer program that outputs those observations. Solomonoff proved that this explanation is the most likely one, by assuming the world is generated by an unknown computer program. That is to say the probability distribution of all computer programs that output the observations favors the shortest one.
Prediction is done using a completely Bayesian framework. The universal prior is calculated for all computable sequences—this is the universal a priori probability distribution; no computable hypothesis will have a zero probability. This means that Bayes rule of causation can be used in predicting the continuation of any particular computable sequence.
This is an introductory workshop for machine learning. Introduced machine learning tasks such as supervised learning, unsupervised learning and reinforcement learning.
a short introduction about deep learning and how we can use deep neural networks in different biological problems such as protein function prediction and gene expression inference.
Object extraction from satellite imagery using deep learningAly Abdelkareem
Presentation for extract objects from satellite imagery using deep learning techniques. you find a comparison between state-of-art approaches in computer vision.
This is a basic crash course for android development covers:
Android Studio,Hello World Application,Application Components,Application Resources,User Interface,Good UI,Play Store
The French Revolution, which began in 1789, was a period of radical social and political upheaval in France. It marked the decline of absolute monarchies, the rise of secular and democratic republics, and the eventual rise of Napoleon Bonaparte. This revolutionary period is crucial in understanding the transition from feudalism to modernity in Europe.
For more information, visit-www.vavaclasses.com
Welcome to TechSoup New Member Orientation and Q&A (May 2024).pdfTechSoup
In this webinar you will learn how your organization can access TechSoup's wide variety of product discount and donation programs. From hardware to software, we'll give you a tour of the tools available to help your nonprofit with productivity, collaboration, financial management, donor tracking, security, and more.
Students, digital devices and success - Andreas Schleicher - 27 May 2024..pptxEduSkills OECD
Andreas Schleicher presents at the OECD webinar ‘Digital devices in schools: detrimental distraction or secret to success?’ on 27 May 2024. The presentation was based on findings from PISA 2022 results and the webinar helped launch the PISA in Focus ‘Managing screen time: How to protect and equip students against distraction’ https://www.oecd-ilibrary.org/education/managing-screen-time_7c225af4-en and the OECD Education Policy Perspective ‘Students, digital devices and success’ can be found here - https://oe.cd/il/5yV
The Art Pastor's Guide to Sabbath | Steve ThomasonSteve Thomason
What is the purpose of the Sabbath Law in the Torah. It is interesting to compare how the context of the law shifts from Exodus to Deuteronomy. Who gets to rest, and why?
Synthetic Fiber Construction in lab .pptxPavel ( NSTU)
Synthetic fiber production is a fascinating and complex field that blends chemistry, engineering, and environmental science. By understanding these aspects, students can gain a comprehensive view of synthetic fiber production, its impact on society and the environment, and the potential for future innovations. Synthetic fibers play a crucial role in modern society, impacting various aspects of daily life, industry, and the environment. ynthetic fibers are integral to modern life, offering a range of benefits from cost-effectiveness and versatility to innovative applications and performance characteristics. While they pose environmental challenges, ongoing research and development aim to create more sustainable and eco-friendly alternatives. Understanding the importance of synthetic fibers helps in appreciating their role in the economy, industry, and daily life, while also emphasizing the need for sustainable practices and innovation.
The Indian economy is classified into different sectors to simplify the analysis and understanding of economic activities. For Class 10, it's essential to grasp the sectors of the Indian economy, understand their characteristics, and recognize their importance. This guide will provide detailed notes on the Sectors of the Indian Economy Class 10, using specific long-tail keywords to enhance comprehension.
For more information, visit-www.vavaclasses.com
2024.06.01 Introducing a competency framework for languag learning materials ...Sandy Millin
http://sandymillin.wordpress.com/iateflwebinar2024
Published classroom materials form the basis of syllabuses, drive teacher professional development, and have a potentially huge influence on learners, teachers and education systems. All teachers also create their own materials, whether a few sentences on a blackboard, a highly-structured fully-realised online course, or anything in between. Despite this, the knowledge and skills needed to create effective language learning materials are rarely part of teacher training, and are mostly learnt by trial and error.
Knowledge and skills frameworks, generally called competency frameworks, for ELT teachers, trainers and managers have existed for a few years now. However, until I created one for my MA dissertation, there wasn’t one drawing together what we need to know and do to be able to effectively produce language learning materials.
This webinar will introduce you to my framework, highlighting the key competencies I identified from my research. It will also show how anybody involved in language teaching (any language, not just English!), teacher training, managing schools or developing language learning materials can benefit from using the framework.
6. Depth Map from Stereo Images
https://www.youtube.com/watch?v=O7B2vCsTpC0
7. Stereo Vision Idea
The diagram contains equivalent triangles. Writing their
equivalent equations will yield us following result:
x and x′ are the distance between points in image plane corresponding
to the scene point 3D and their camera center. B is the distance
between two cameras (which we know) and f is the focal length of
camera (already known).
above equation says that the depth of a point in a scene is
inversely proportional to the difference in distance of
corresponding image points and their camera centers. So
with this information, we can derive the depth of all pixels
in an image.
10. Optical Flow
Optical flow is the pattern of apparent motion of
image objects between two consecutive frames
caused by the movement of object or camera. It is
2D vector field where each vector is a displacement
vector showing the movement of points from first
frame to second.
Optical flow works on several assumptions:
1. The pixel intensities of an object do not change
between consecutive frames.
2. Neighbouring pixels have similar motion.
11. Consider a pixel I(x,y,t) in first frame It moves by distance (dx,dy) in next frame taken after
dt time. So since those pixels are the same and intensity does not change, we can say,
I(x,y,t)=I(x+dx,y+dy,t+dt)
Then take taylor series approximation:
fx u+fy v+ft=0
where:
fx=∂f/∂x ; fy=∂f/∂y
u=dx/dt ; v=dy/dt
Above equation is called Optical Flow equation. In it, we can find fx and fy, they are image
gradients. Similarly ft is the gradient along time.
But we cannot get u and v from one equation?!
Optical Flow Equations
12. Lucas-Kanade Method
Lucas-Kanade method takes a 3x3 patch around the point. So all the 9 points
have the same motion. We can find (fx,fy,ft) for these 9 points.
So now our problem becomes solving 9 equations with two unknown variables
which is over-determined.
using least square fit method.
22. Understanding K-Nearest Neighbour
kNN is one of the simplest of classification algorithms available for supervised
learning. The idea is to search for closest match of the test data in feature space.
26. Linearly Separable Data
Considering the data given in image, or consider that
We find a line, which divides both
the data to two regions. When we get a new test_data
X just substitute it in f(x).if f(x) > 0 it belongs to blue
group, else it belongs to red group. We can call this
line as Decision Boundary. It is very simple and
memory-efficient. Such data which can be divided
into two with a straight line (or hyperplanes in
higher dimensions) is called Linear Separable.
27. Linearly Separable Data
So to find this Decision Boundary, you need training
data. Do you need all? NO. Just the ones which are
close to the opposite group are sufficient. In our
image, they are the one blue filled circle and two red
filled squares. We can call them Support Vectors and
the lines passing through them are called Support
Planes. They are adequate for finding our decision
boundary. We need not worry about all the data. It
helps in data reduction.
30. Consider a company, which is going to release a new model of T-shirt to market.
Obviously they will have to manufacture models in different sizes to satisfy
people of all sizes. So the company make a data of people’s height and weight,
and plot them on to a graph, as below:
31. Company can’t create t-shirts with all the sizes. Instead, they divide people to
Small, Medium and Large, and manufacture only these 3 models which will fit
into all the people. This grouping of people into three groups can be done by
k-means clustering, and algorithm provides us best 3 sizes, which will satisfy all
the people. And if it doesn’t, company can divide people to more groups, may be
five, and so on. Check image below :
32. How does it work?
Consider a set of data as below ( You can consider it as t-shirt problem). We need
to cluster this data into two groups.
33. Step : 1 - Algorithm randomly chooses two
centroids, C1, C2 (sometimes, any two data are
taken as the centroids).
Step : 2 - It calculates the distance from each
point to both centroids. If a test data is more
closer to C1 then that data is labelled with ‘0’. If it
is closer to C2.then labelled as ‘1’ (If more
centroids are there, labelled as ‘2’,‘3’ etc). In our
case, we will color all ‘0’ labelled with red, and ‘1’
labelled with blue. So we get following image after
above operations
34. Step : 3 - Next we calculate the average of all blue
points and red points separately and that will be
our new centroids. That is C1 and C2 shift to
newly calculated centroids. (Remember, the
images shown are not true values and not to true
scale, it is just for demonstration only). And again,
perform step 2 with new centroids and label data
to ‘0’ and ‘1’.
35. Now Step - 2 and Step - 3 are iterated until both
centroids are converged to fixed points. (Or it may
be stopped depending on the criteria we provide, like
maximum number of iterations, or a specific
accuracy is reached etc.) These points are such
that sum of distances between test data and their
corresponding centroids are minimum. Or
simply, sum of distances between
41. Project
● Deadline: 30th April.
● Submission Form: https://goo.gl/forms/hdmELnD8qmOxVVVh2
a. Demo video on Facebook or Youtube
b. Project source code on github
43. The last assignment ever ( So far )
1. Update your C.V. , Linkedin and Wuzzuf with your projects and assignments
2. Make a list of companies you want to work for and rank them based on your
interest
3. Start to send emails with your C.V. to their HR and their employees (SPAM
their Inbox)
4. Don’t worry “رزق ”اﻟﻌﻤﻞ
44. AI driven companies in Egypt
(60 Companies)
https://my-interviews-experience-in-egypt.quora.com/AI-Driven-Companies-in-Egypt