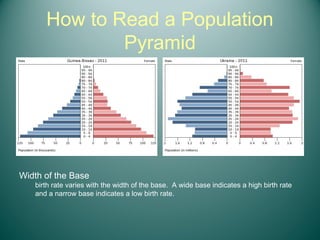
2. Expansive population pyramids show larger numbers or
percentages of the population in the younger age groups,
usually with each age group larger in size or proportion than
the one born before it.
Population growth is rapid.
4. Stationary or near-stationary population pyramids display
somewhat equal numbers or percentages for almost all age
groups. Of course, smaller figures are still to be expected at
the oldest age groups.
Population growth is neutral or stable.
5. How to Read a Population
Pyramid
Width of the Base
birth rate varies with the width of the base. A wide base indicates a high birth rate
and a narrow base indicates a low birth rate.
6. How to Read a Population
Pyramid
• Symmetry
– statistically speaking pyramids
should be relatively symmetrical
– any asymmetry indicates a
difference in the male and female
population
– this pyramid shows more females
at age ranges above 50 which
indicates that women are living to
older ages than males
7. How to Read a Population
Pyramid
• Shape of Sides
– Concave sides indicate a high
death rate and convex sides
indicate a low death rate
– this population pyramid exhibits
concave sides indicating a high
death rate
8. How to Read a Population
Pyramid
• Bumps in the sides
– irregularities in the sides indicate
a demographic anomaly
– the 30 -50 age group in the
population pyramid at the right
represents the baby boom
– this bump will travel upward as the
baby boomers age
• Bumps in the sides
– irregularities in the sides indicate
a demographic anomaly
– the large numbers of working
aged men in the pyramid to the
left indicates a migrant workforce