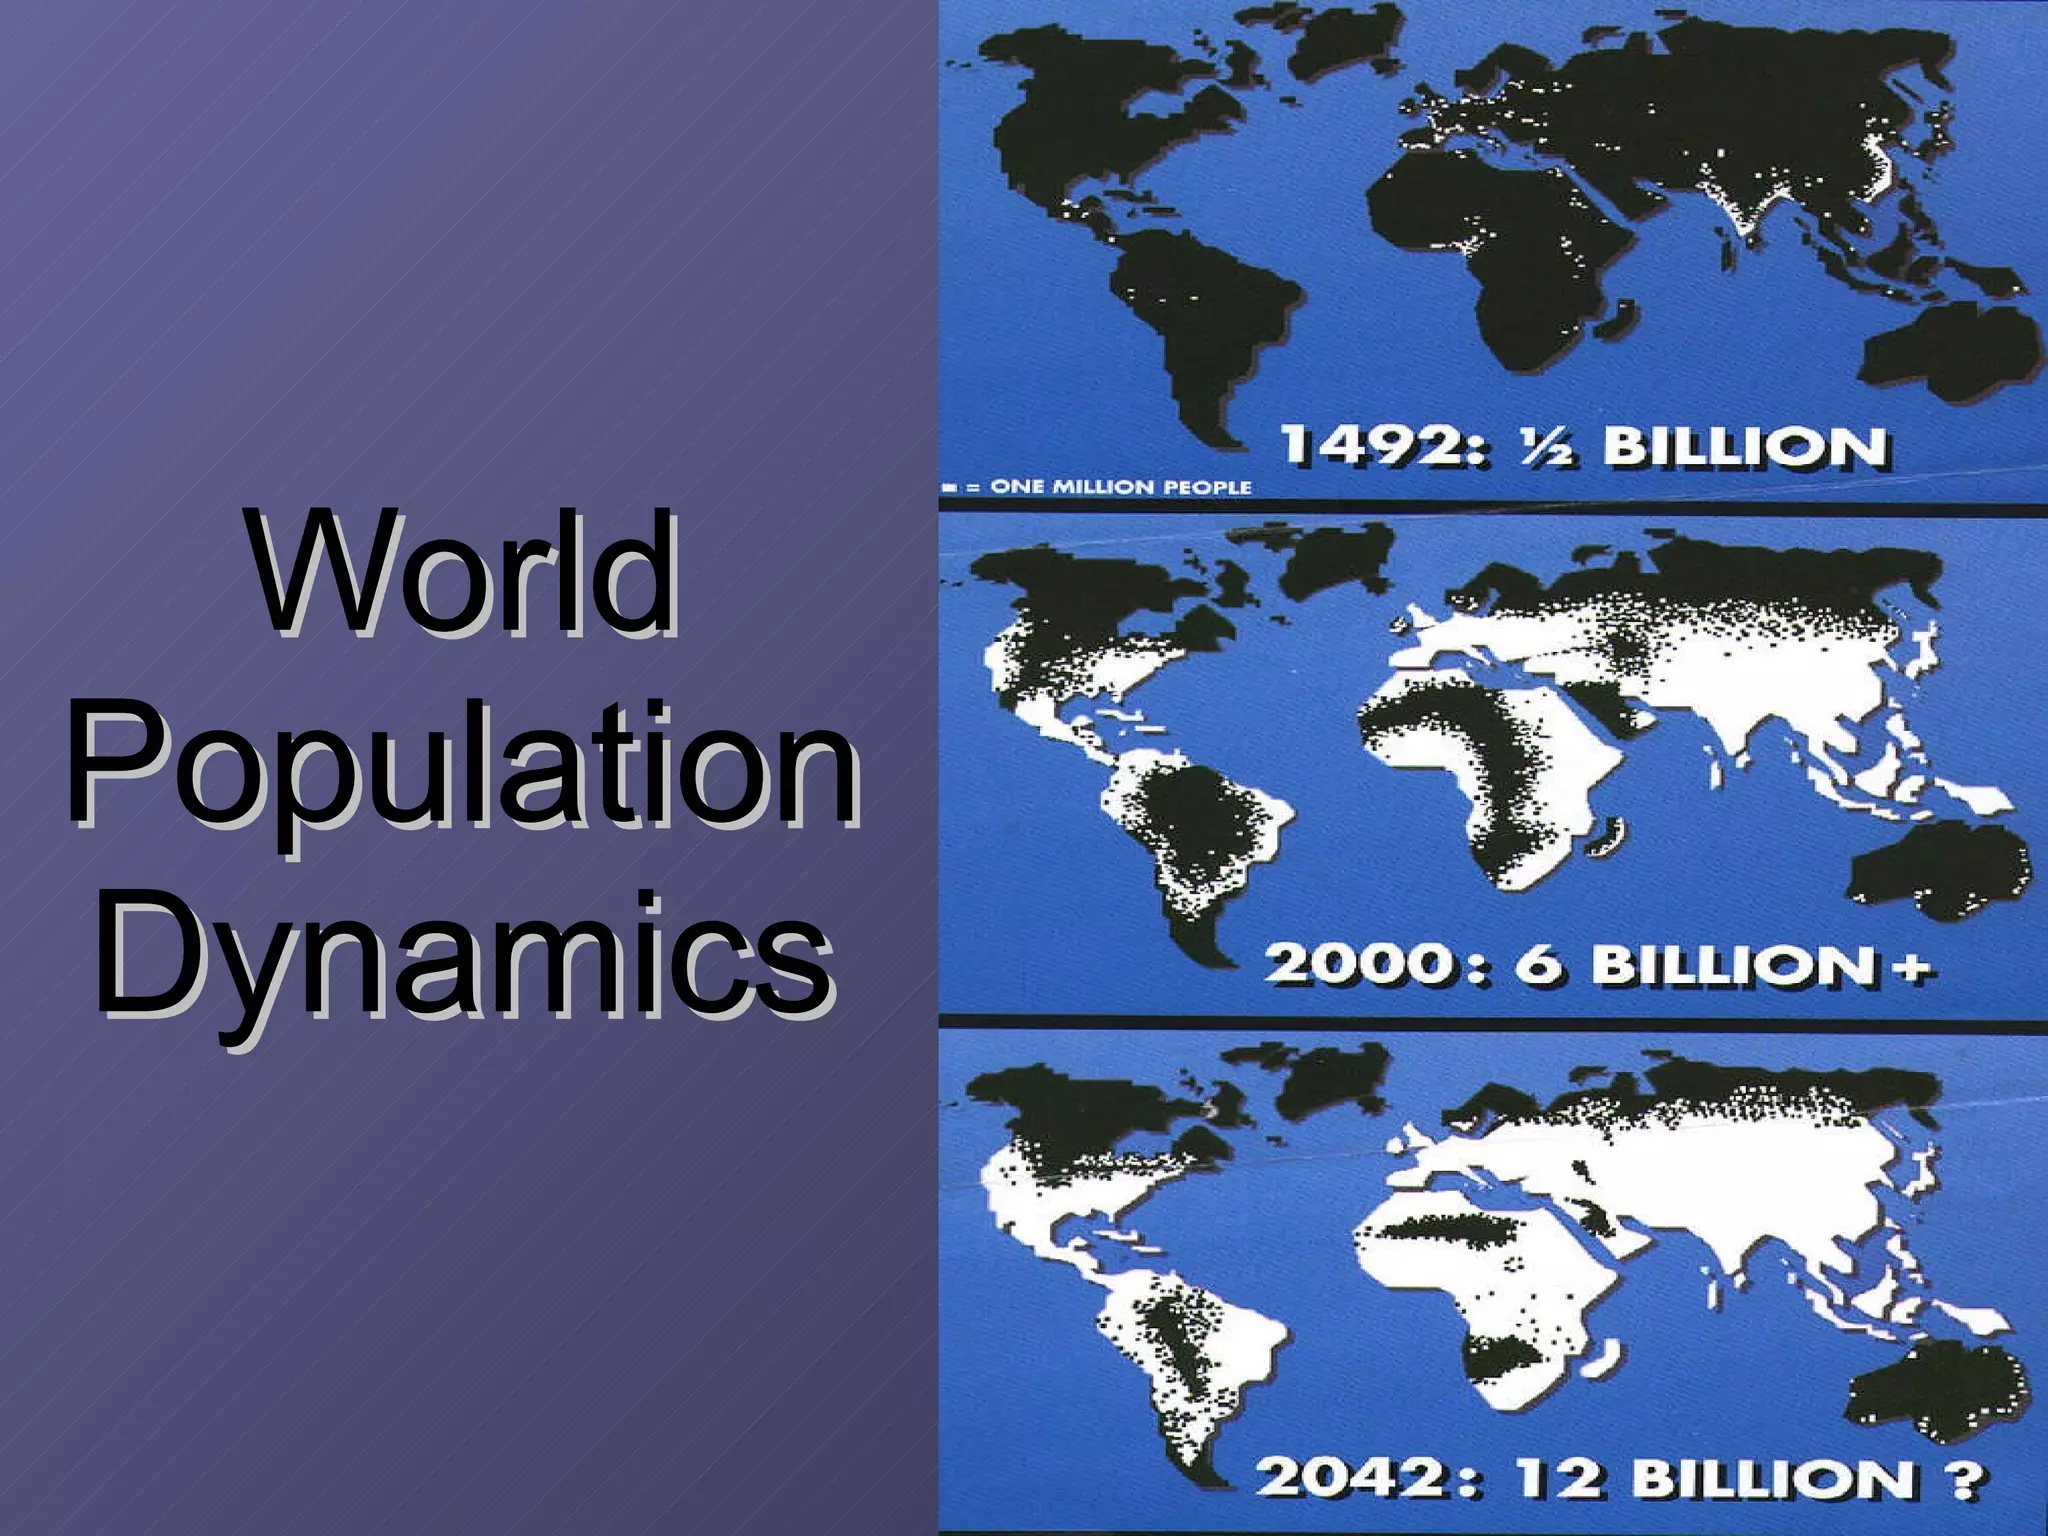
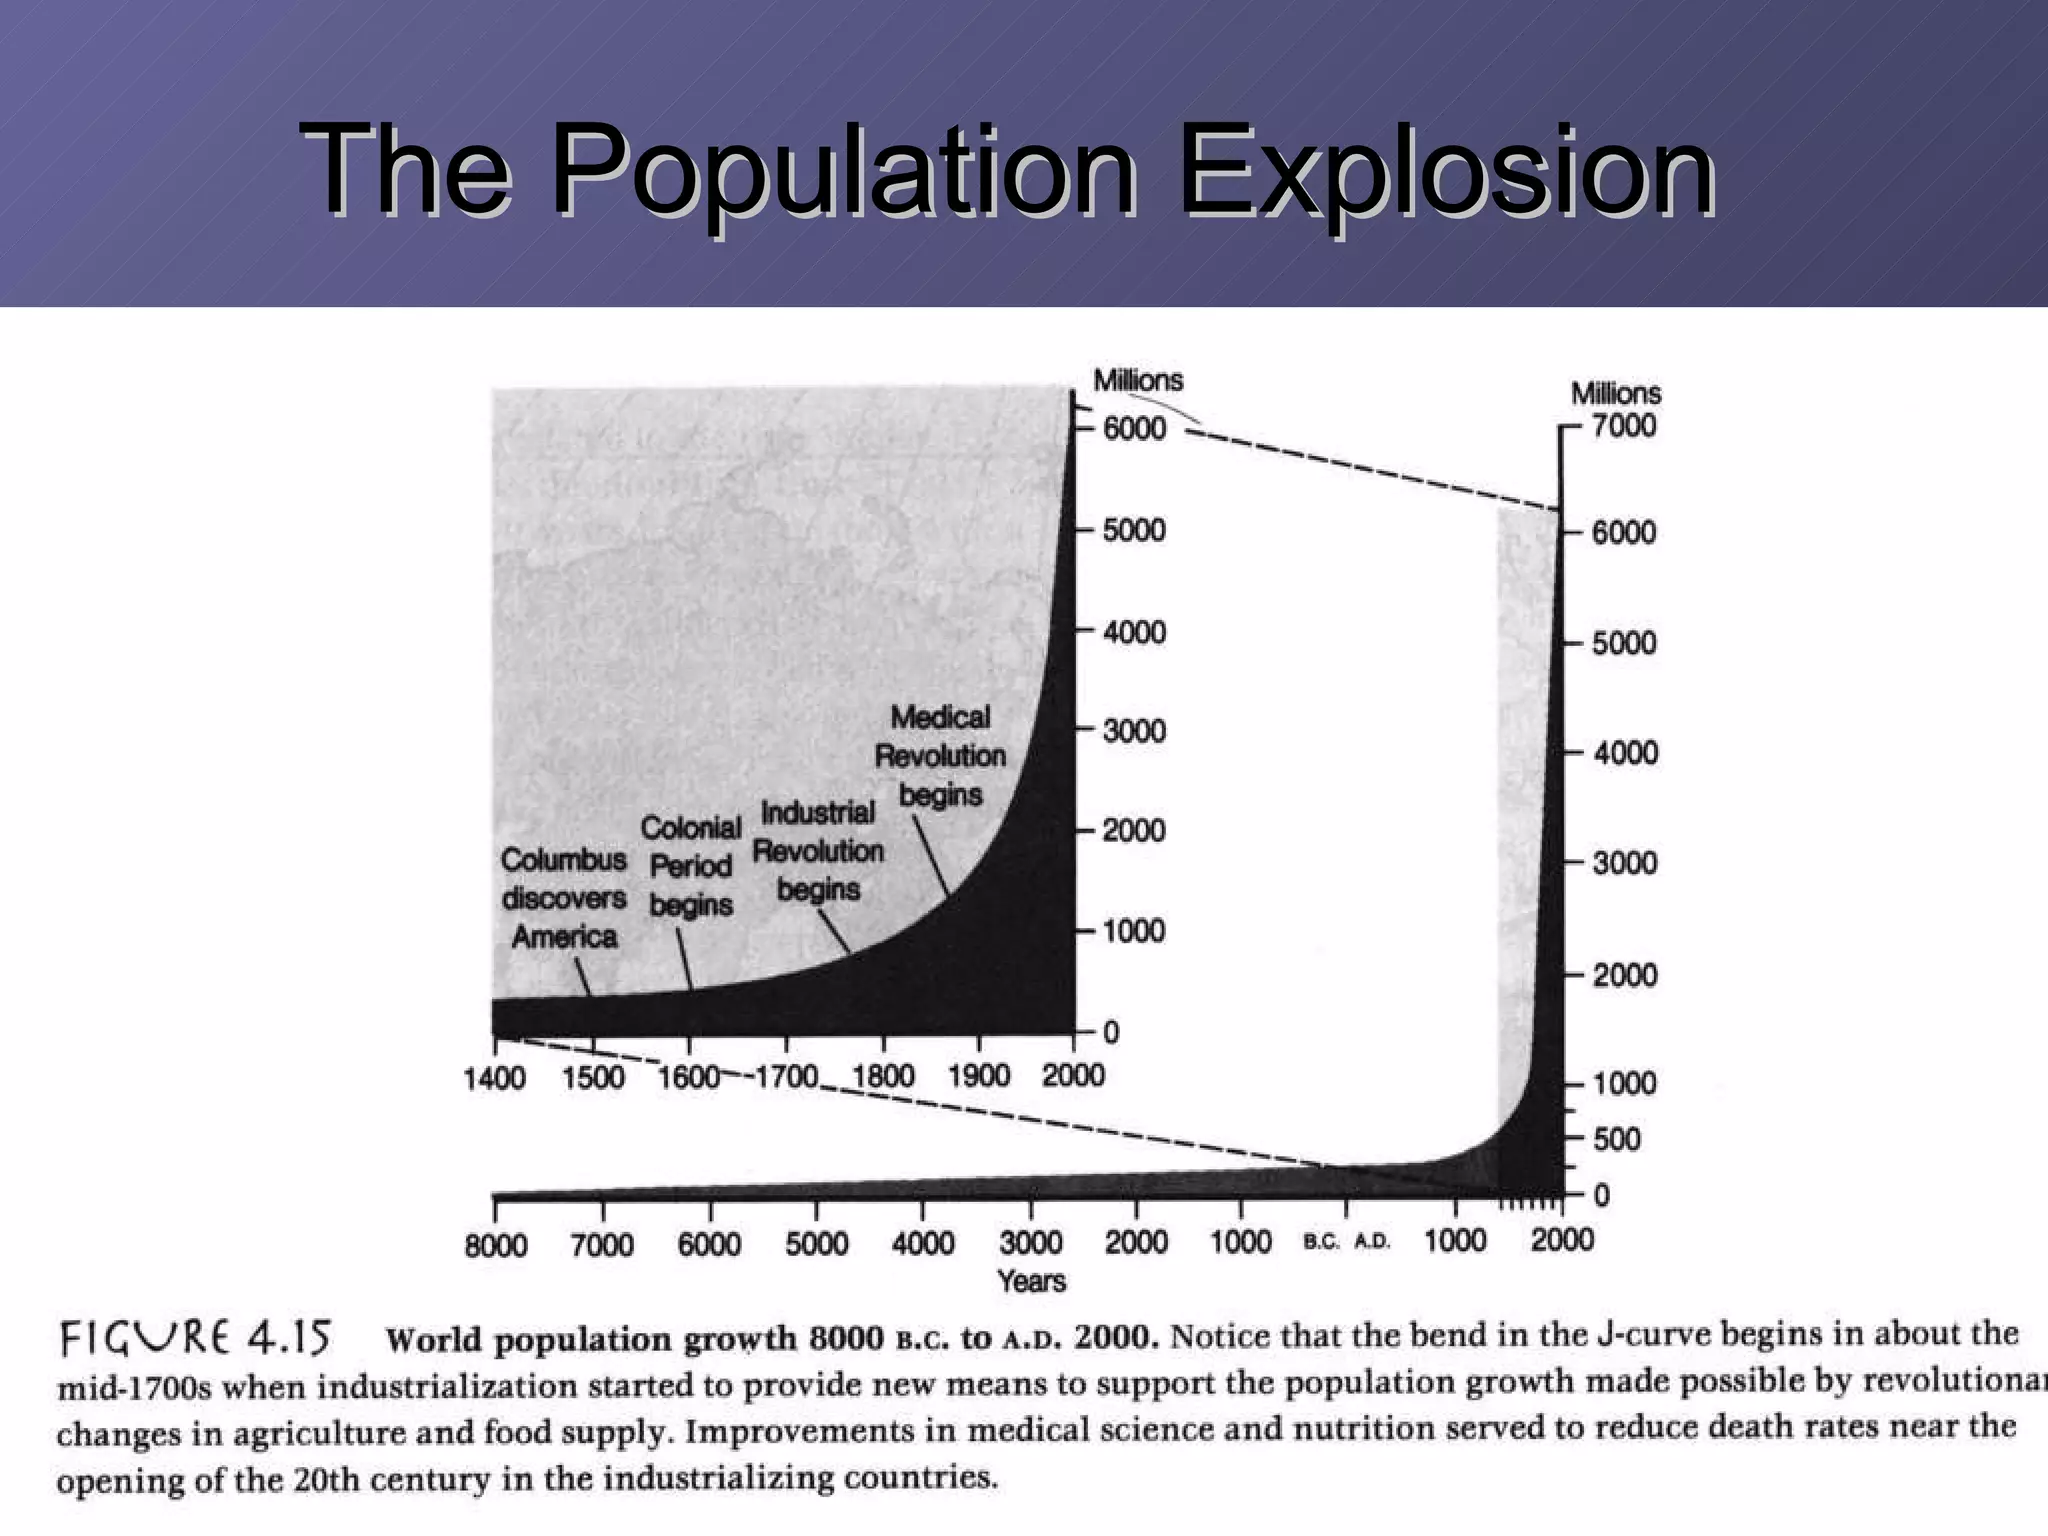
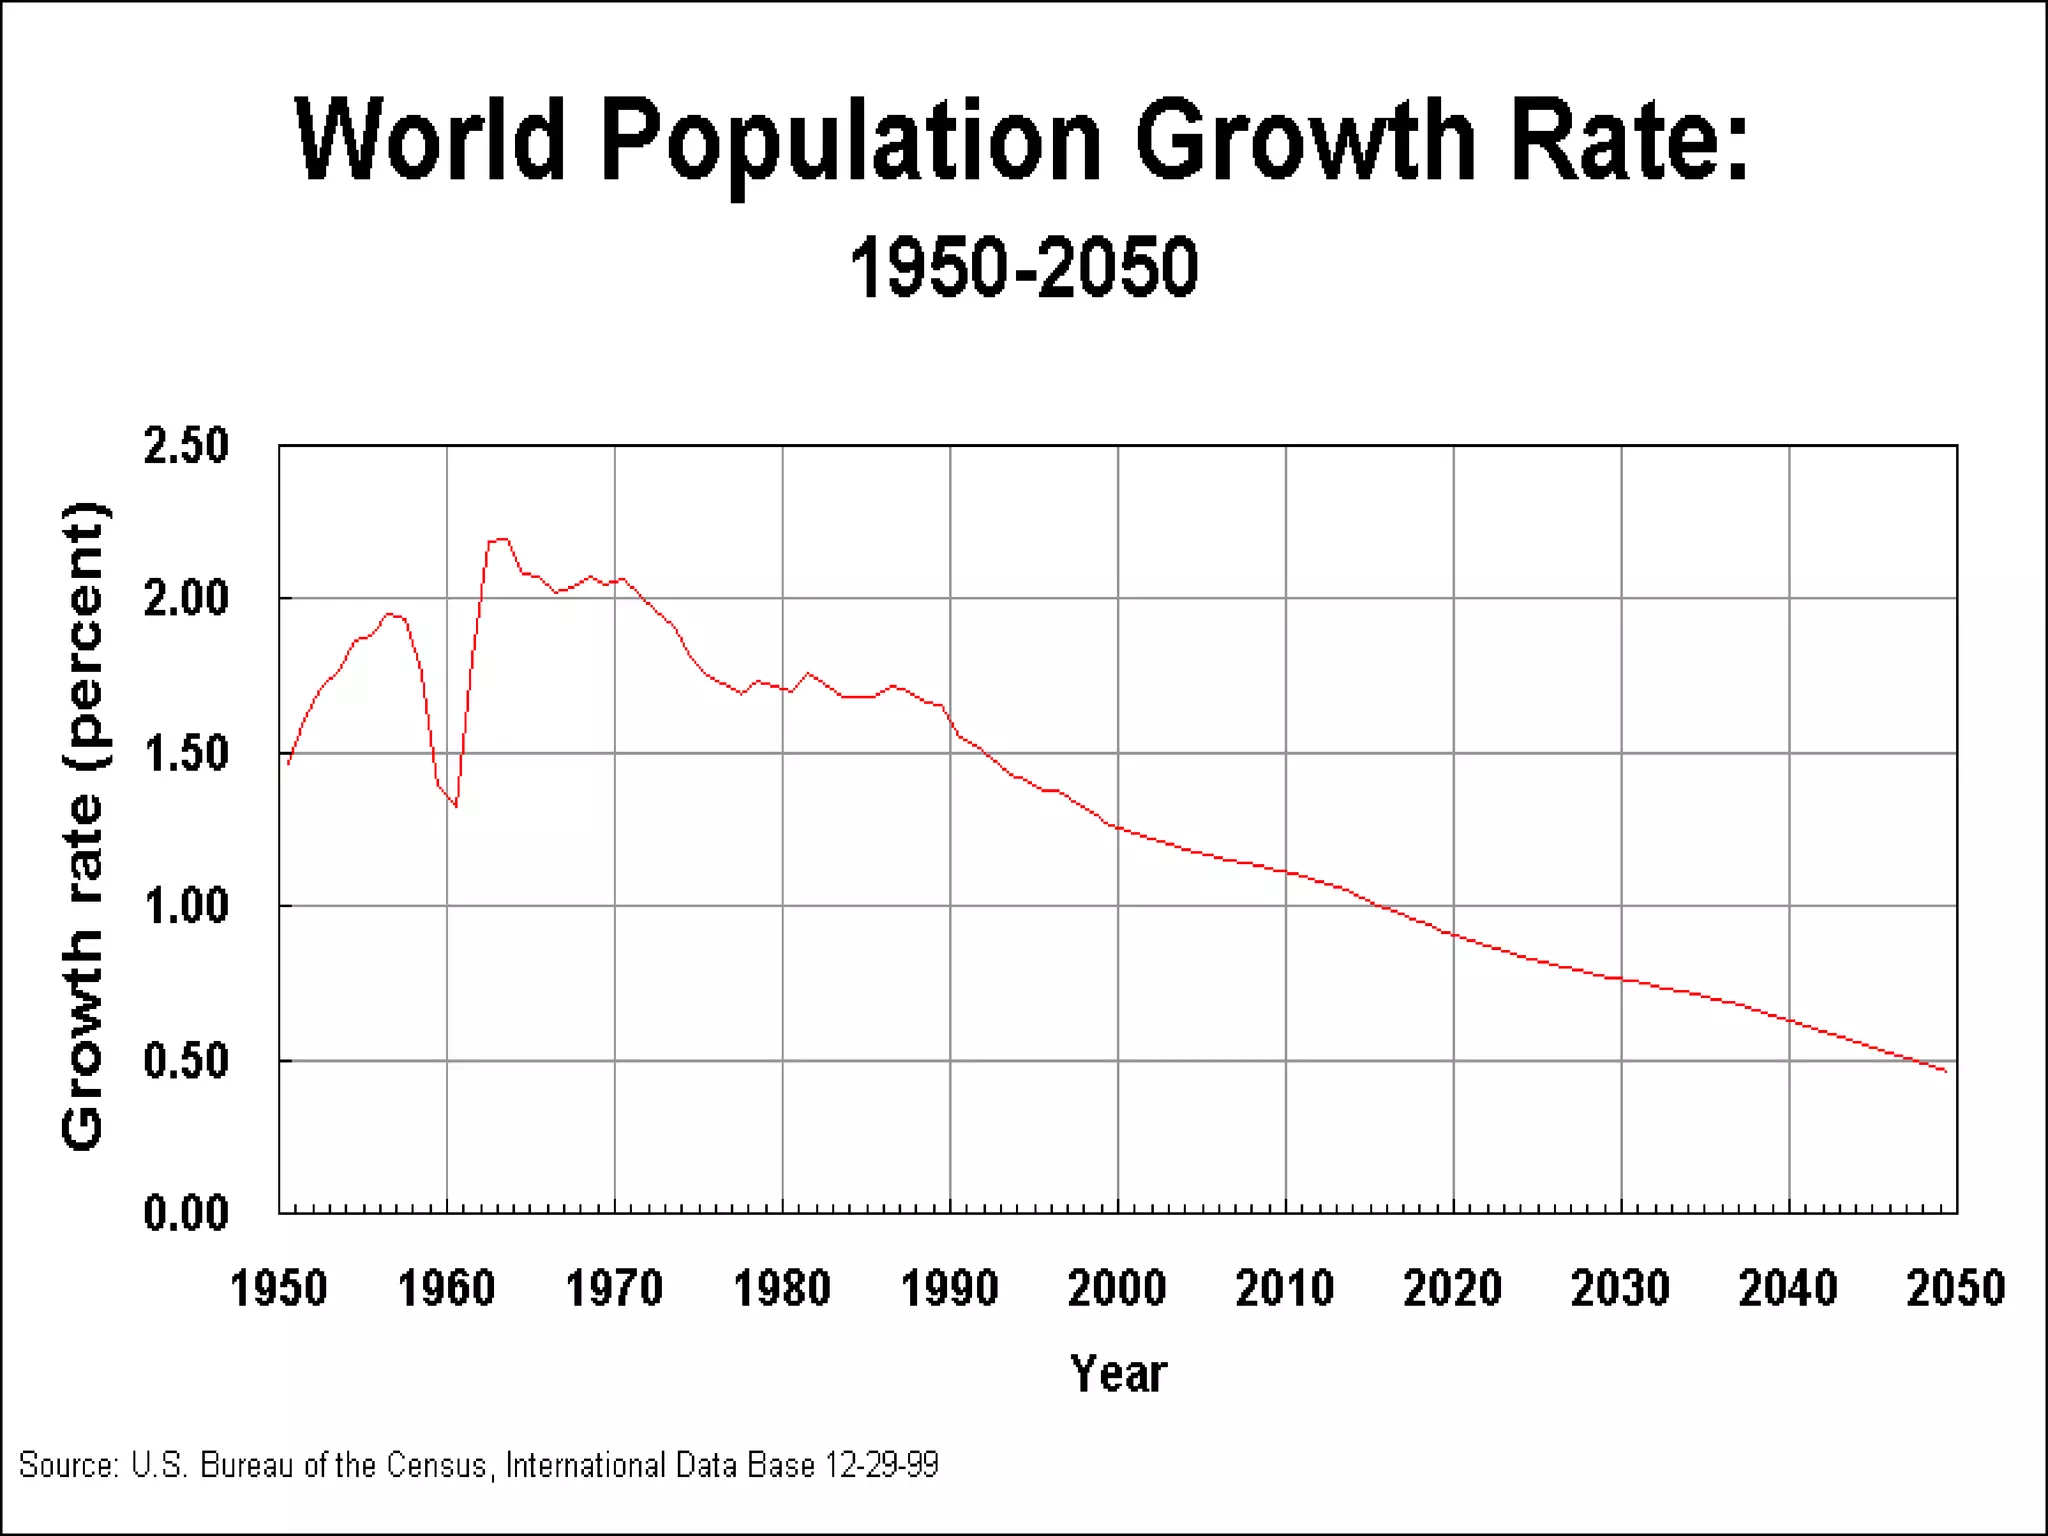
World population dynamics can be understood by examining population distribution and growth rates over time. Population distribution is influenced by environmental factors and level of development. Places with large populations usually have favorable environments and are more developed, while places with few people often have hostile environments. Population growth is the result of birth rates, death rates, and migration. In the last 200 years, global population has experienced an unprecedented expansion due to improvements in medicine, sanitation and technology that reduced death rates even as birth rates remained high.
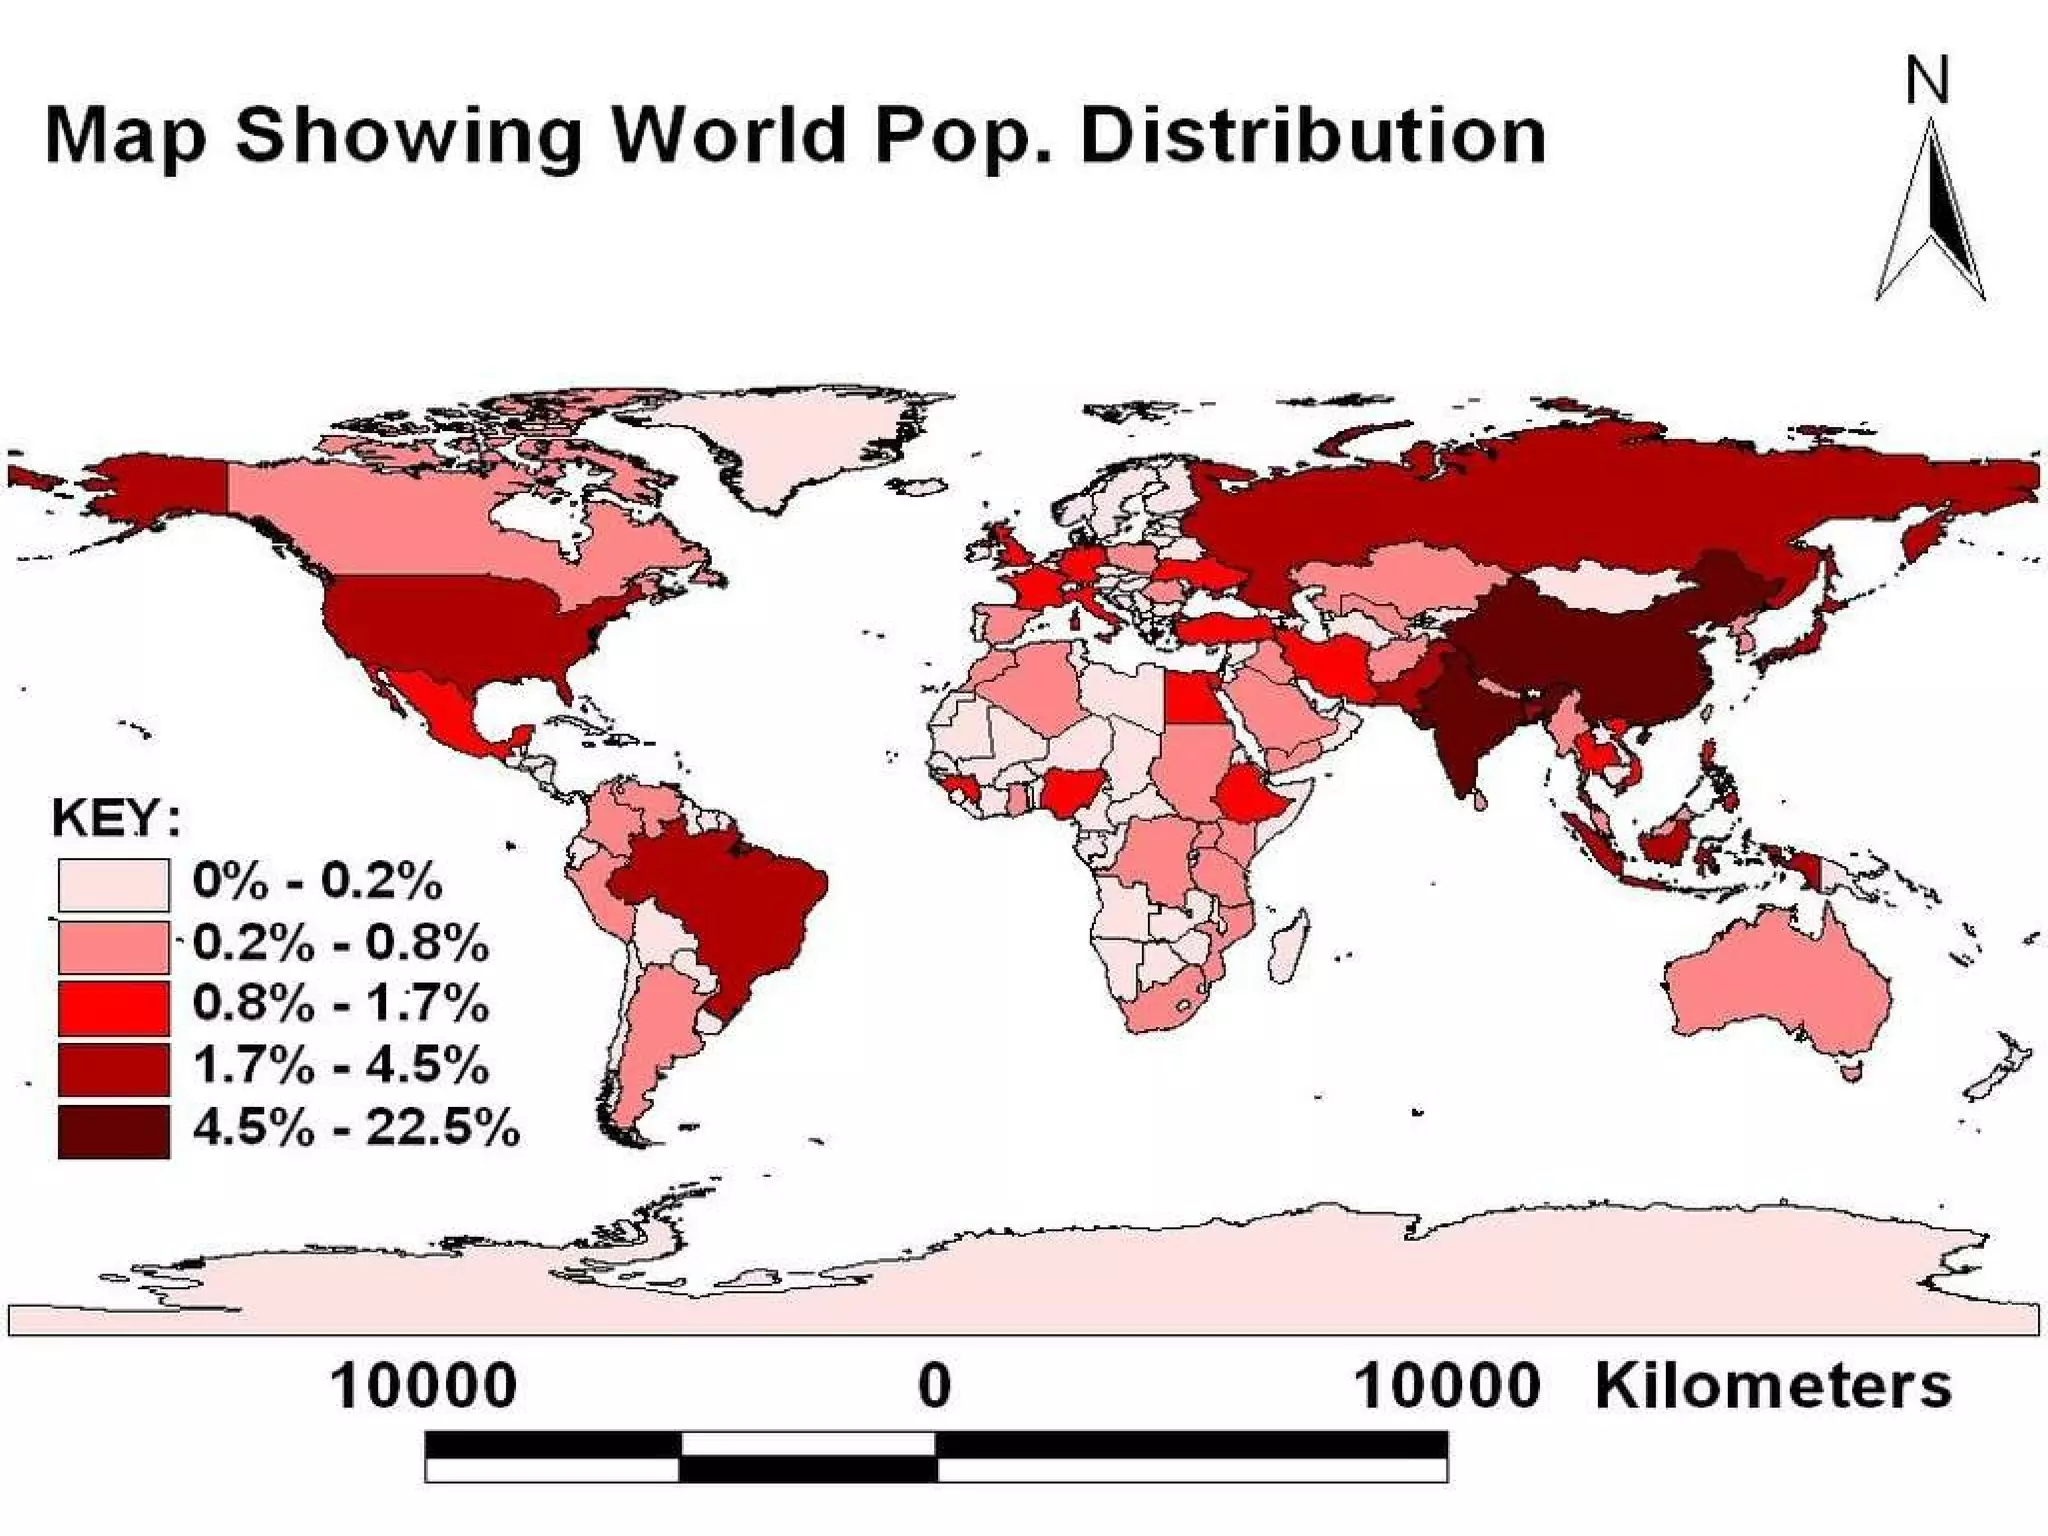
Population Distribution Population distribution is where people live, this can be on a global, regional or local scale. Places with lots of people usually have habitable environments they either: wealthy and industrial e.g. Europe, Japan etc. poor with rapidly growing populations e.g. India, Ethiopia Places with few people are usually hostile environments, e.g. Antarctica, Sahara Deserts, Alaska etc.
3.
4.
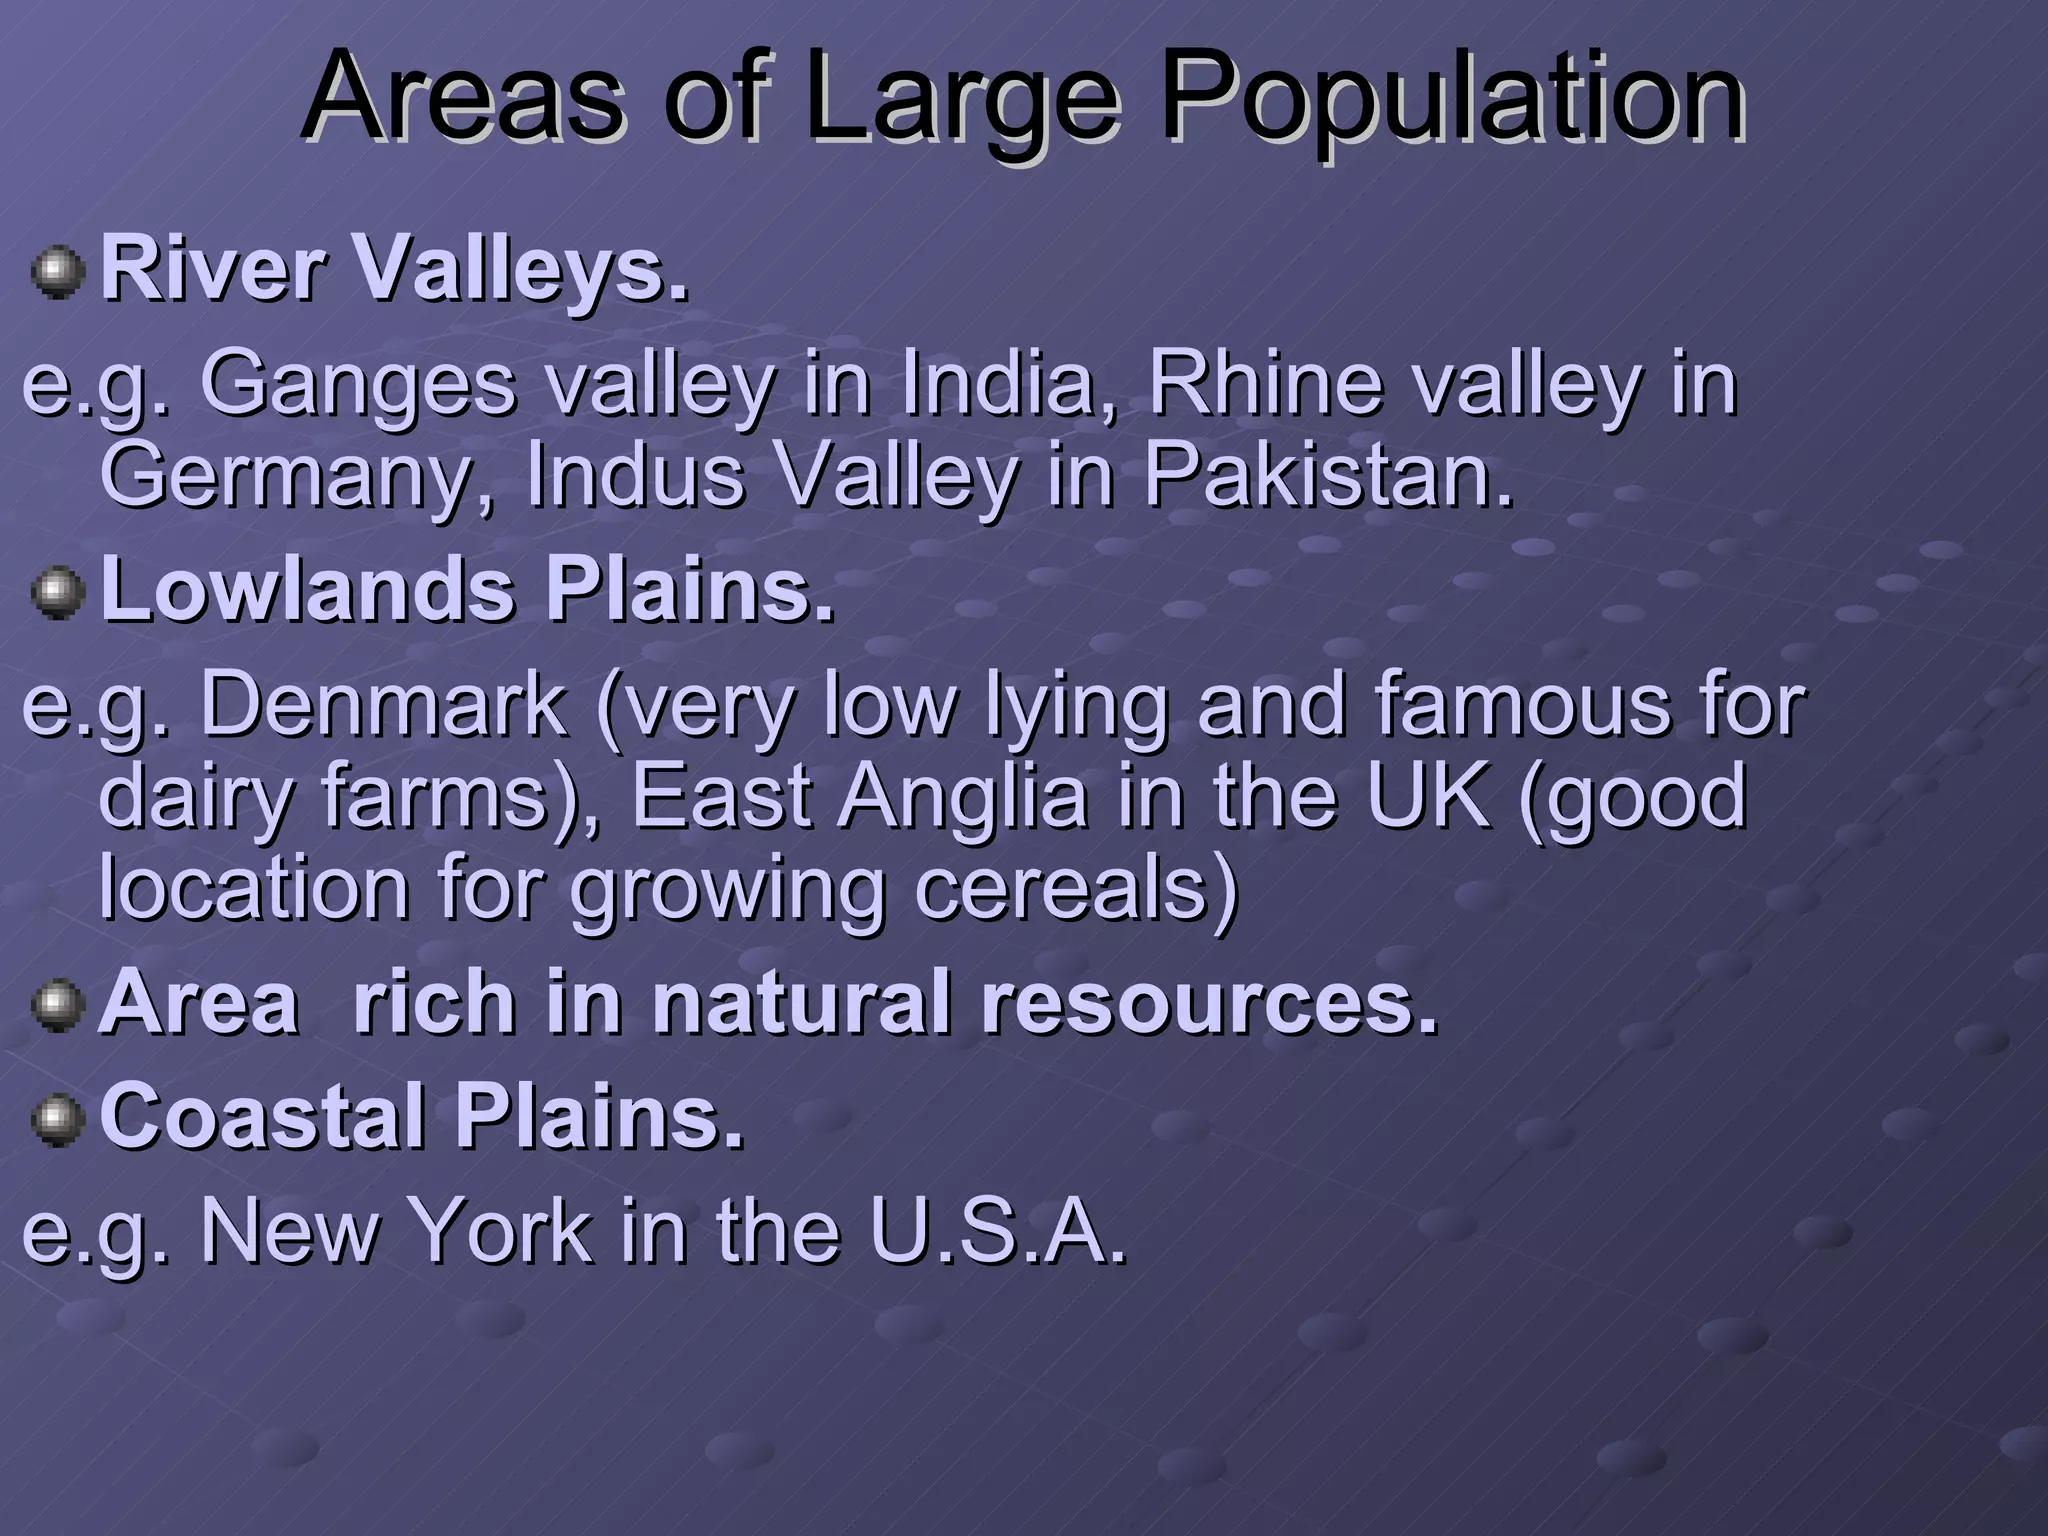
Areas of LargePopulation River Valleys. e.g. Ganges valley in India, Rhine valley in Germany, Indus Valley in Pakistan. Lowlands Plains. e.g. Denmark (very low lying and famous for dairy farms), East Anglia in the UK (good location for growing cereals) Area rich in natural resources. Coastal Plains. e.g. New York in the U.S.A.
Population Explosion arecent event Last 200 years or less for MDCs Industrial Revolution Improvement in sanitation and medicine Last 50 years or less for LDCs Transfer of technology, i.e. medical, agricultural (Green Revolution)
7.
Components Influencing Pop.Growth The Pop. of a country changes because of the relationship between: the birth rate — number of live births per 1000 of the population per year. the death rate — number of deaths per 1000 of the population per year. migration — number of people moving into or out of a country.
8.
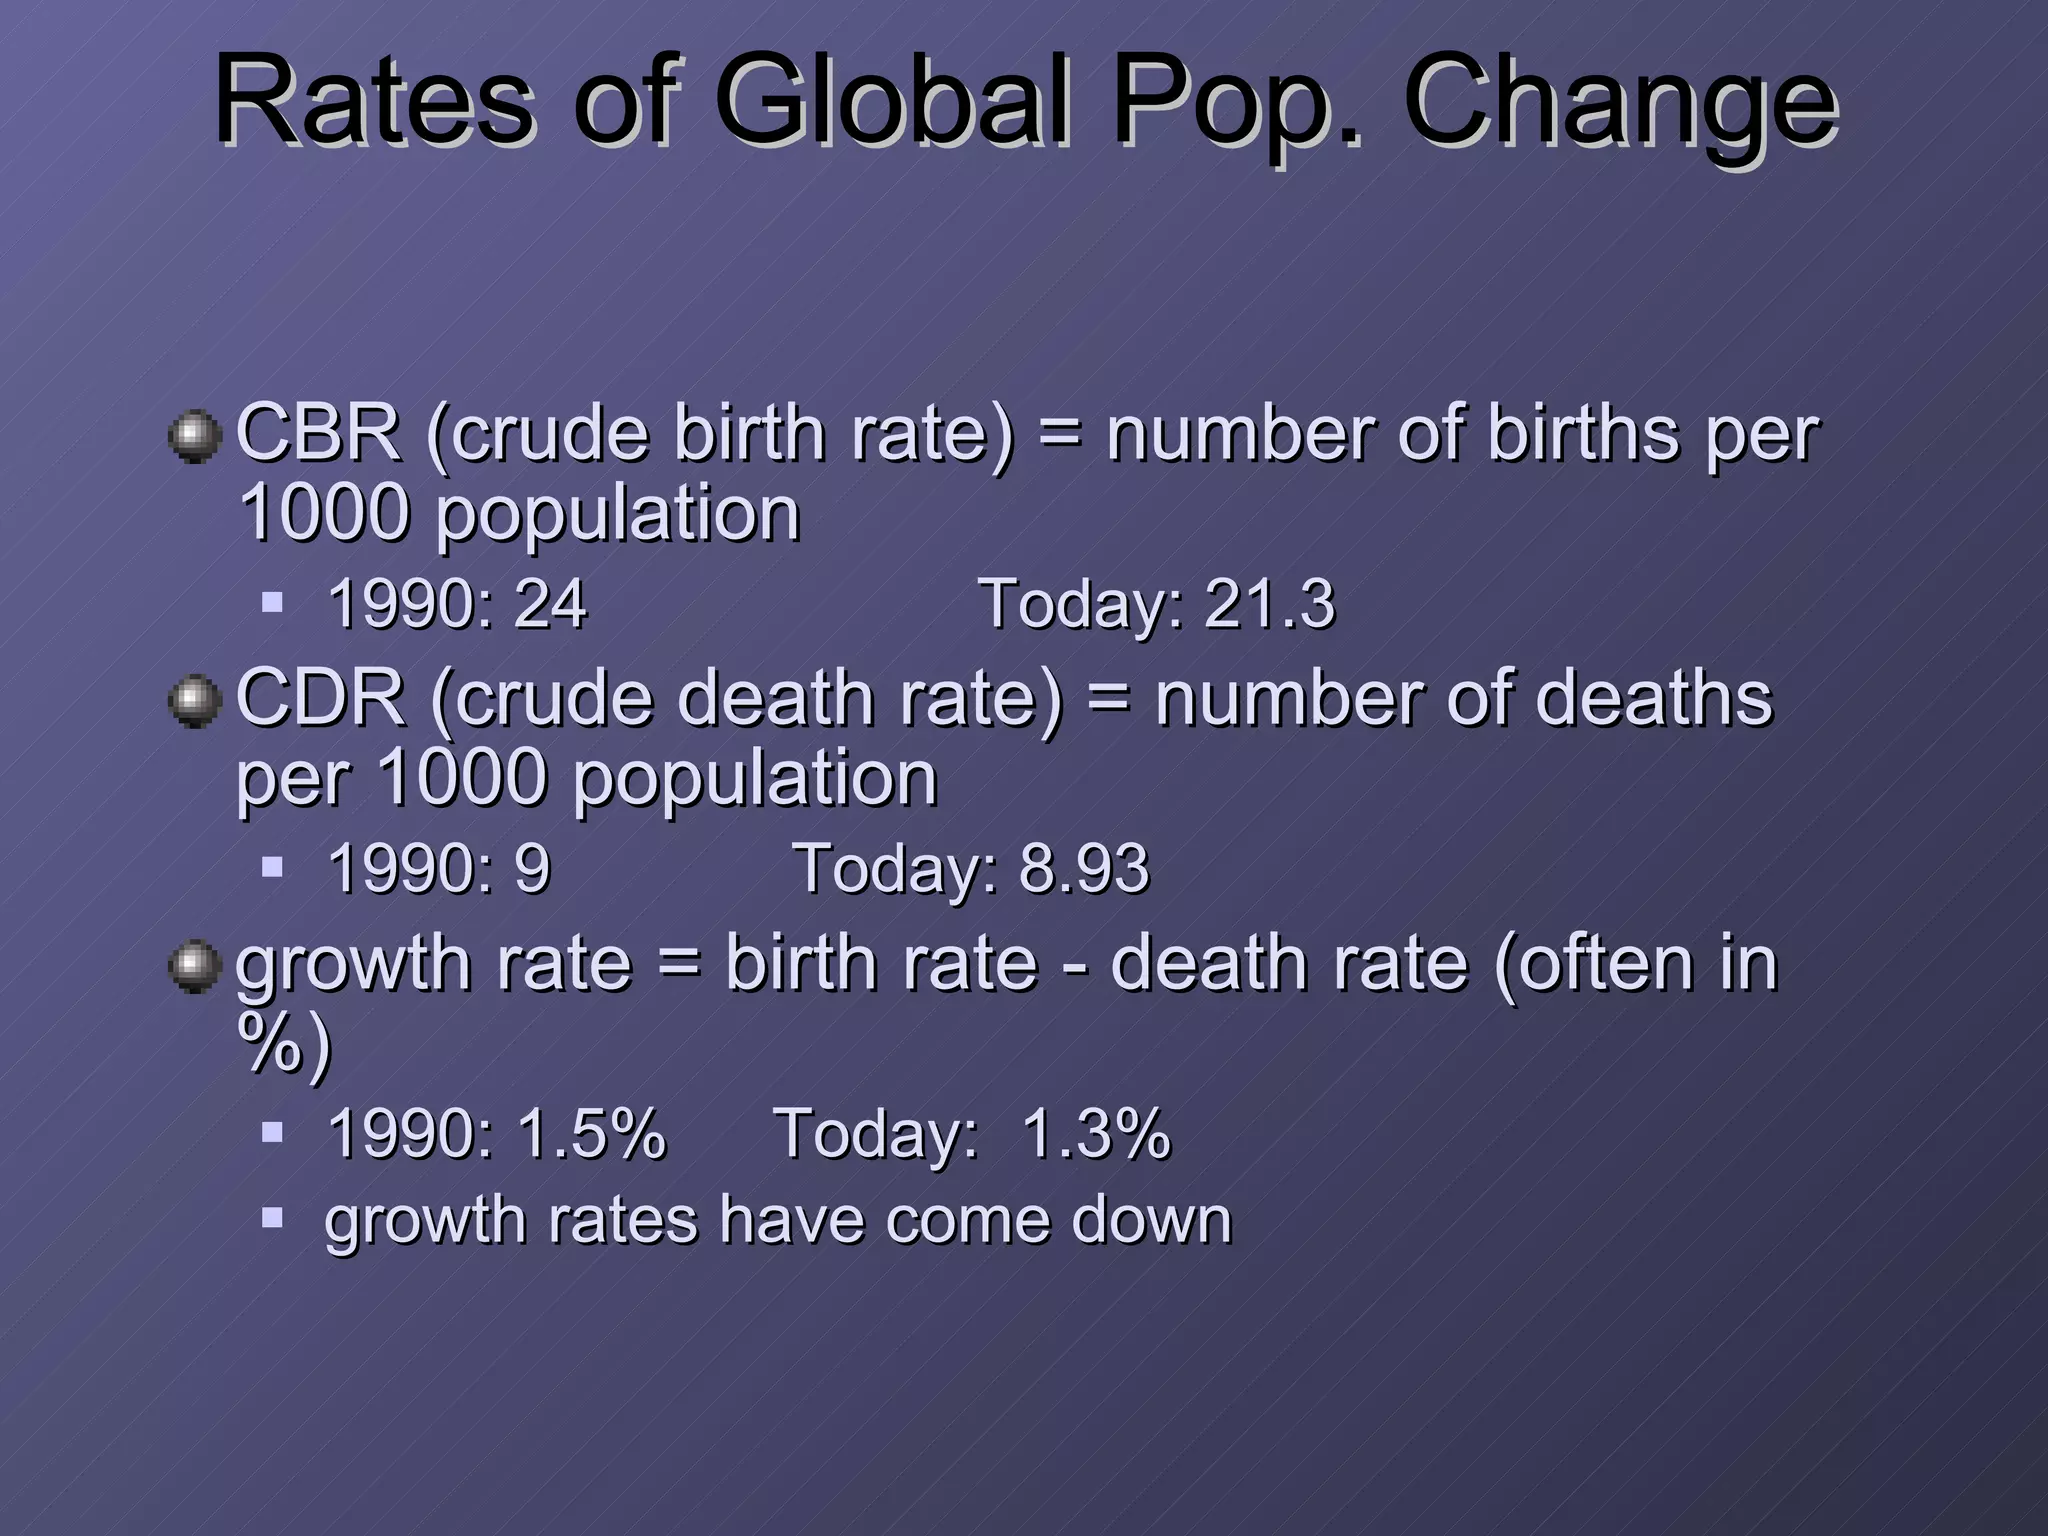
Rates of GlobalPop. Change CBR (crude birth rate) = number of births per 1000 population 1990: 24 Today: 21.3 CDR (crude death rate) = number of deaths per 1000 population 1990: 9 Today: 8.93 growth rate = birth rate - death rate (often in %) 1990: 1.5% Today: 1.3% growth rates have come down
9.
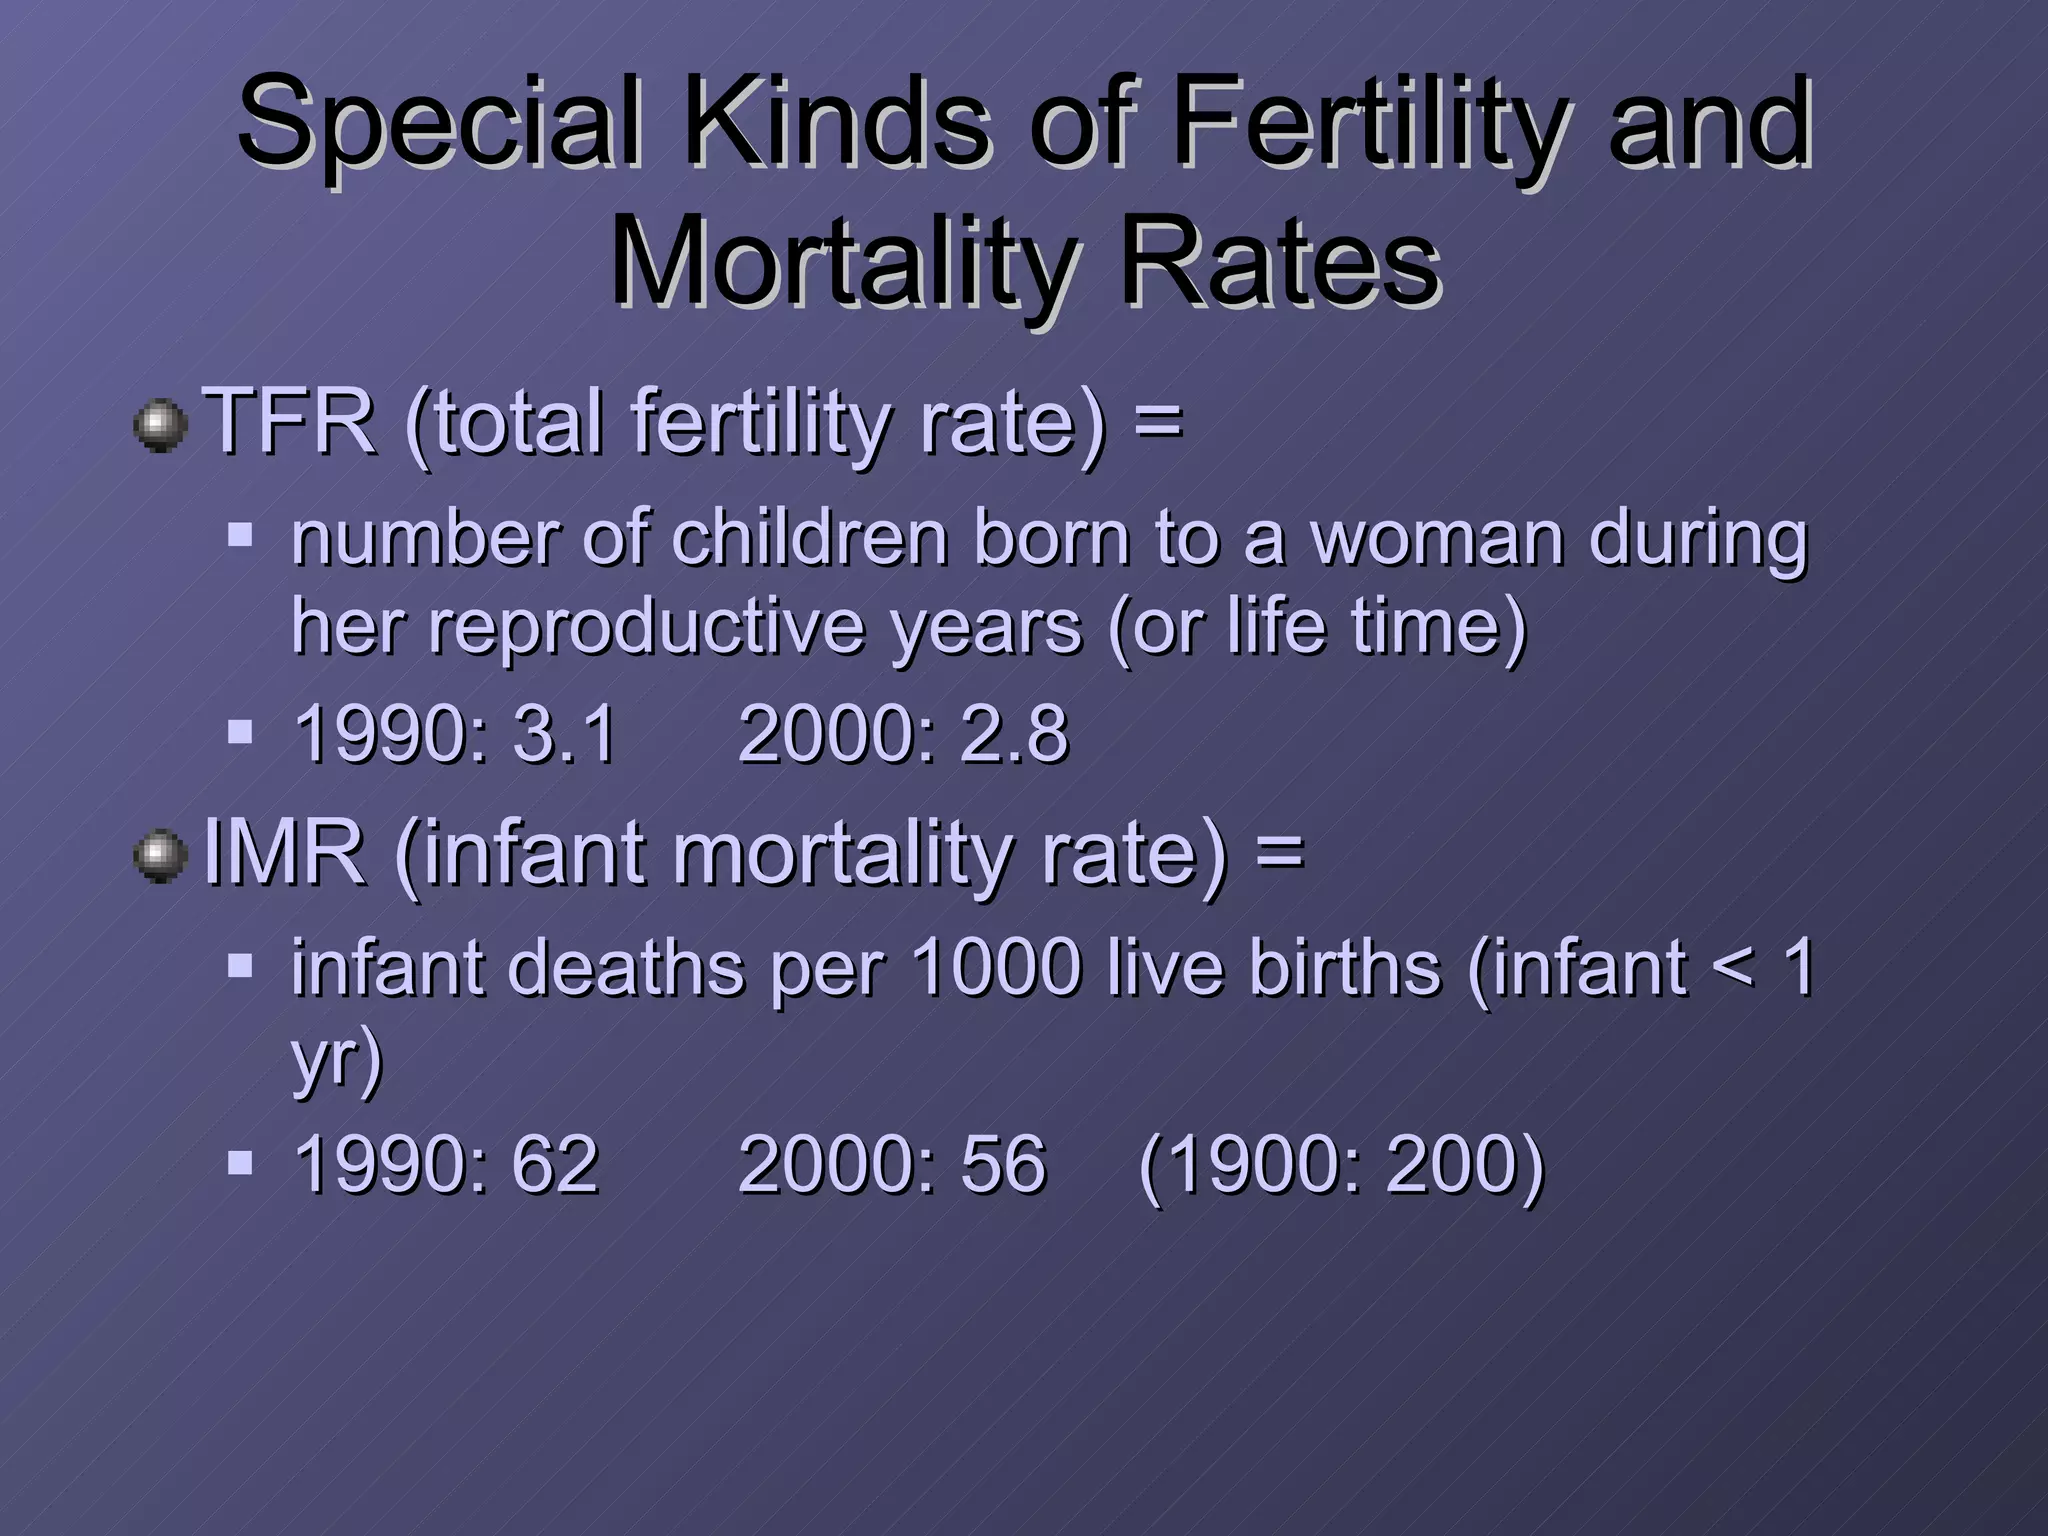
Special Kinds ofFertility and Mortality Rates TFR (total fertility rate) = number of children born to a woman during her reproductive years (or life time) 1990: 3.1 2000: 2.8 IMR (infant mortality rate) = infant deaths per 1000 live births (infant < 1 yr) 1990: 62 2000: 56 (1900: 200)
10.
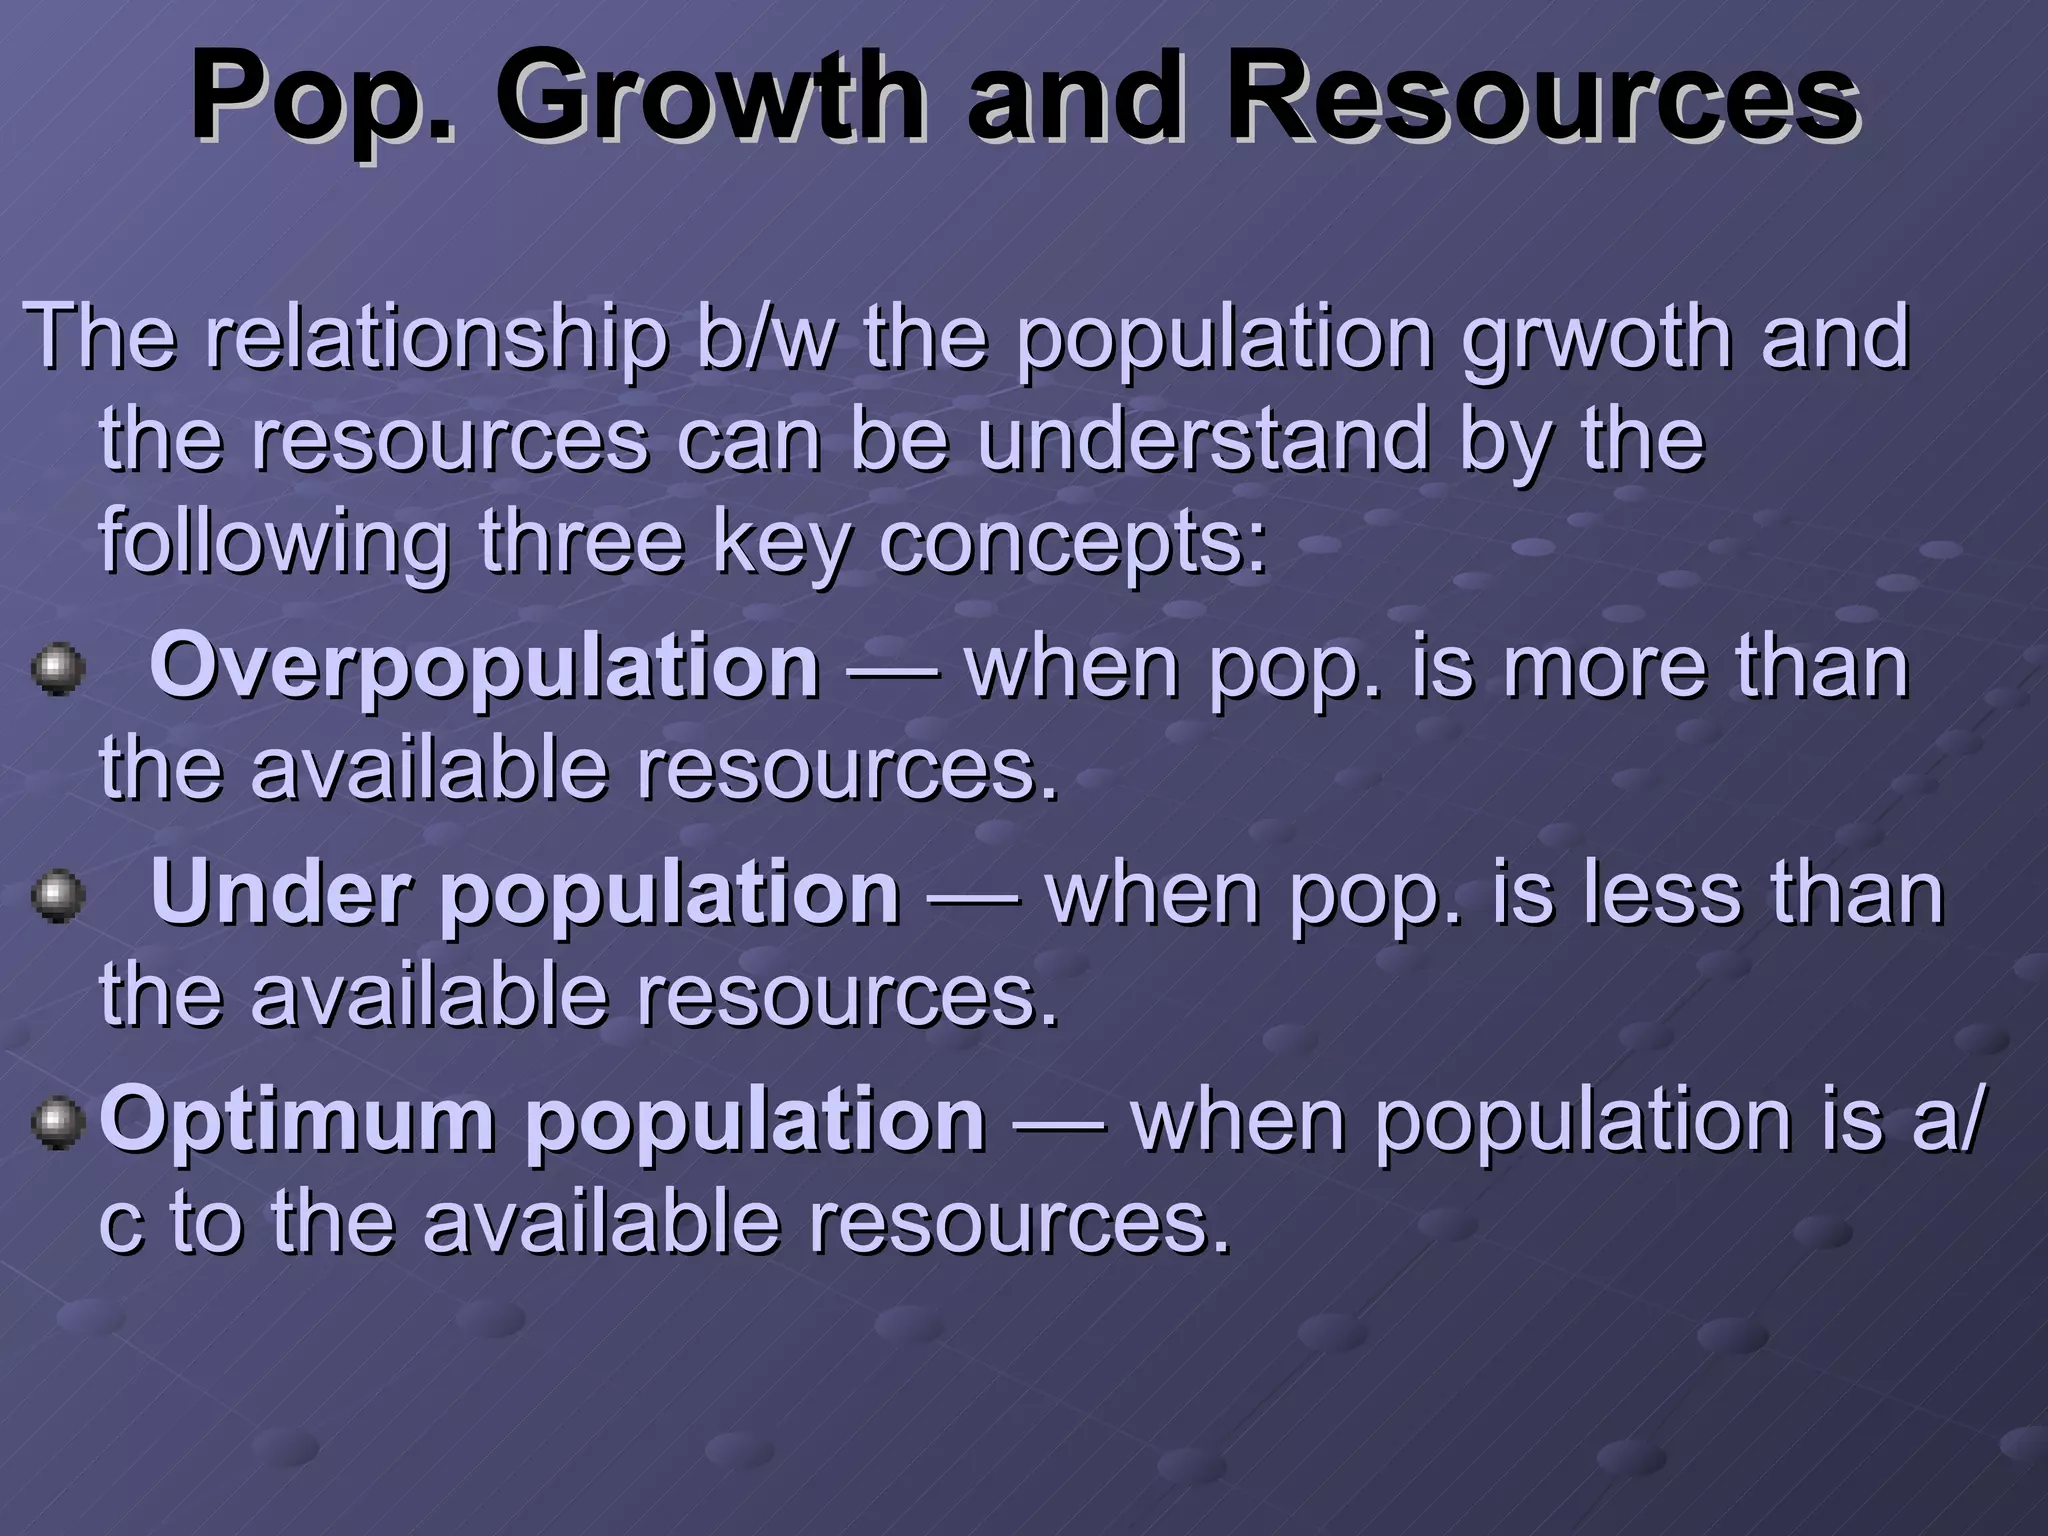
Pop. Growth andResources The relationship b/w the population grwoth and the resources can be understand by the following three key concepts: Overpopulation — when pop. is more than the available resources. Under population — when pop. is less than the available resources. Optimum population — when population is a/c to the available resources.
11.
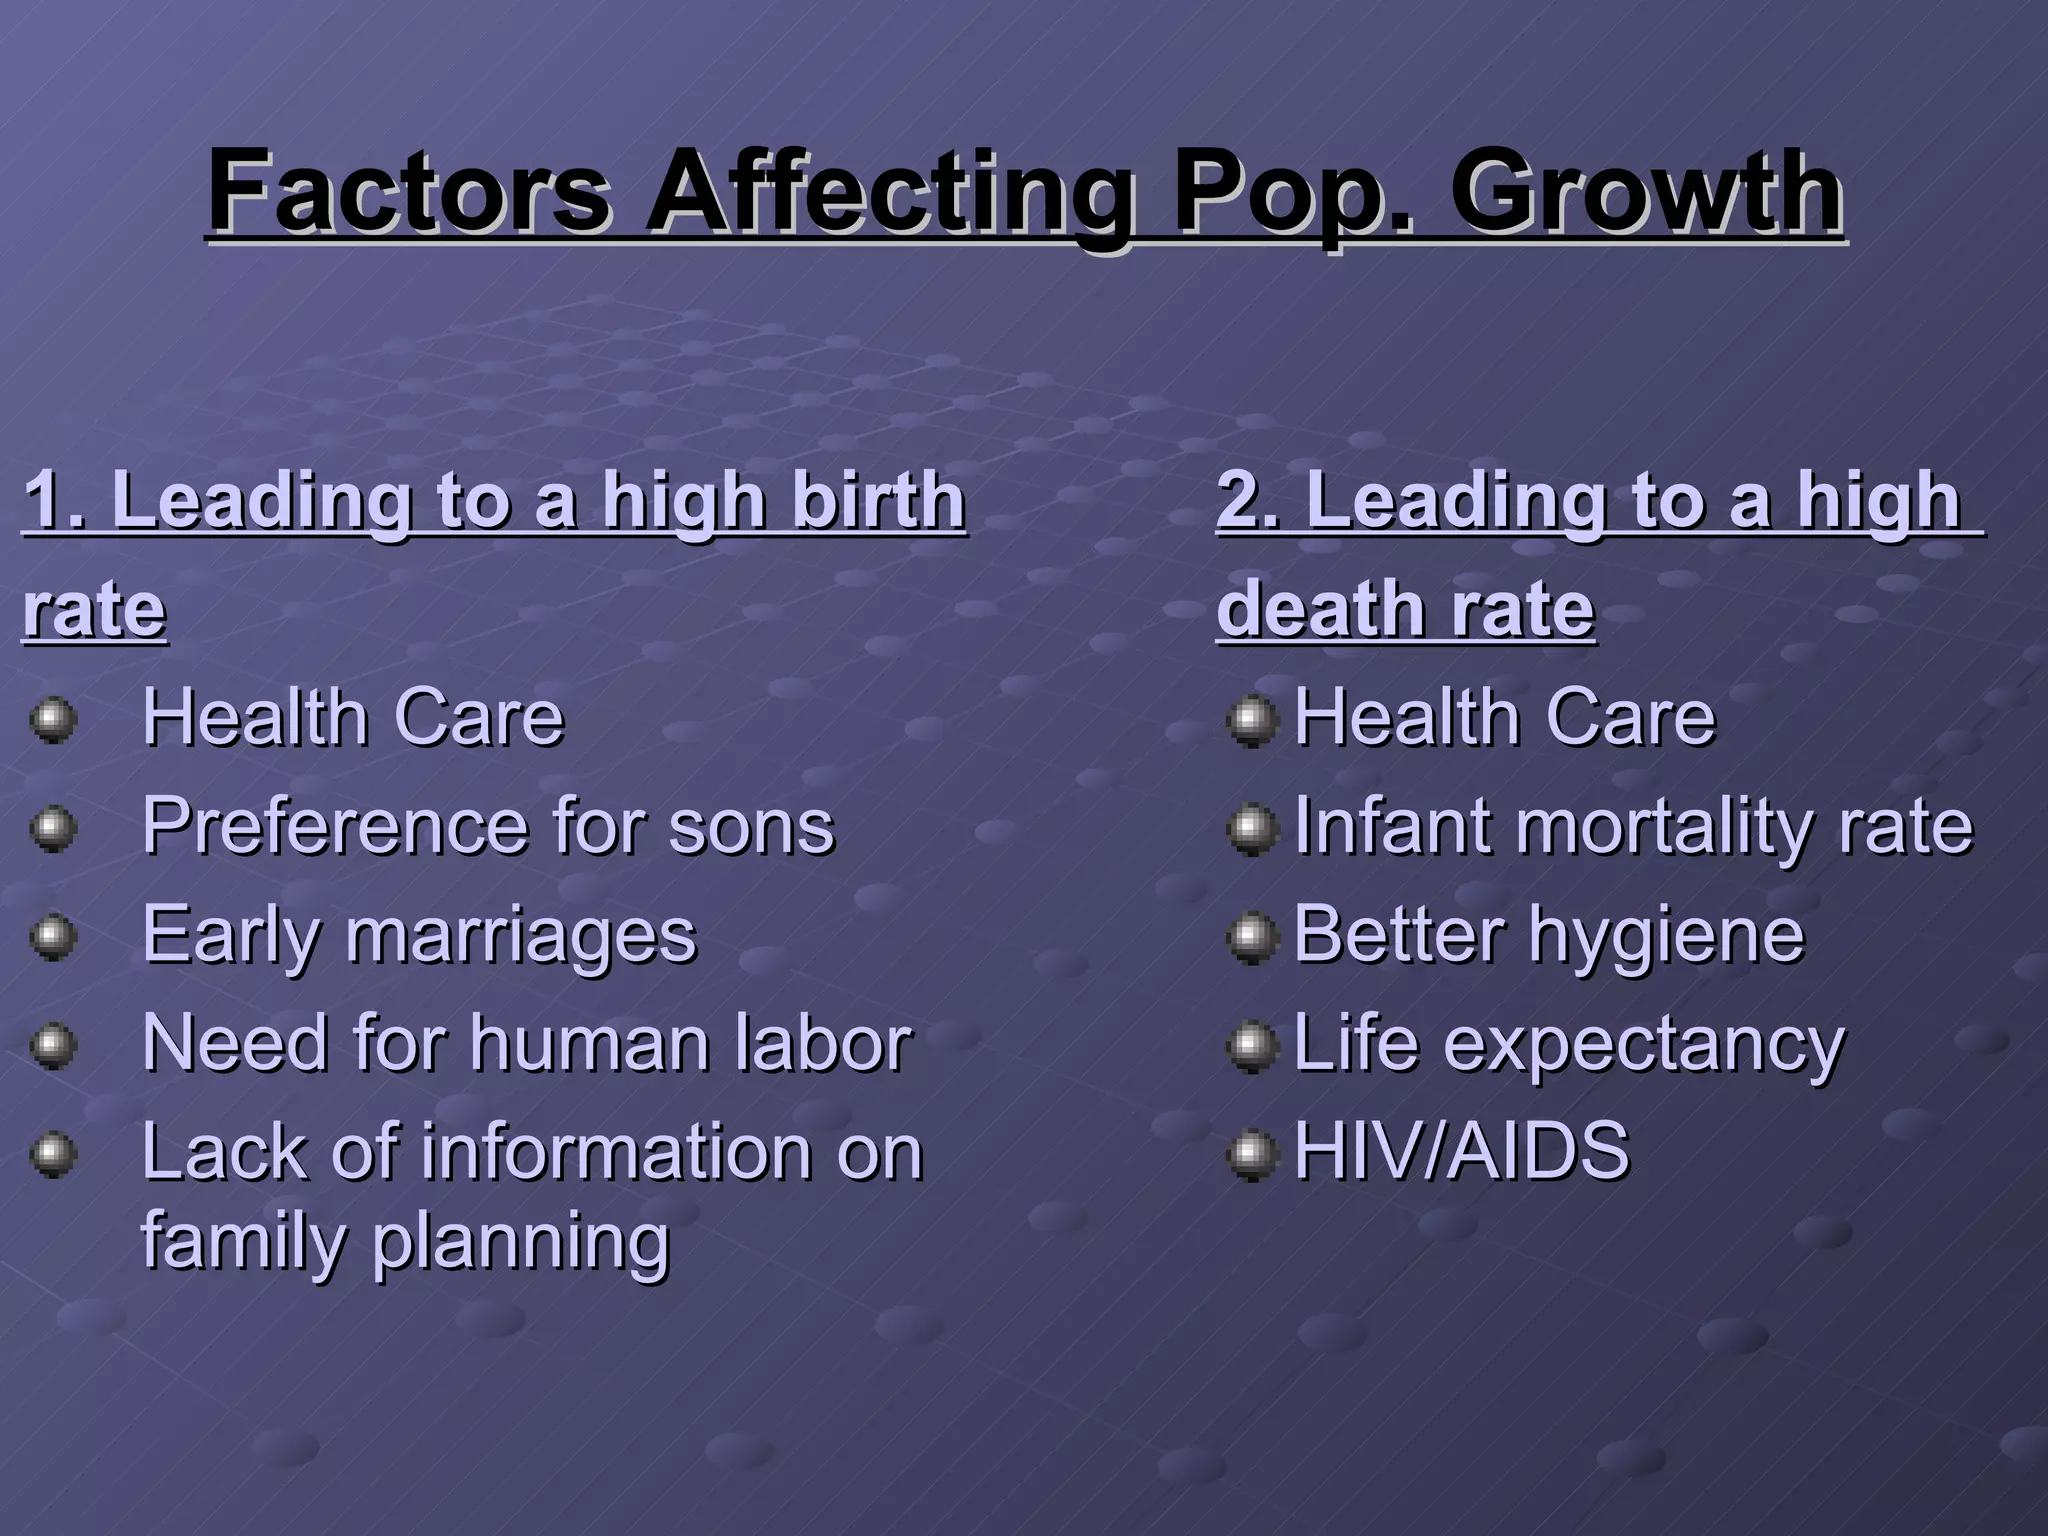
Factors Affecting Pop.Growth 2. Leading to a high death rate Health Care Infant mortality rate Better hygiene Life expectancy HIV/AIDS 1. Leading to a high birth rate Health Care Preference for sons Early marriages Need for human labor Lack of information on family planning
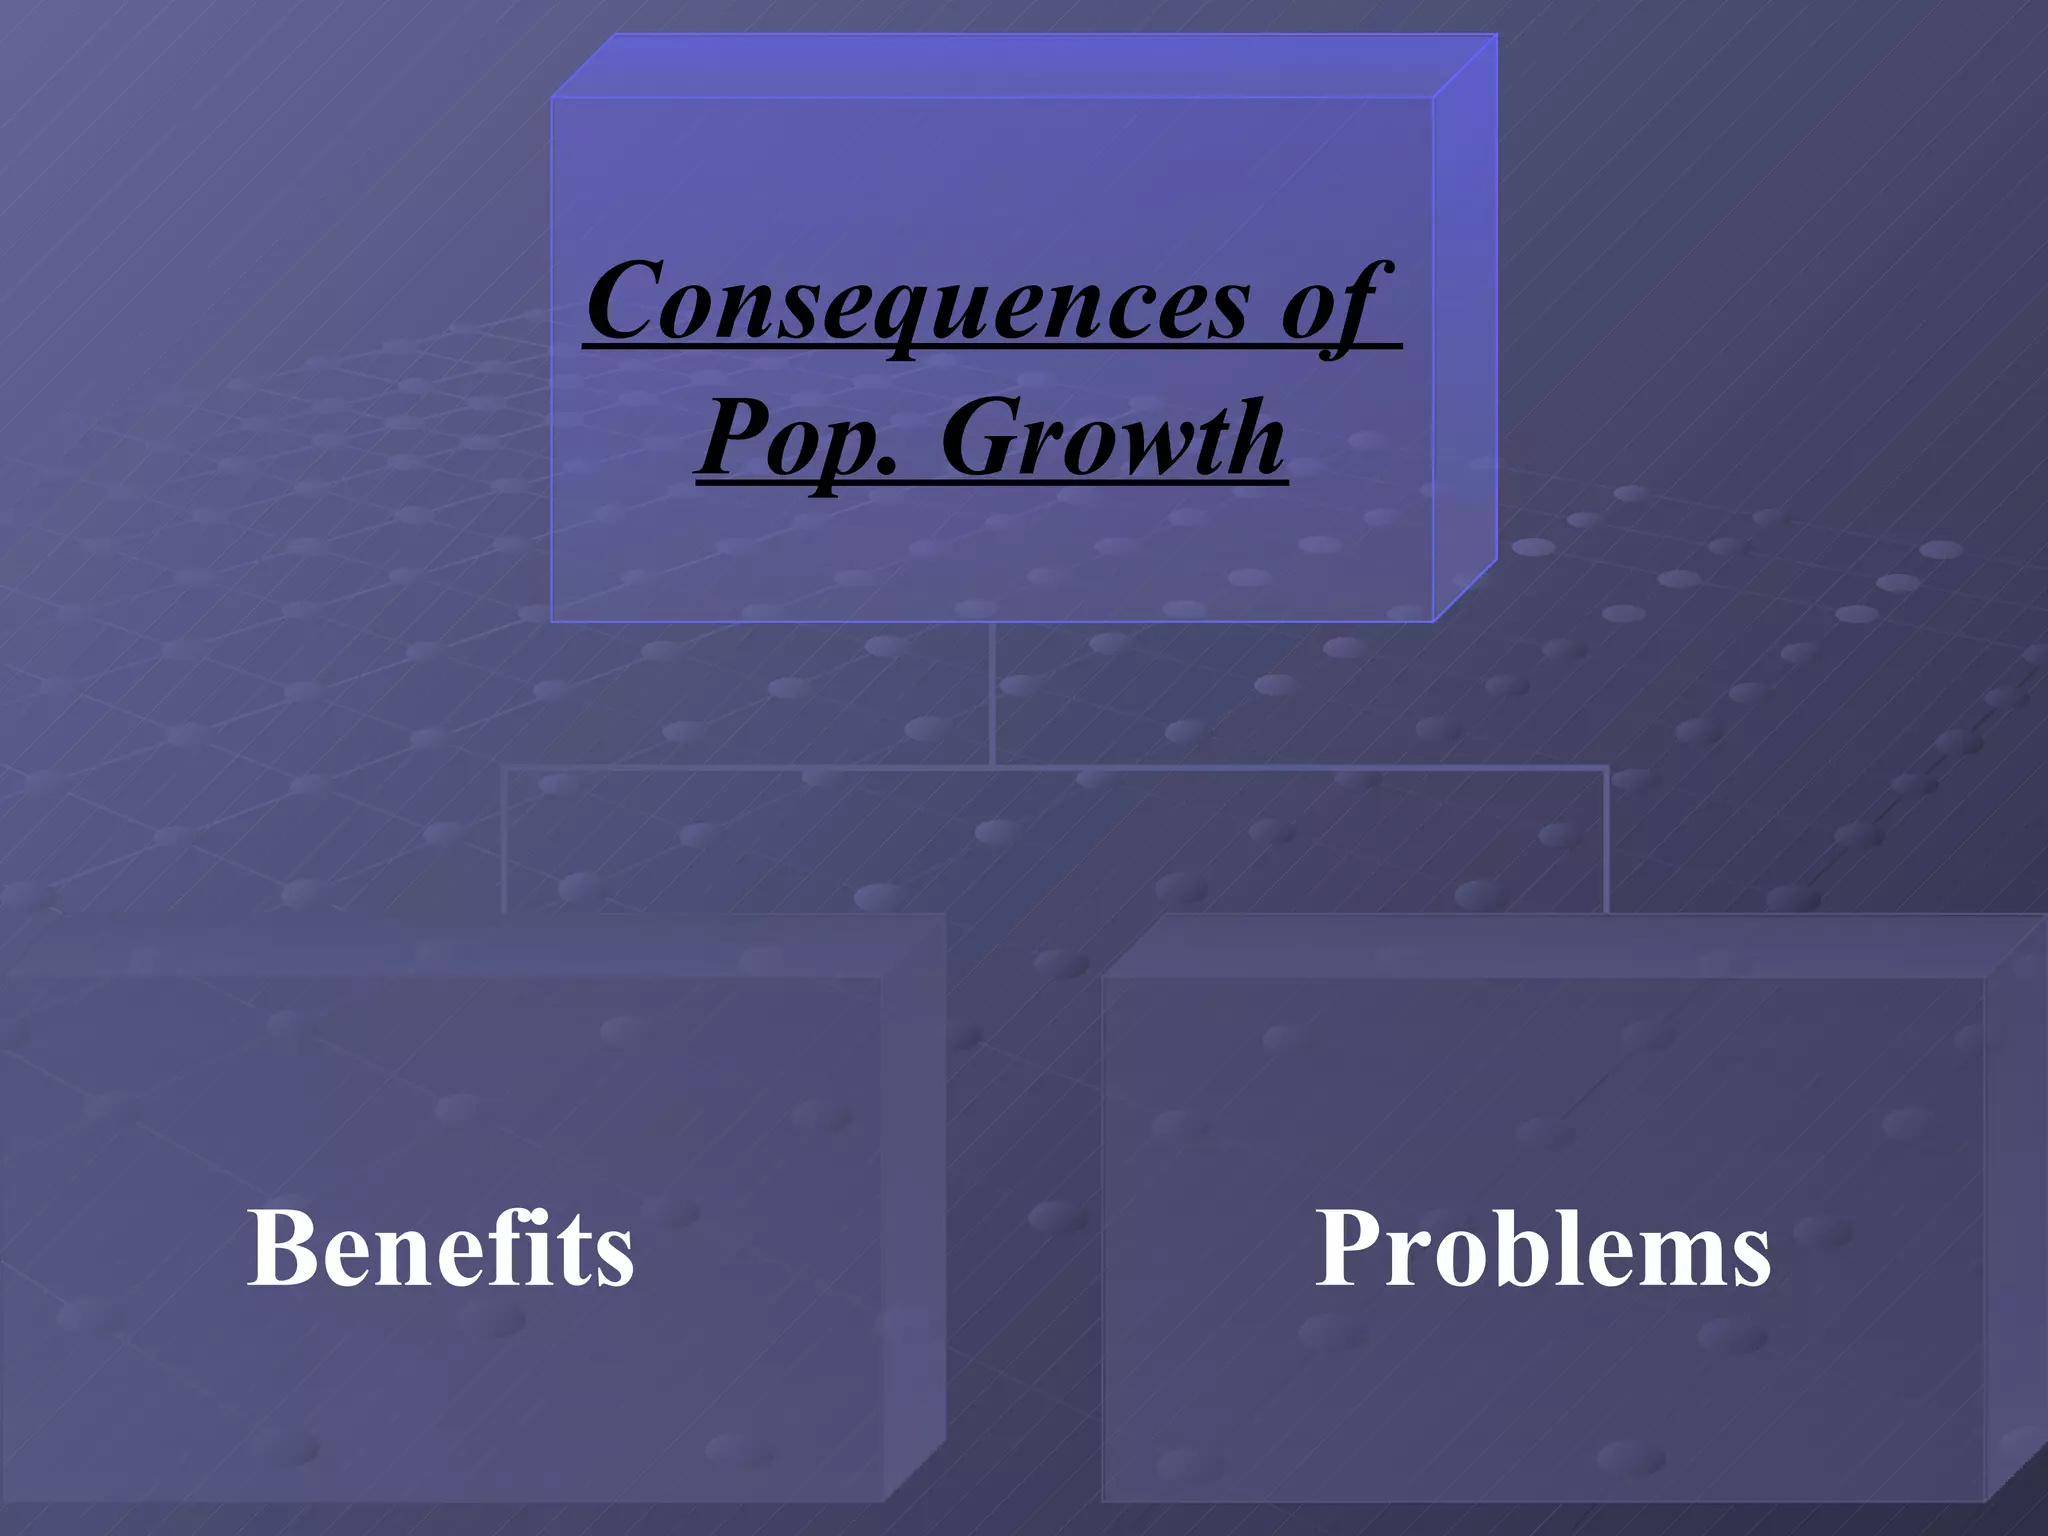
Benefits: Problems: Competition for jobs Competition for housing Educational opportunities Shortage of food supply Sanitation and sewage Transportation Health care Controls: Incentives and penalties Family planning
16.
Population, population change,growth rates Population: number of persons Population change: increase in the number of persons (per year) Growth rates: rate of change (per year)
17.
18.
19.
20.
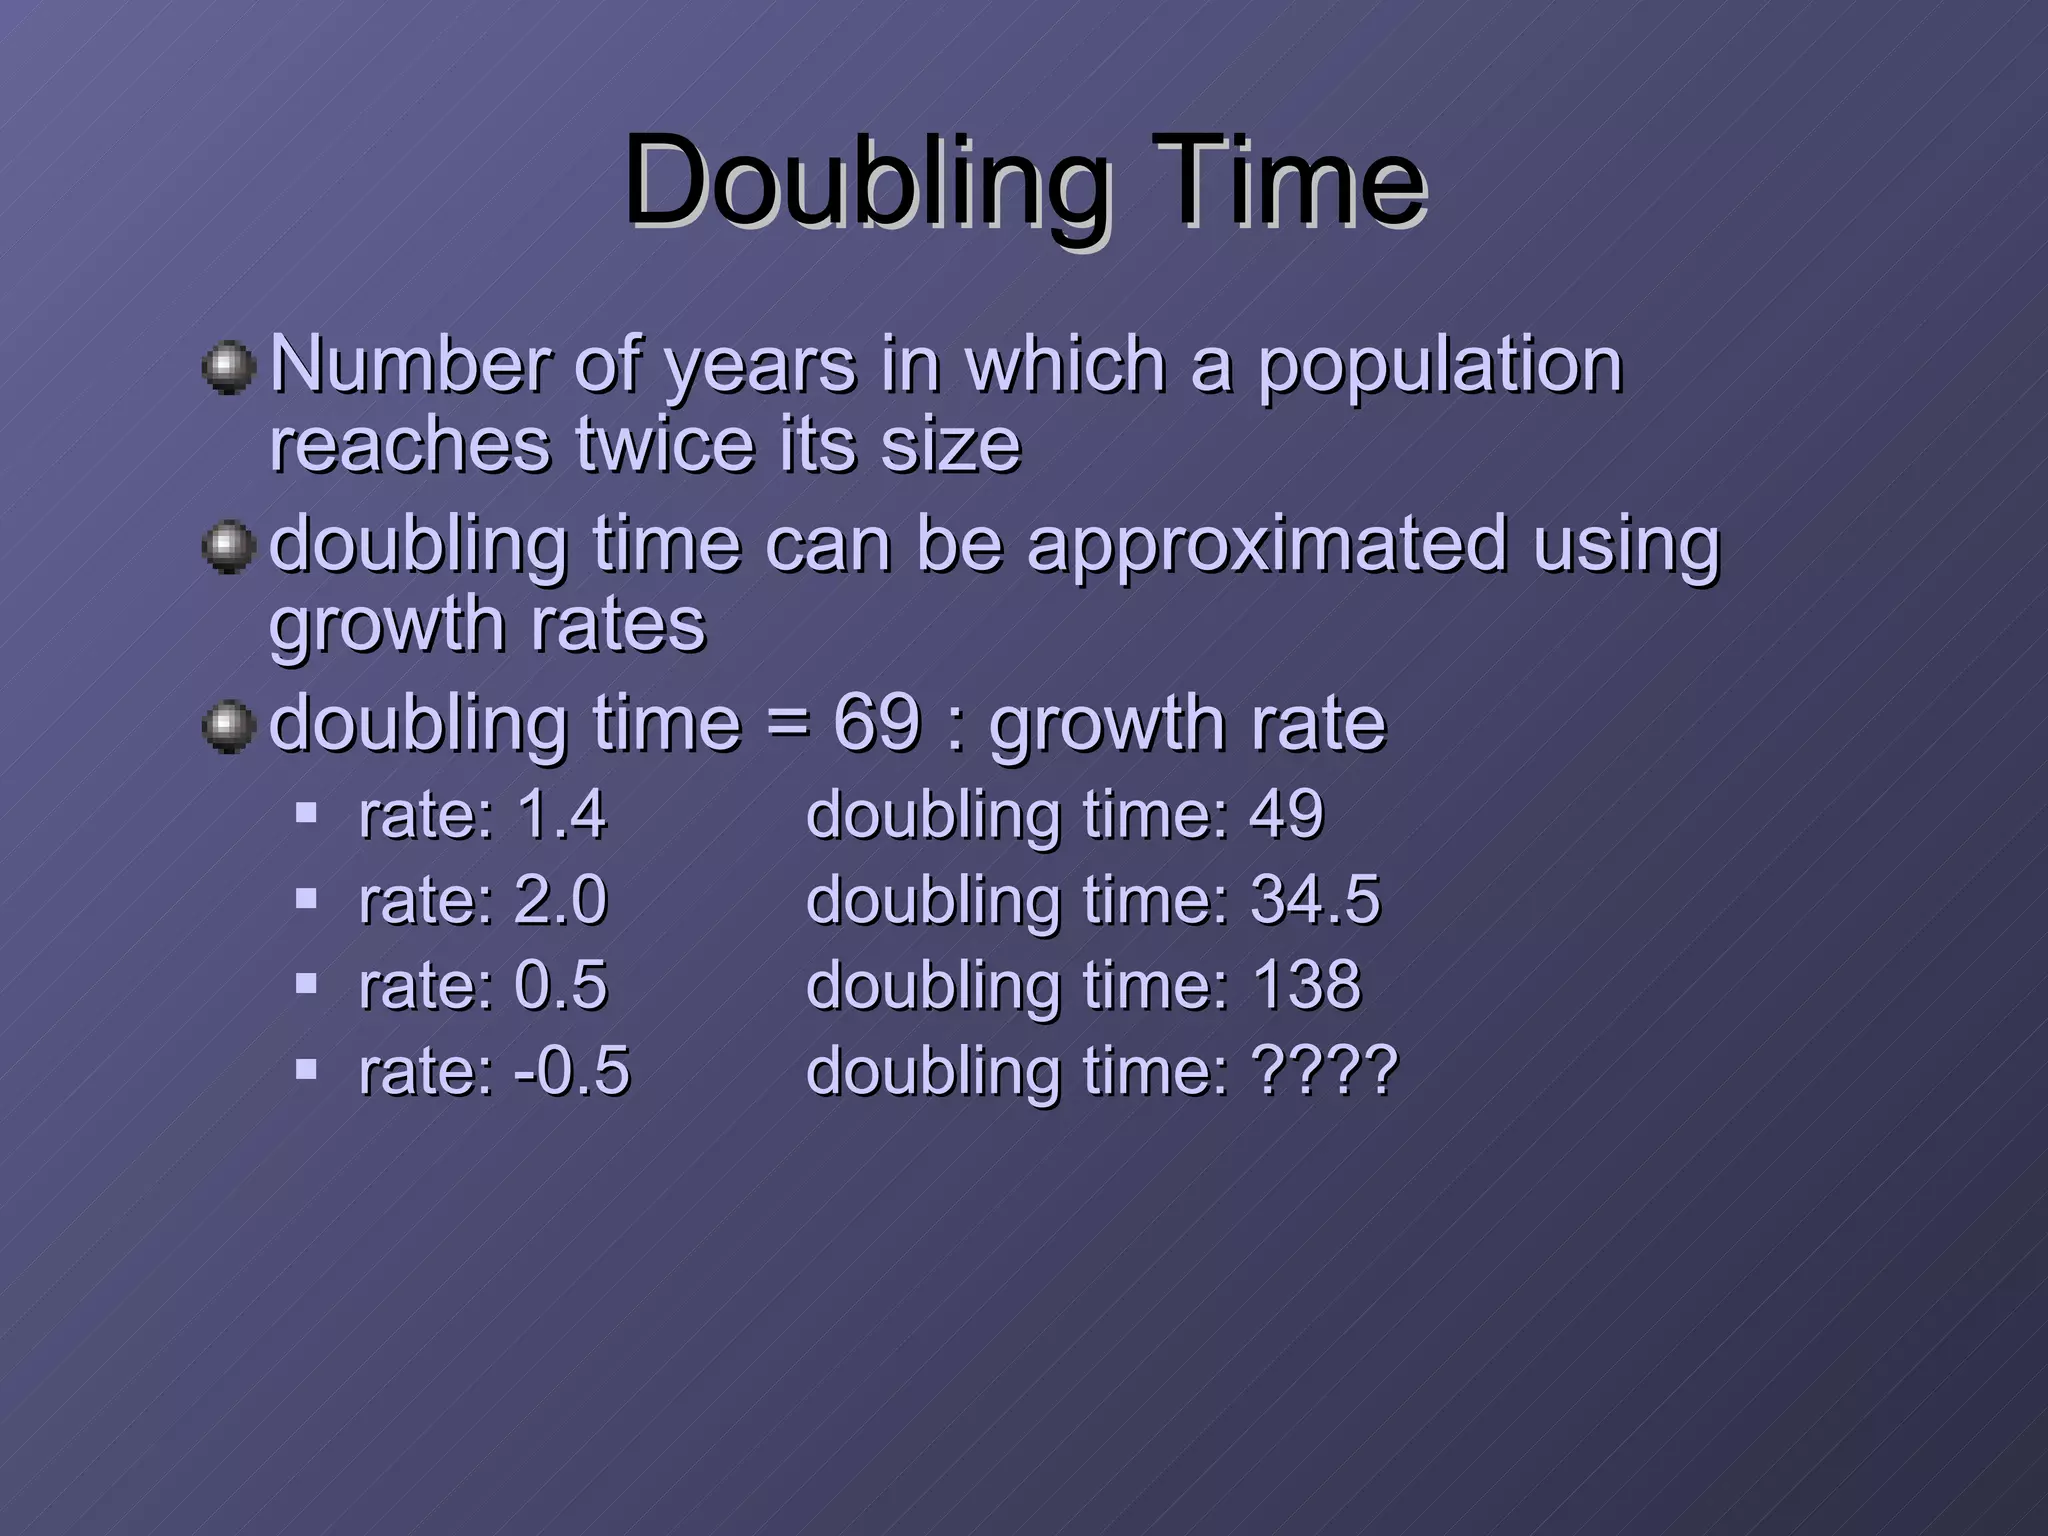
Doubling Time Number of years in which a population reaches twice its size doubling time can be approximated using growth rates doubling time = 69 : growth rate rate: 1.4 doubling time: 49 rate: 2.0 doubling time: 34.5 rate: 0.5 doubling time: 138 rate: -0.5 doubling time: ????
21.
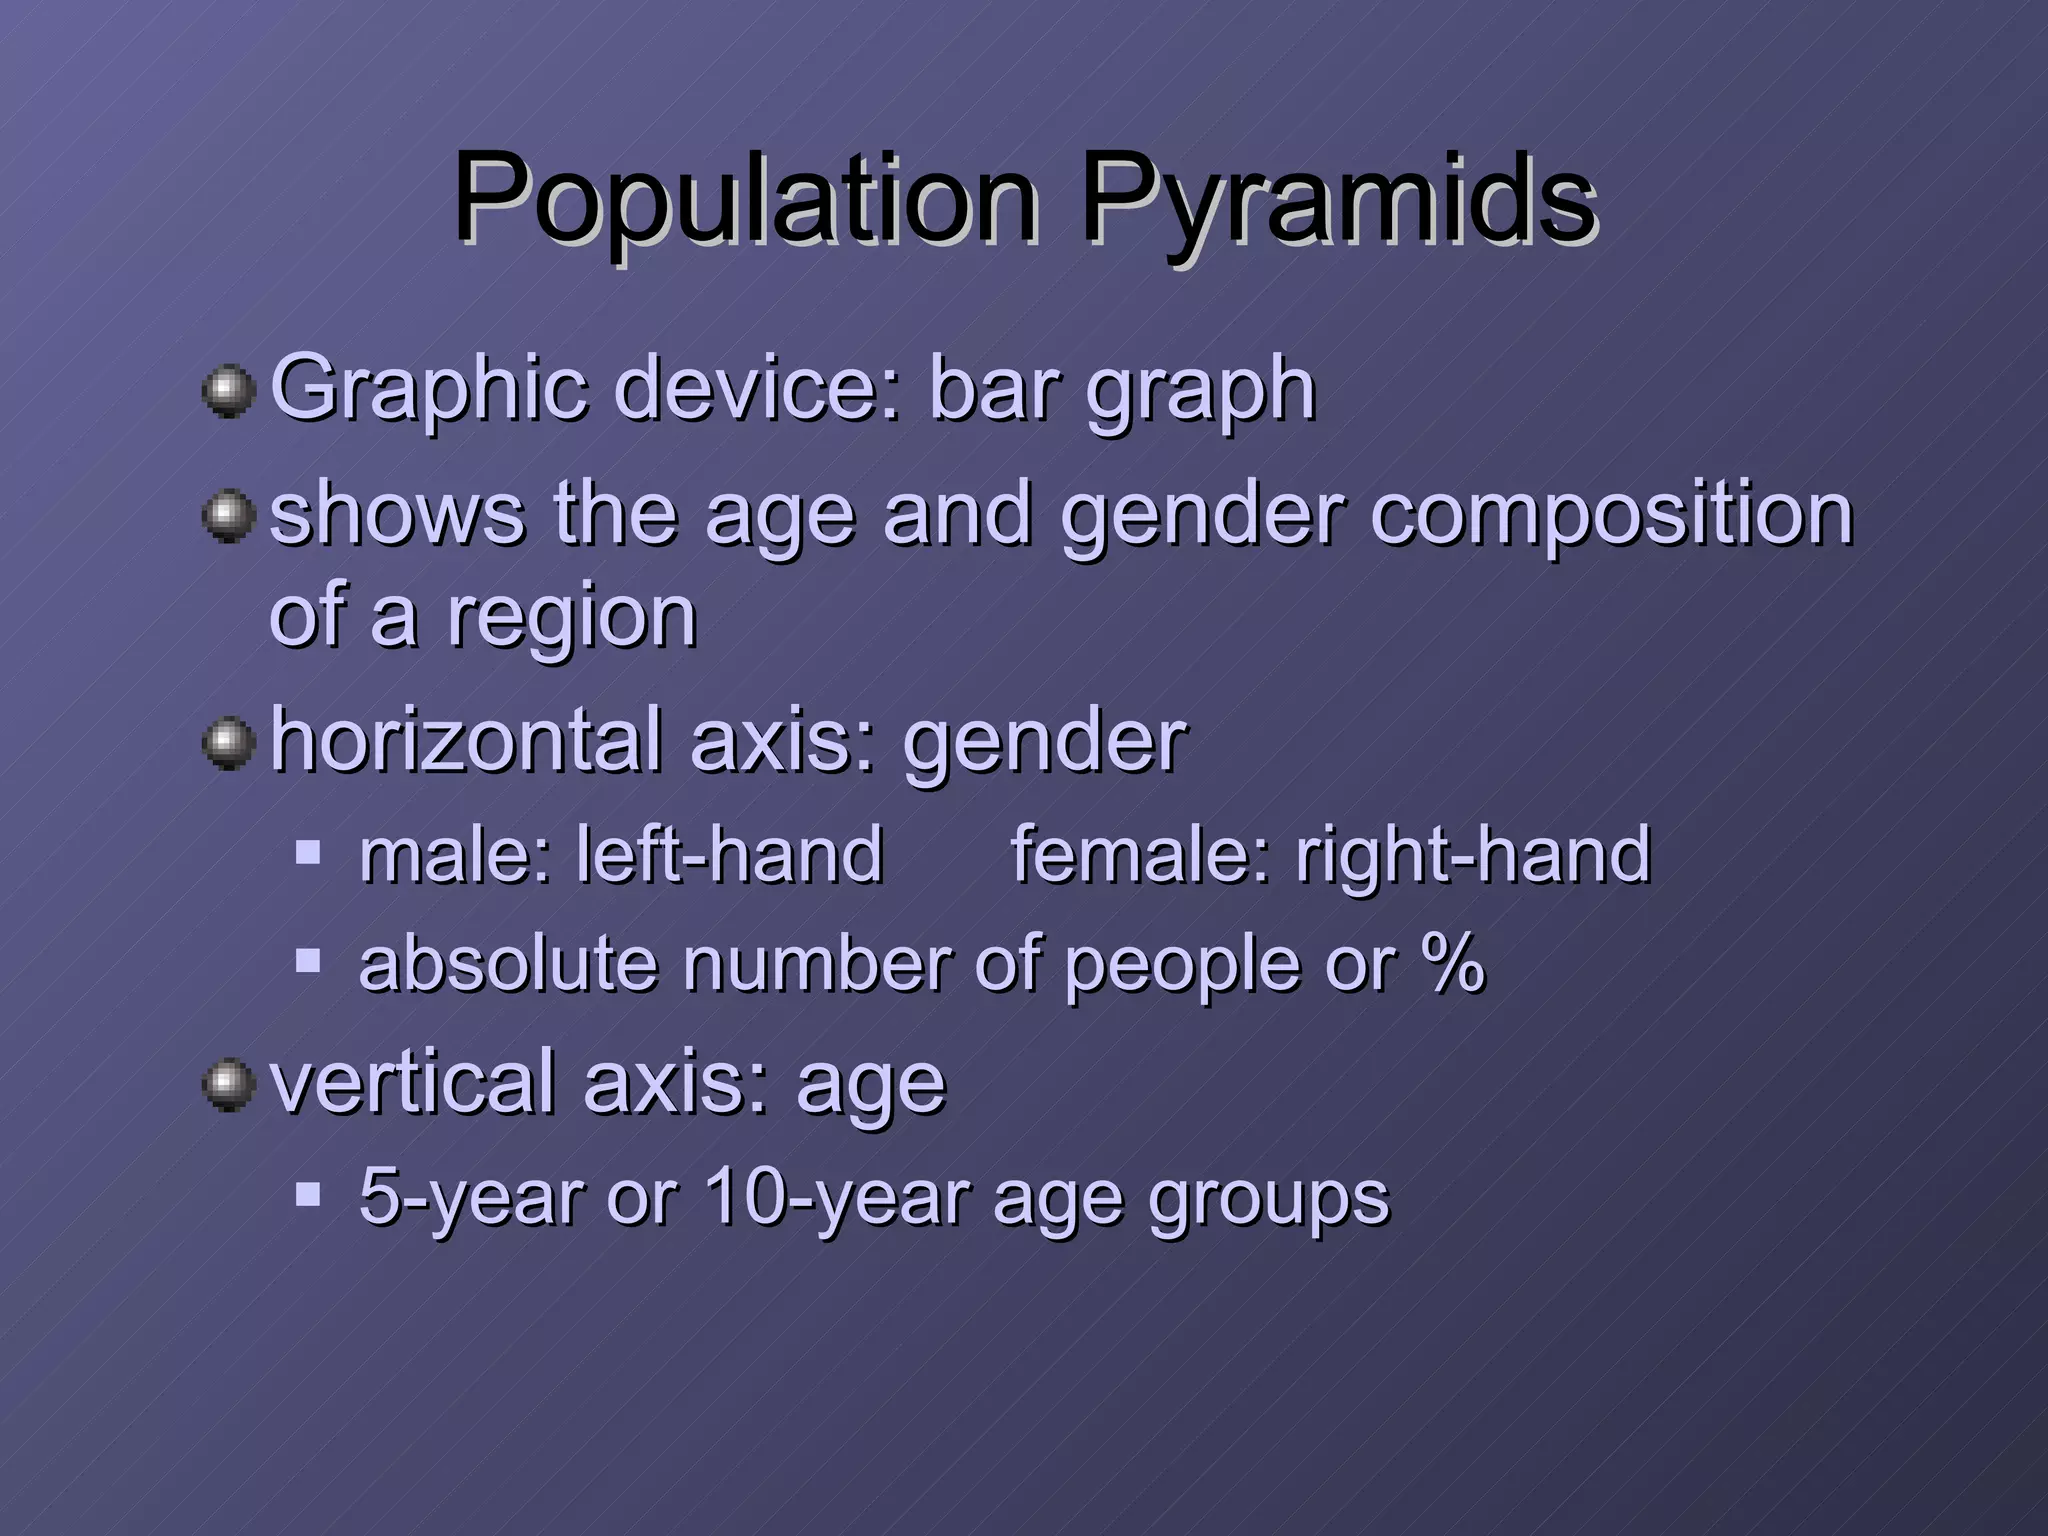
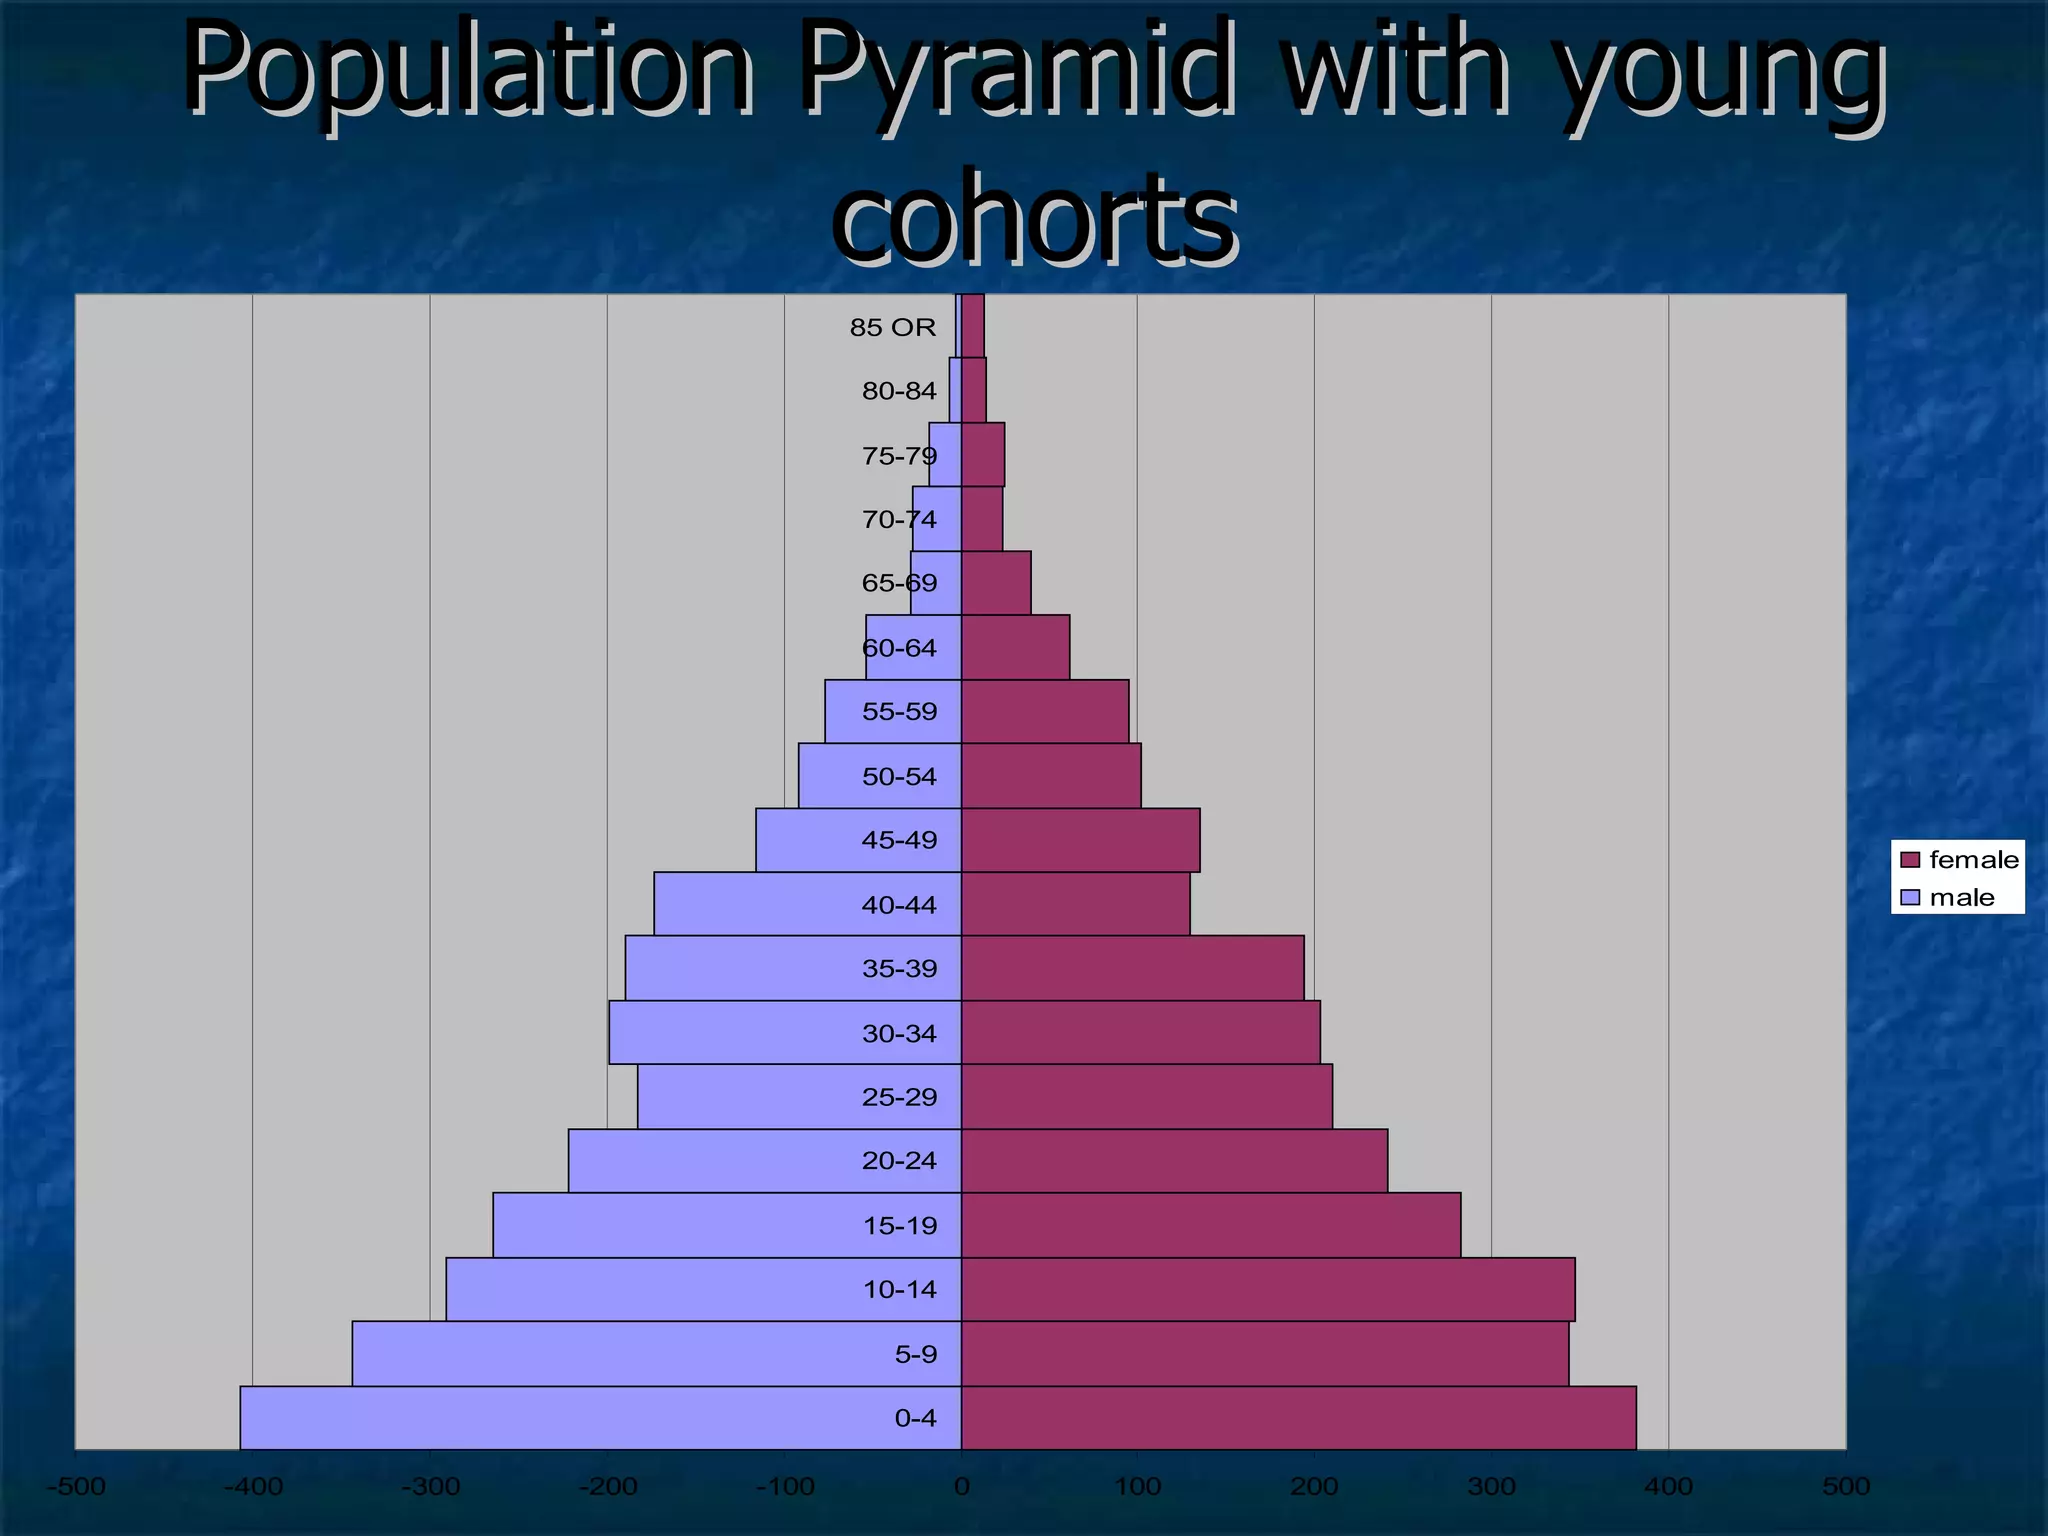
Population Pyramids Graphicdevice: bar graph shows the age and gender composition of a region horizontal axis: gender male: left-hand female: right-hand absolute number of people or % vertical axis: age 5-year or 10-year age groups
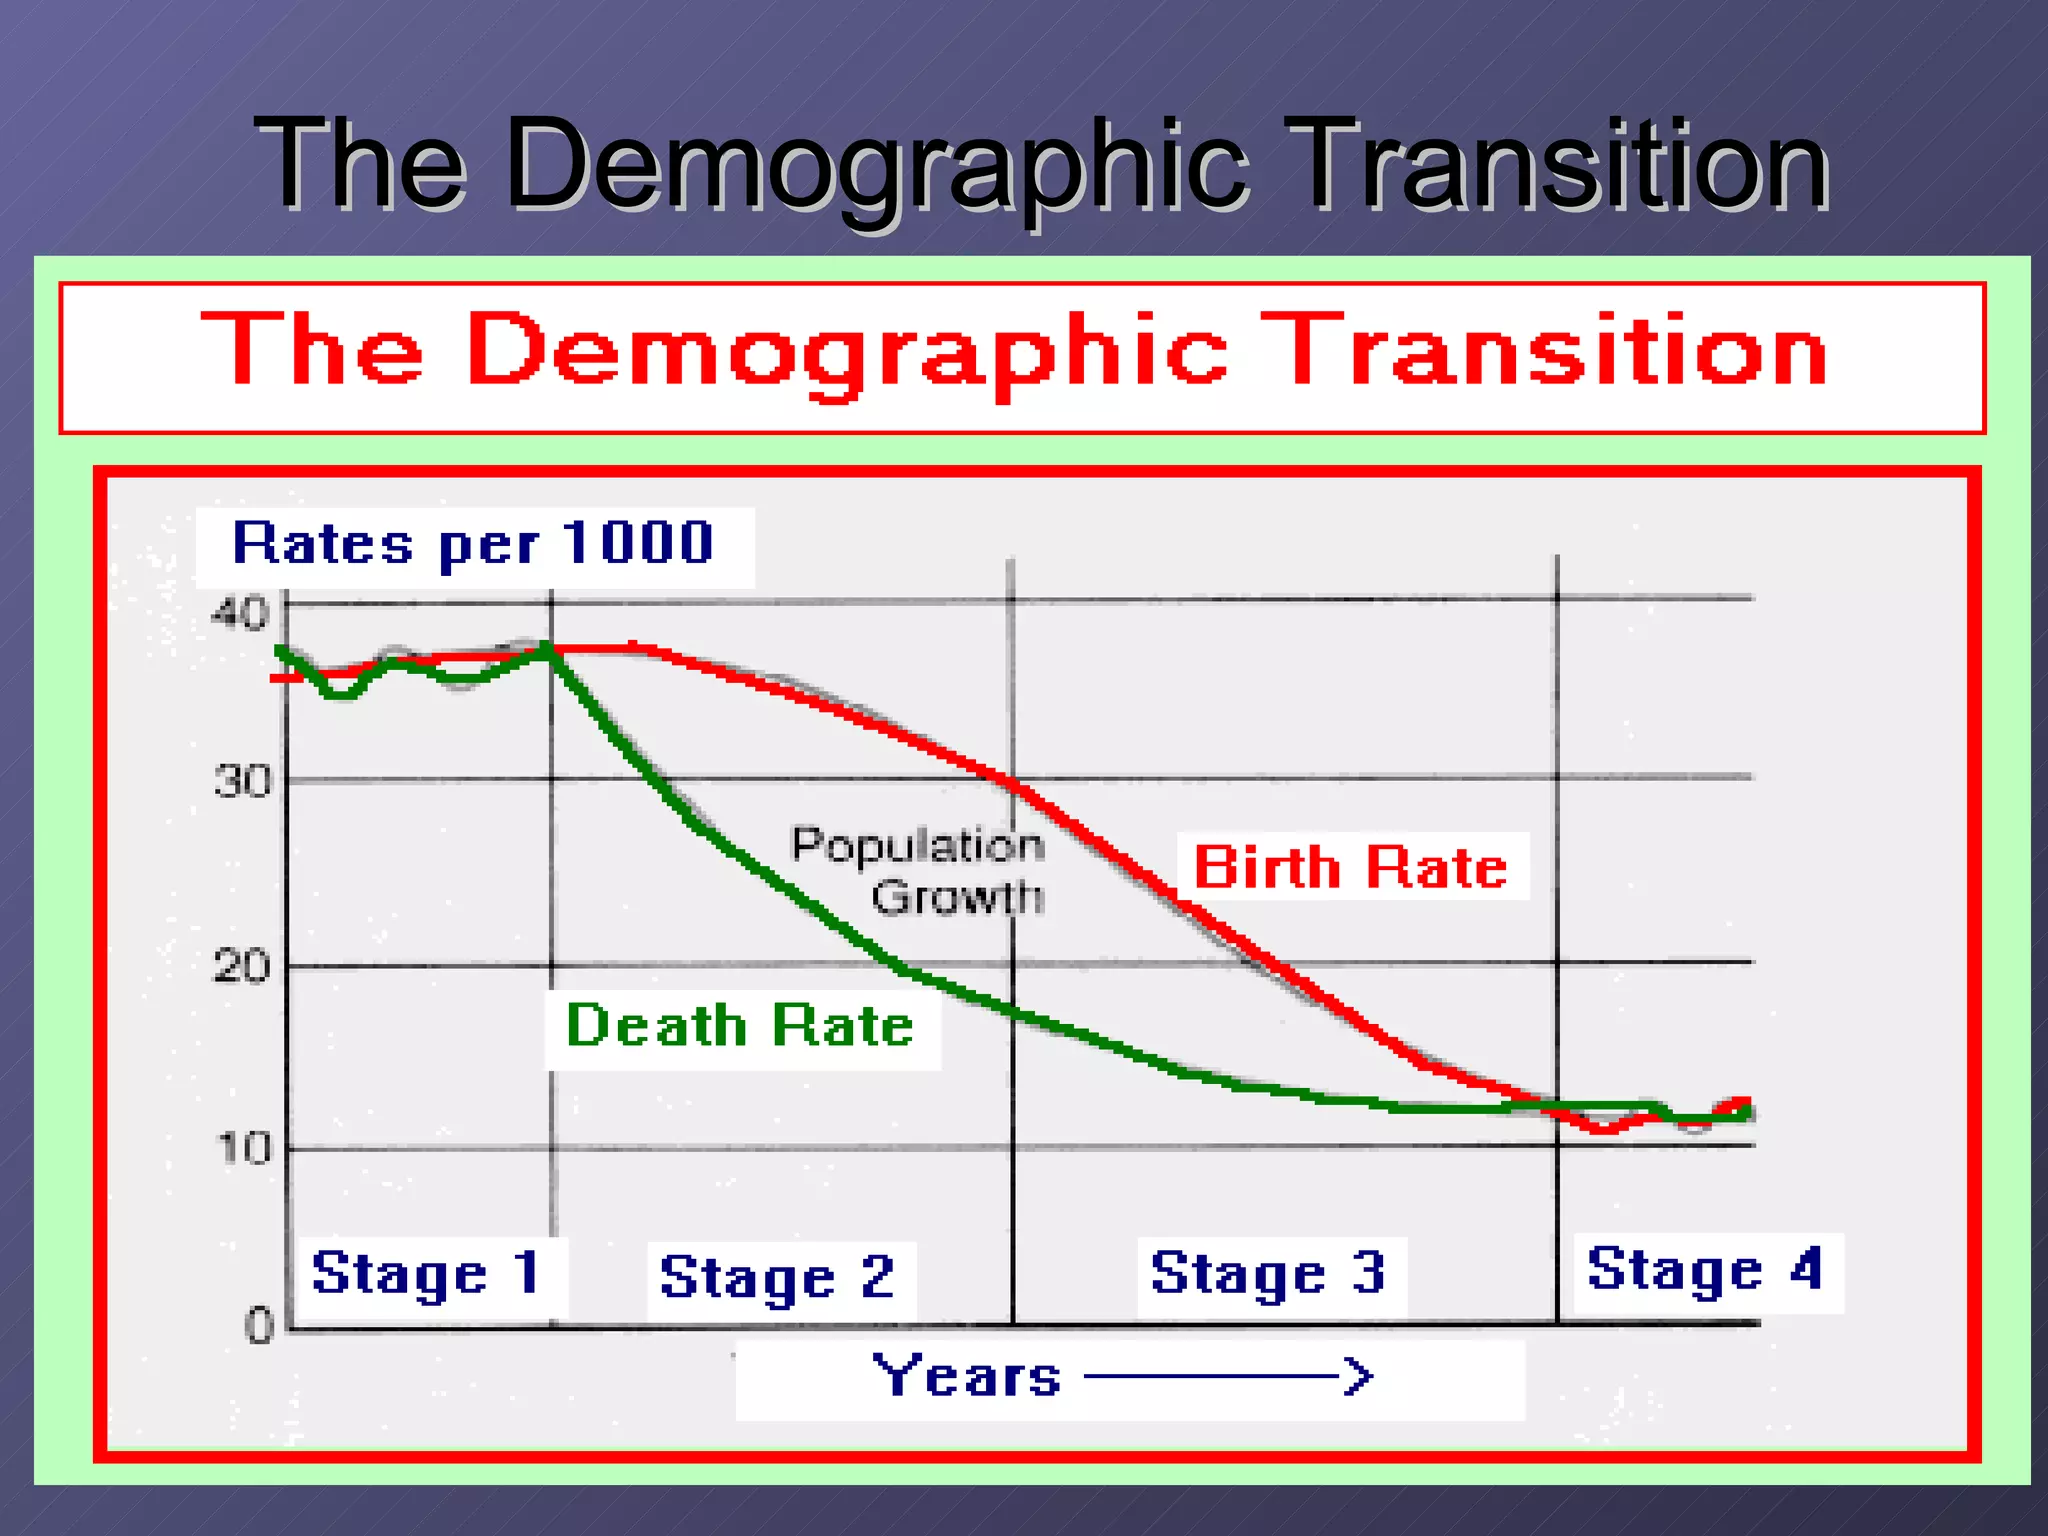
Five Stages ofthe Demographic Transition birth rates, death rates and growth rates systematically change through time as societies change: modernize, urbanize gain access to technology
24.
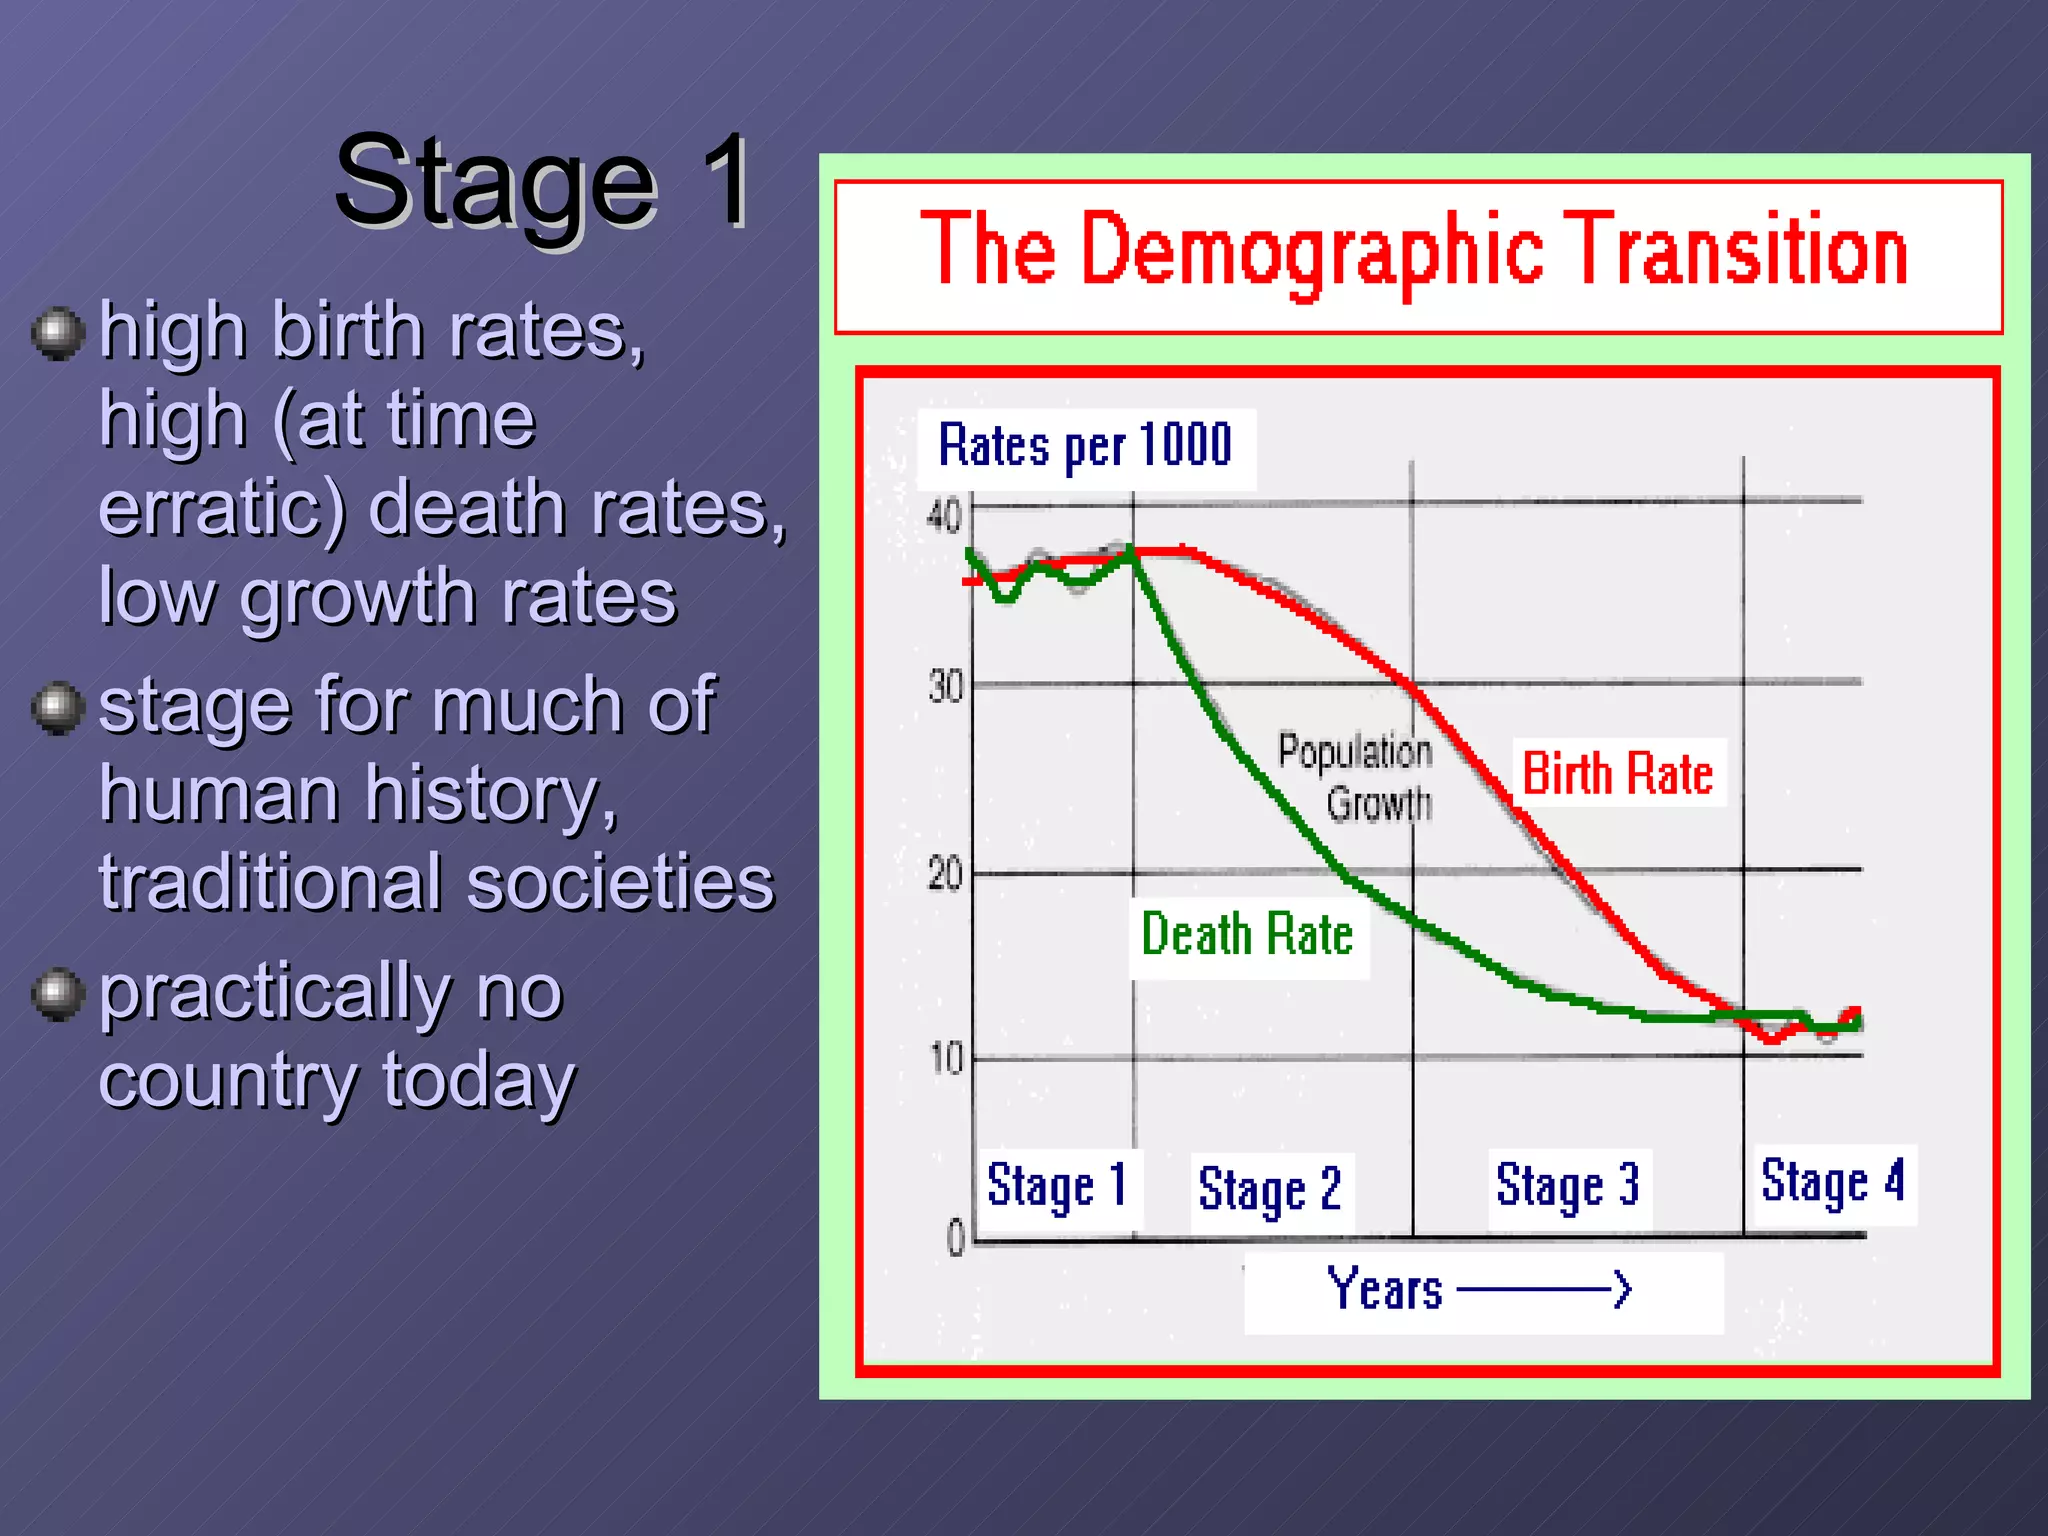
Stage 1 highbirth rates, high (at time erratic) death rates, low growth rates stage for much of human history, traditional societies practically no country today
25.
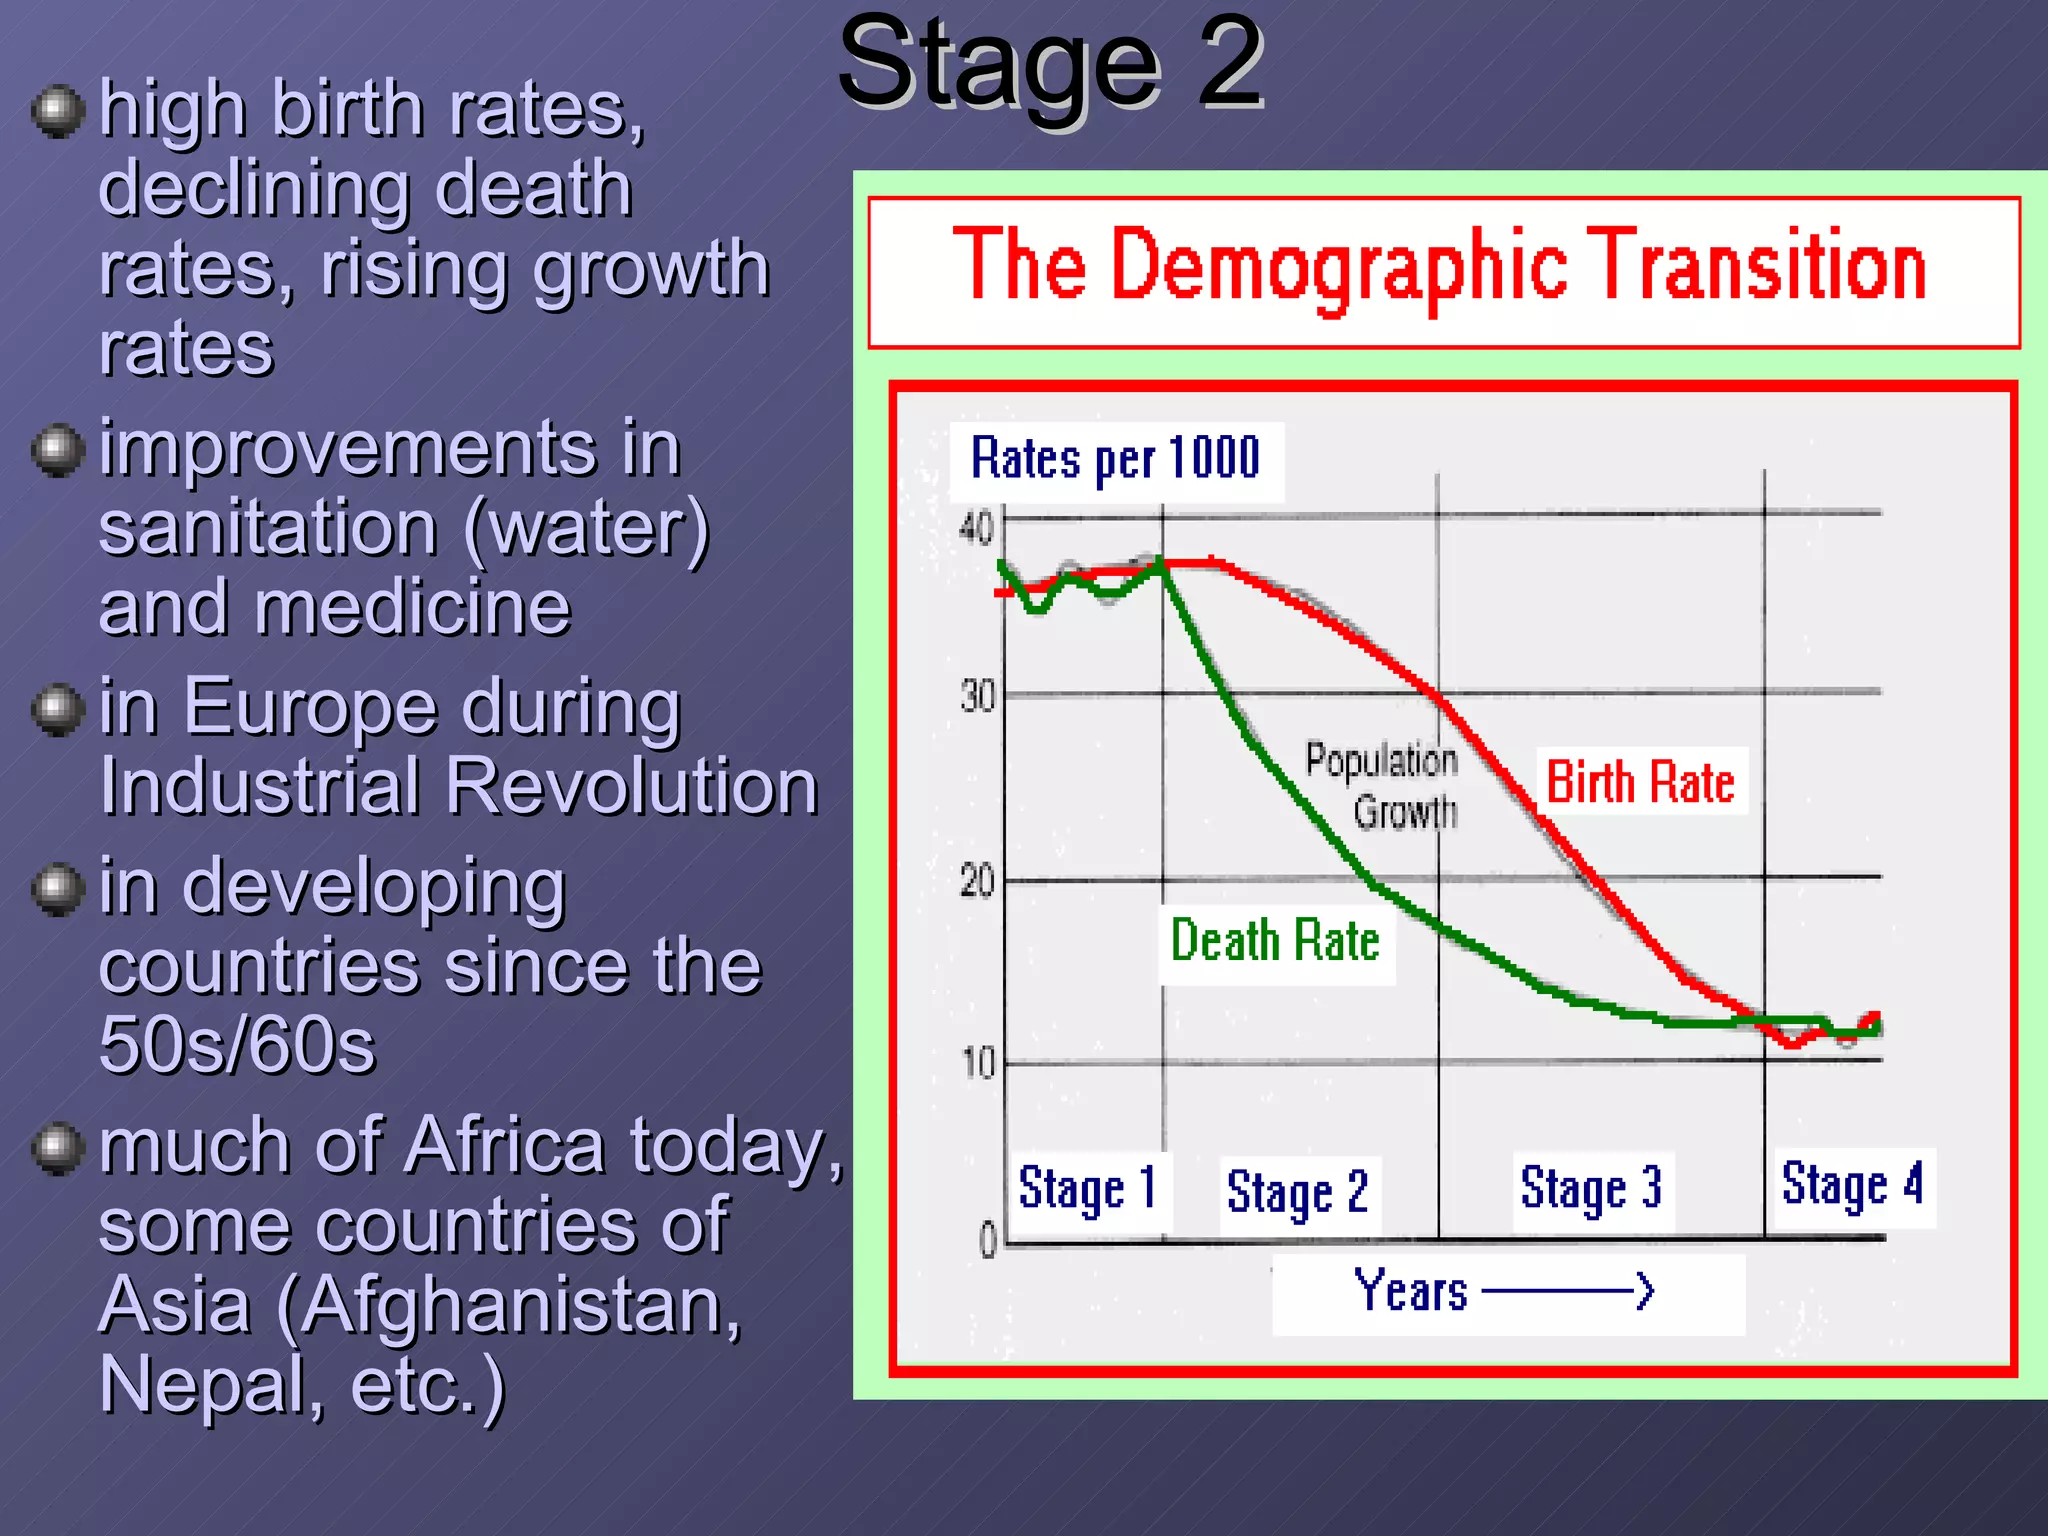
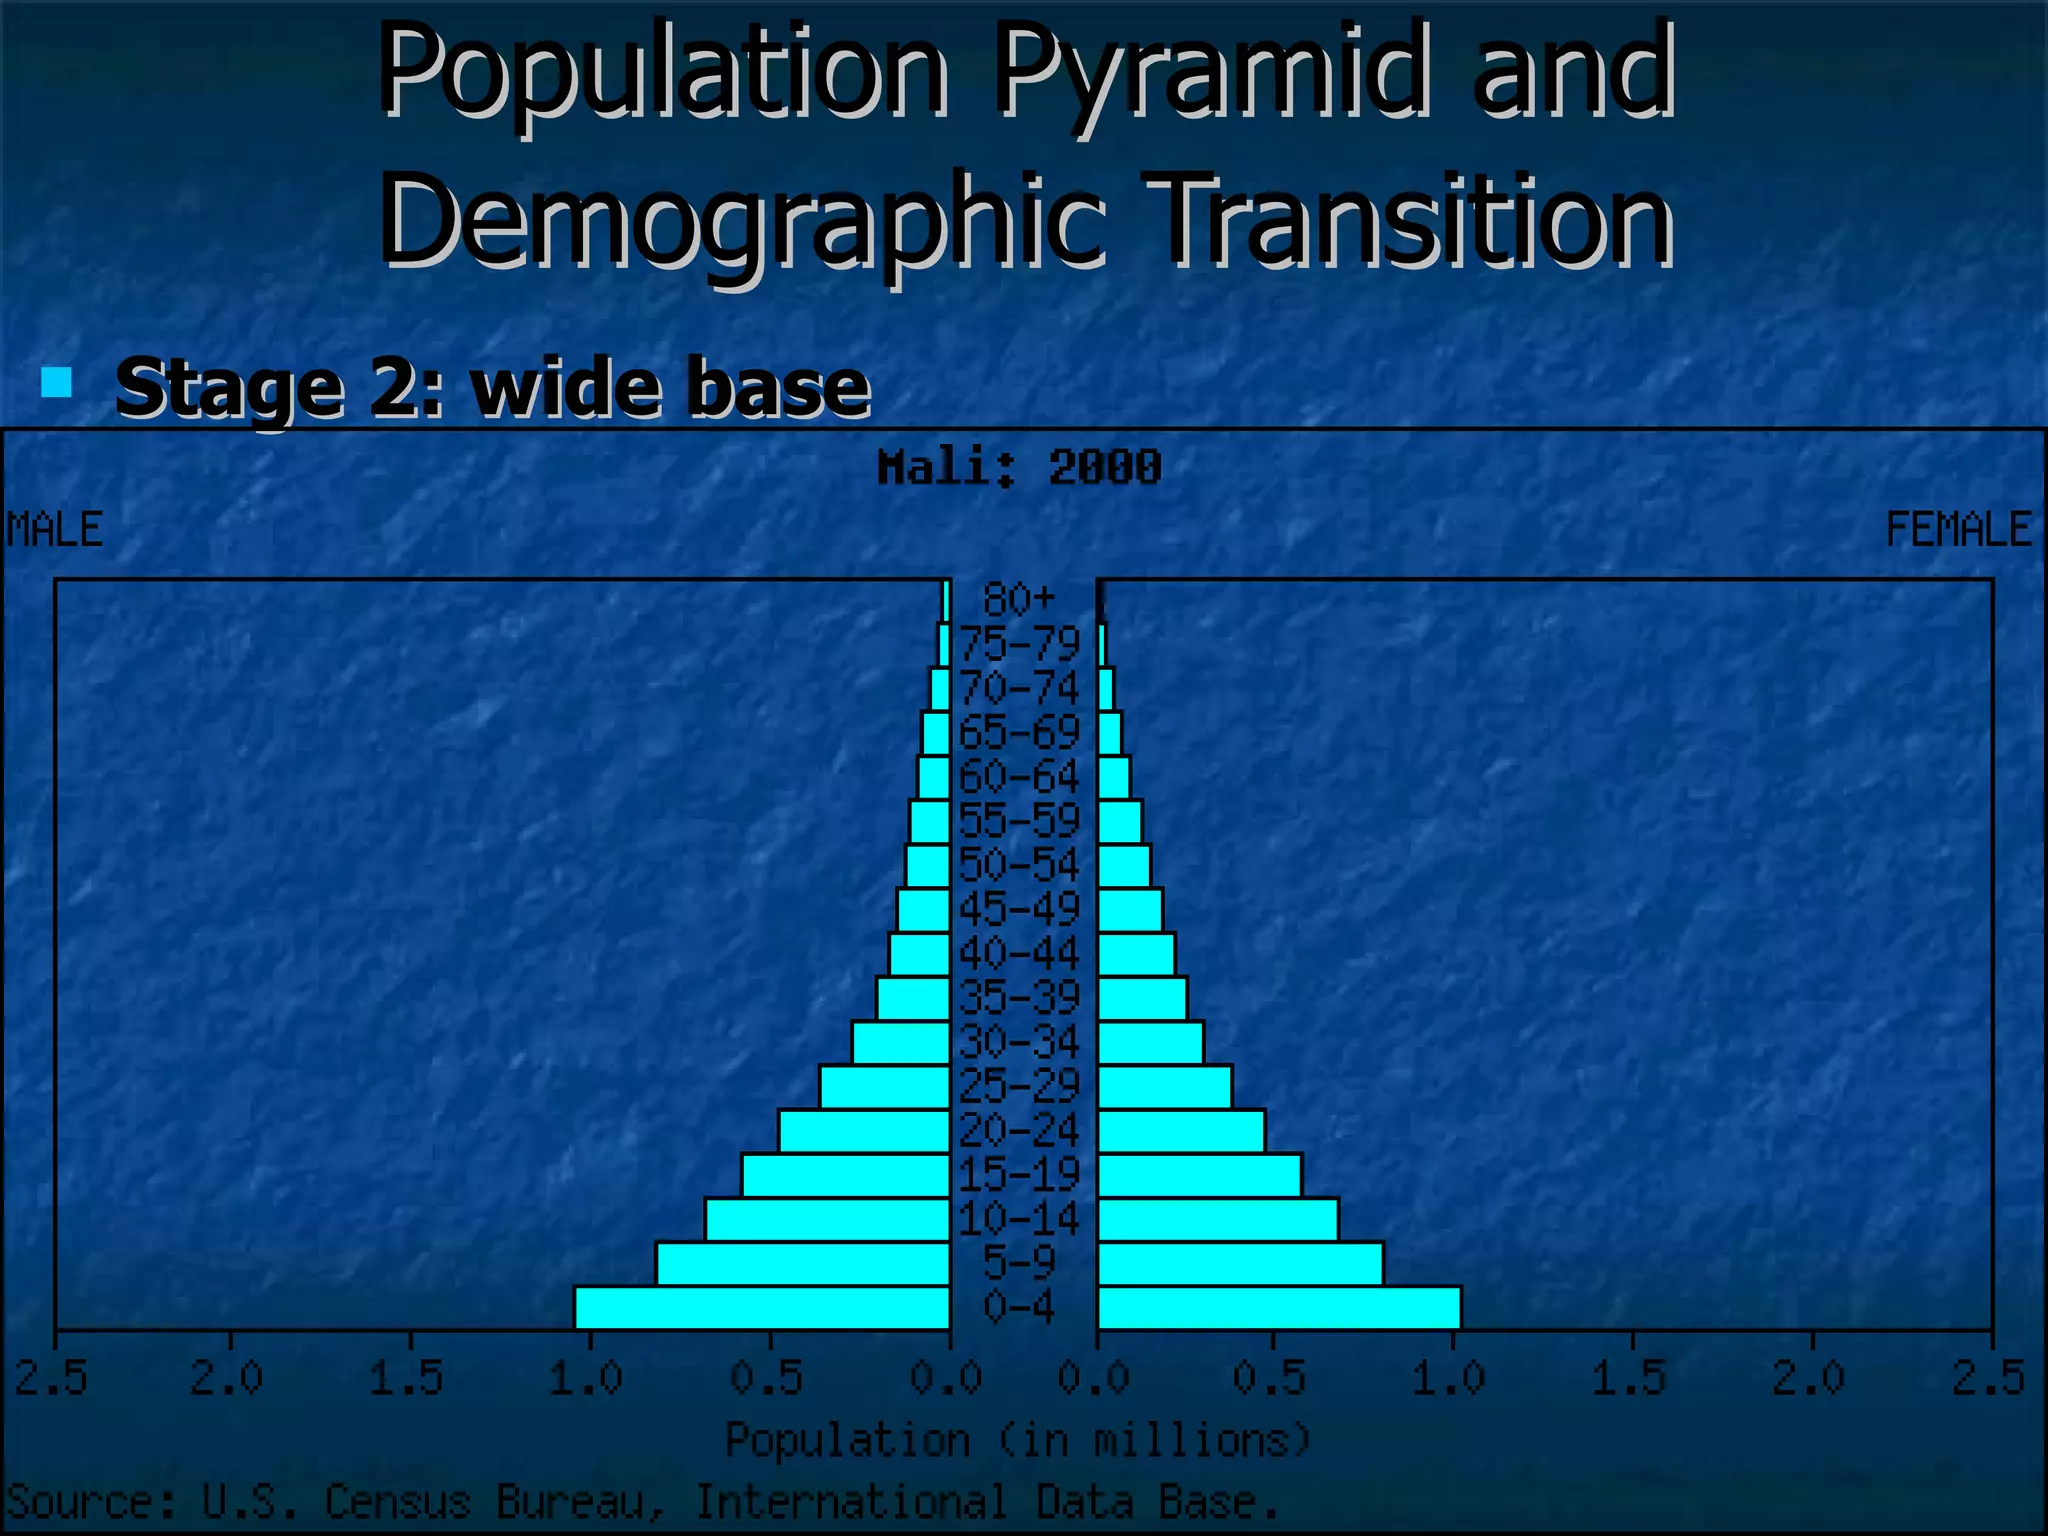
Stage 2 highbirth rates, declining death rates, rising growth rates improvements in sanitation (water) and medicine in Europe during Industrial Revolution in developing countries since the 50s/60s much of Africa today, some countries of Asia (Afghanistan, Nepal, etc.)
26.
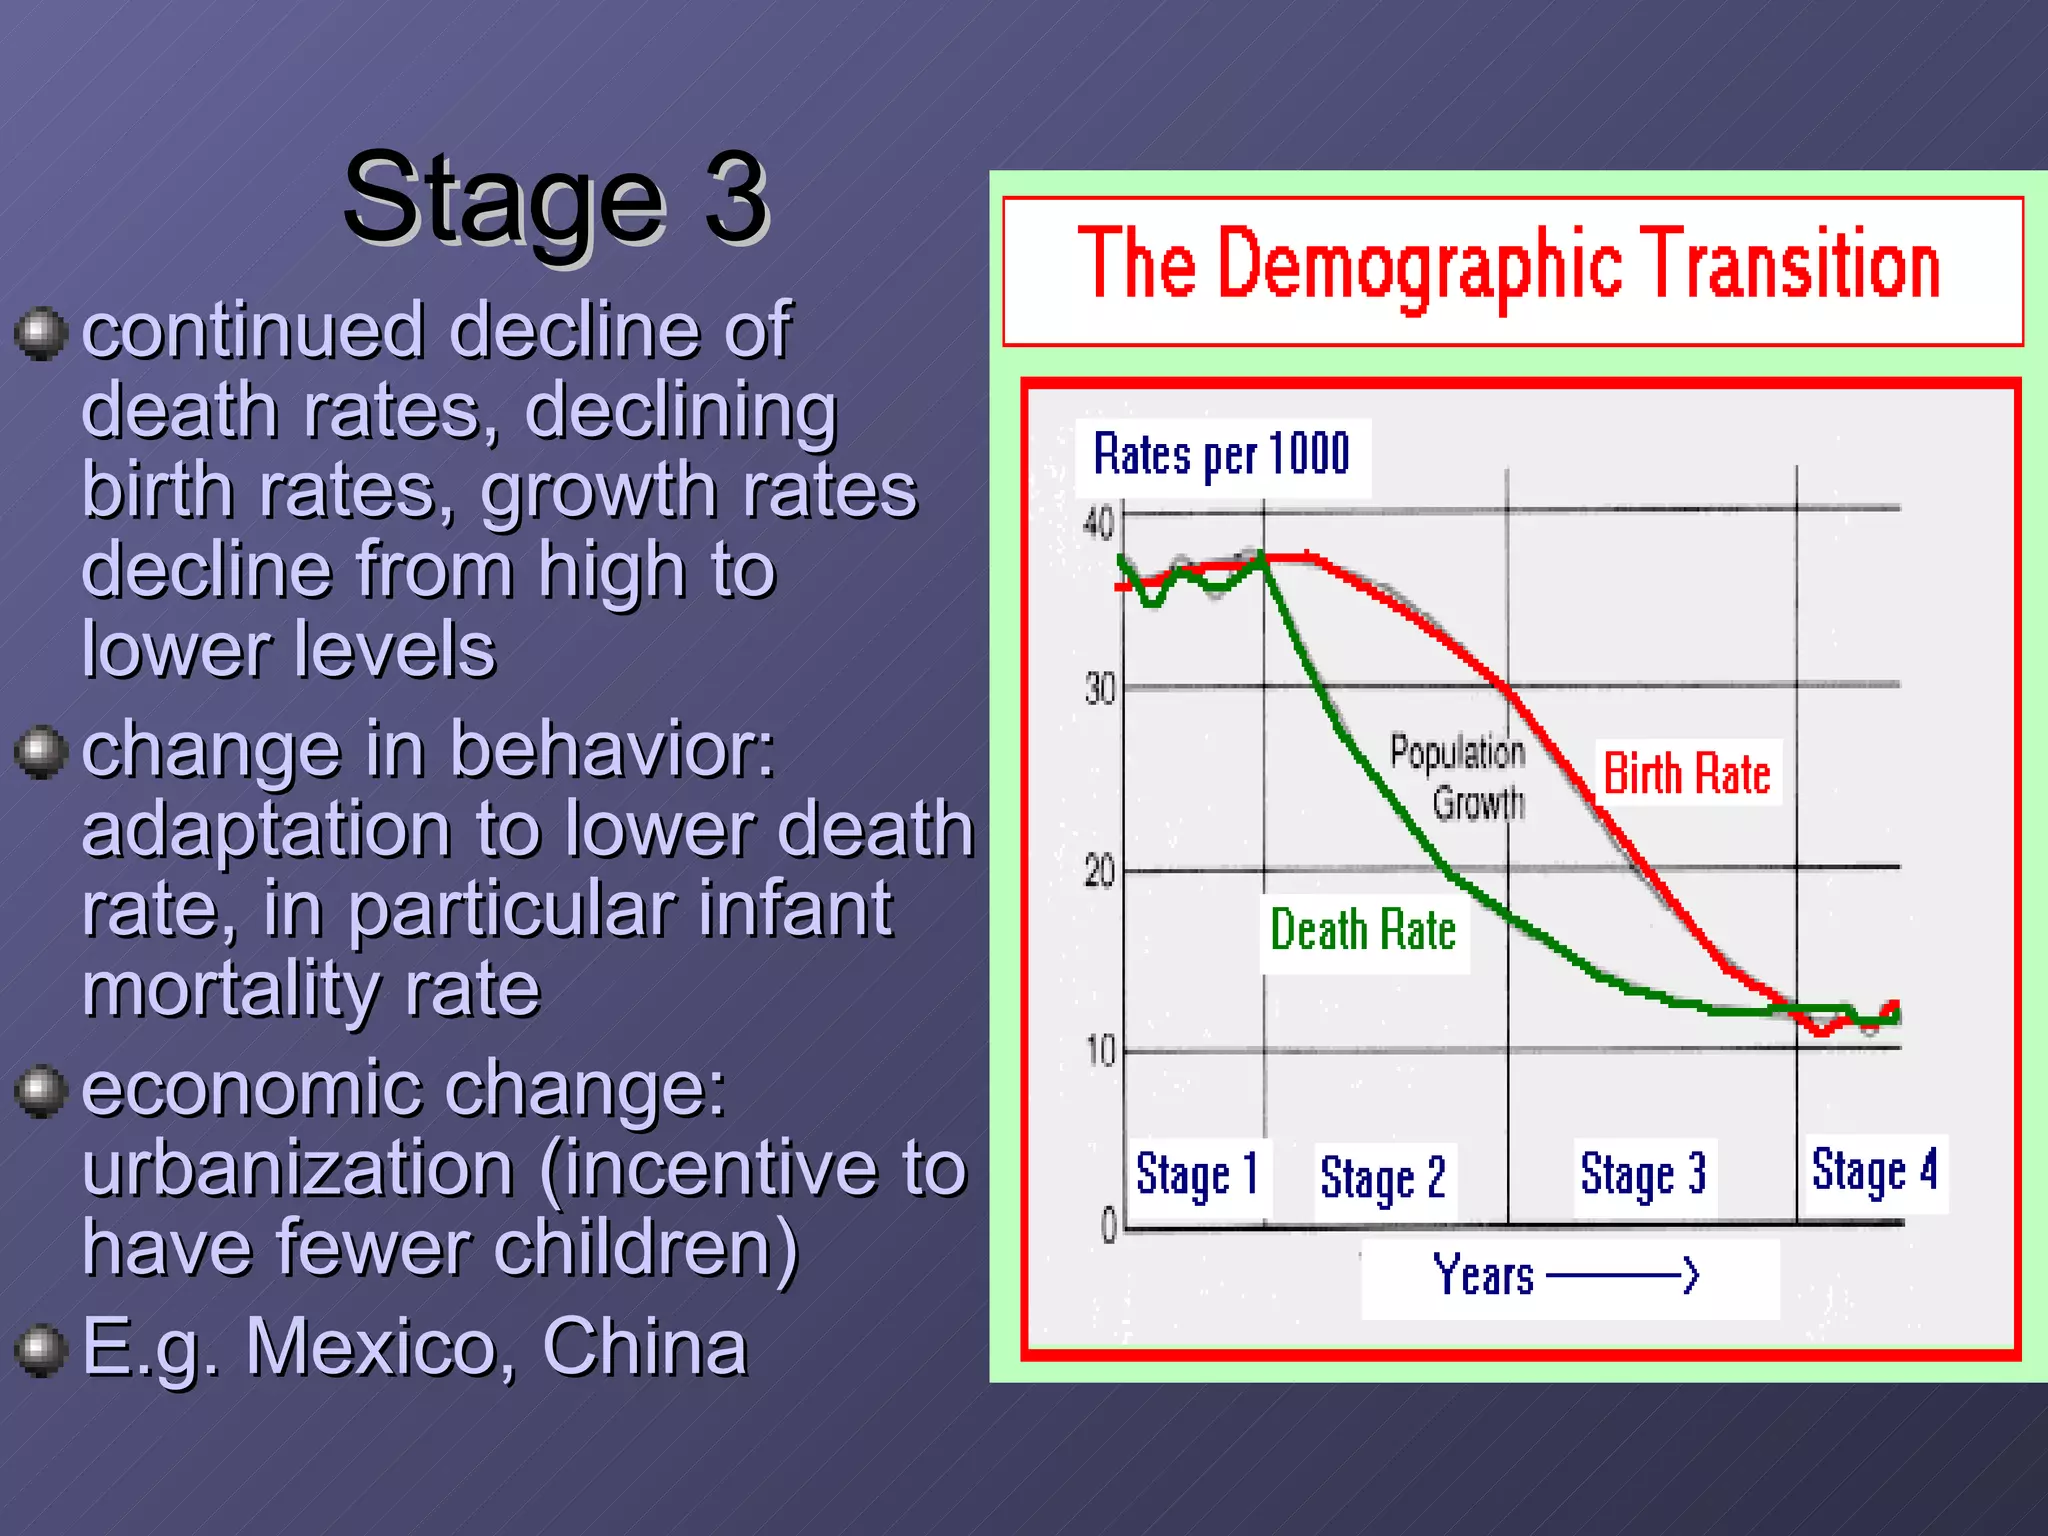
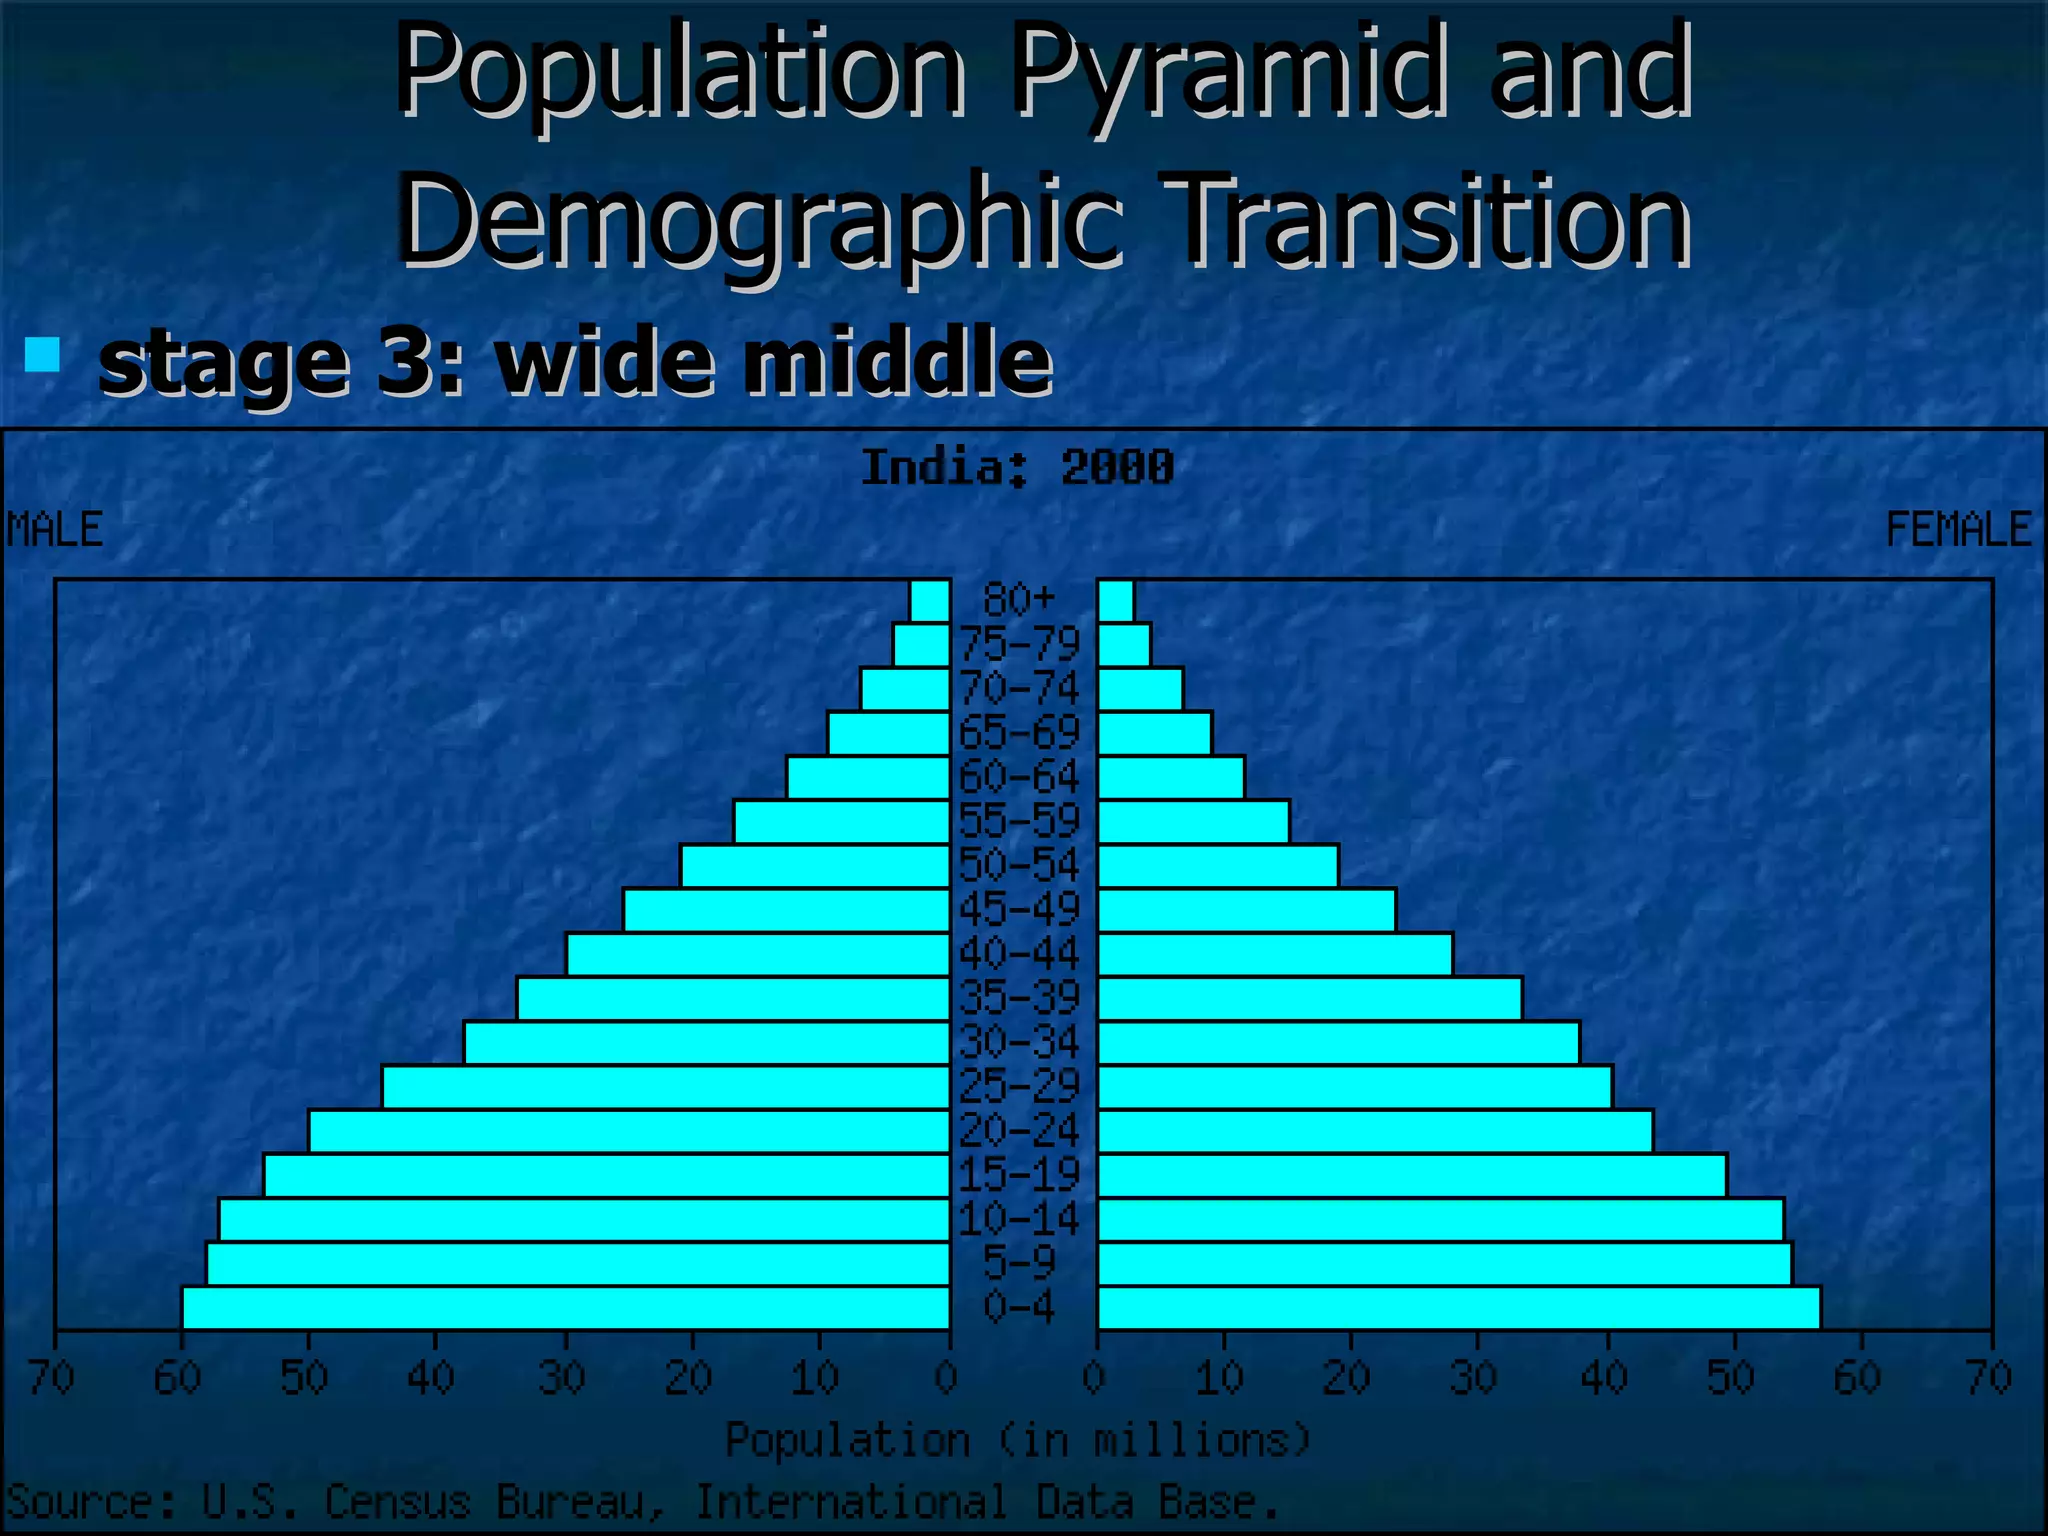
Stage 3 continueddecline of death rates, declining birth rates, growth rates decline from high to lower levels change in behavior: adaptation to lower death rate, in particular infant mortality rate economic change: urbanization (incentive to have fewer children) E.g. Mexico, China
27.
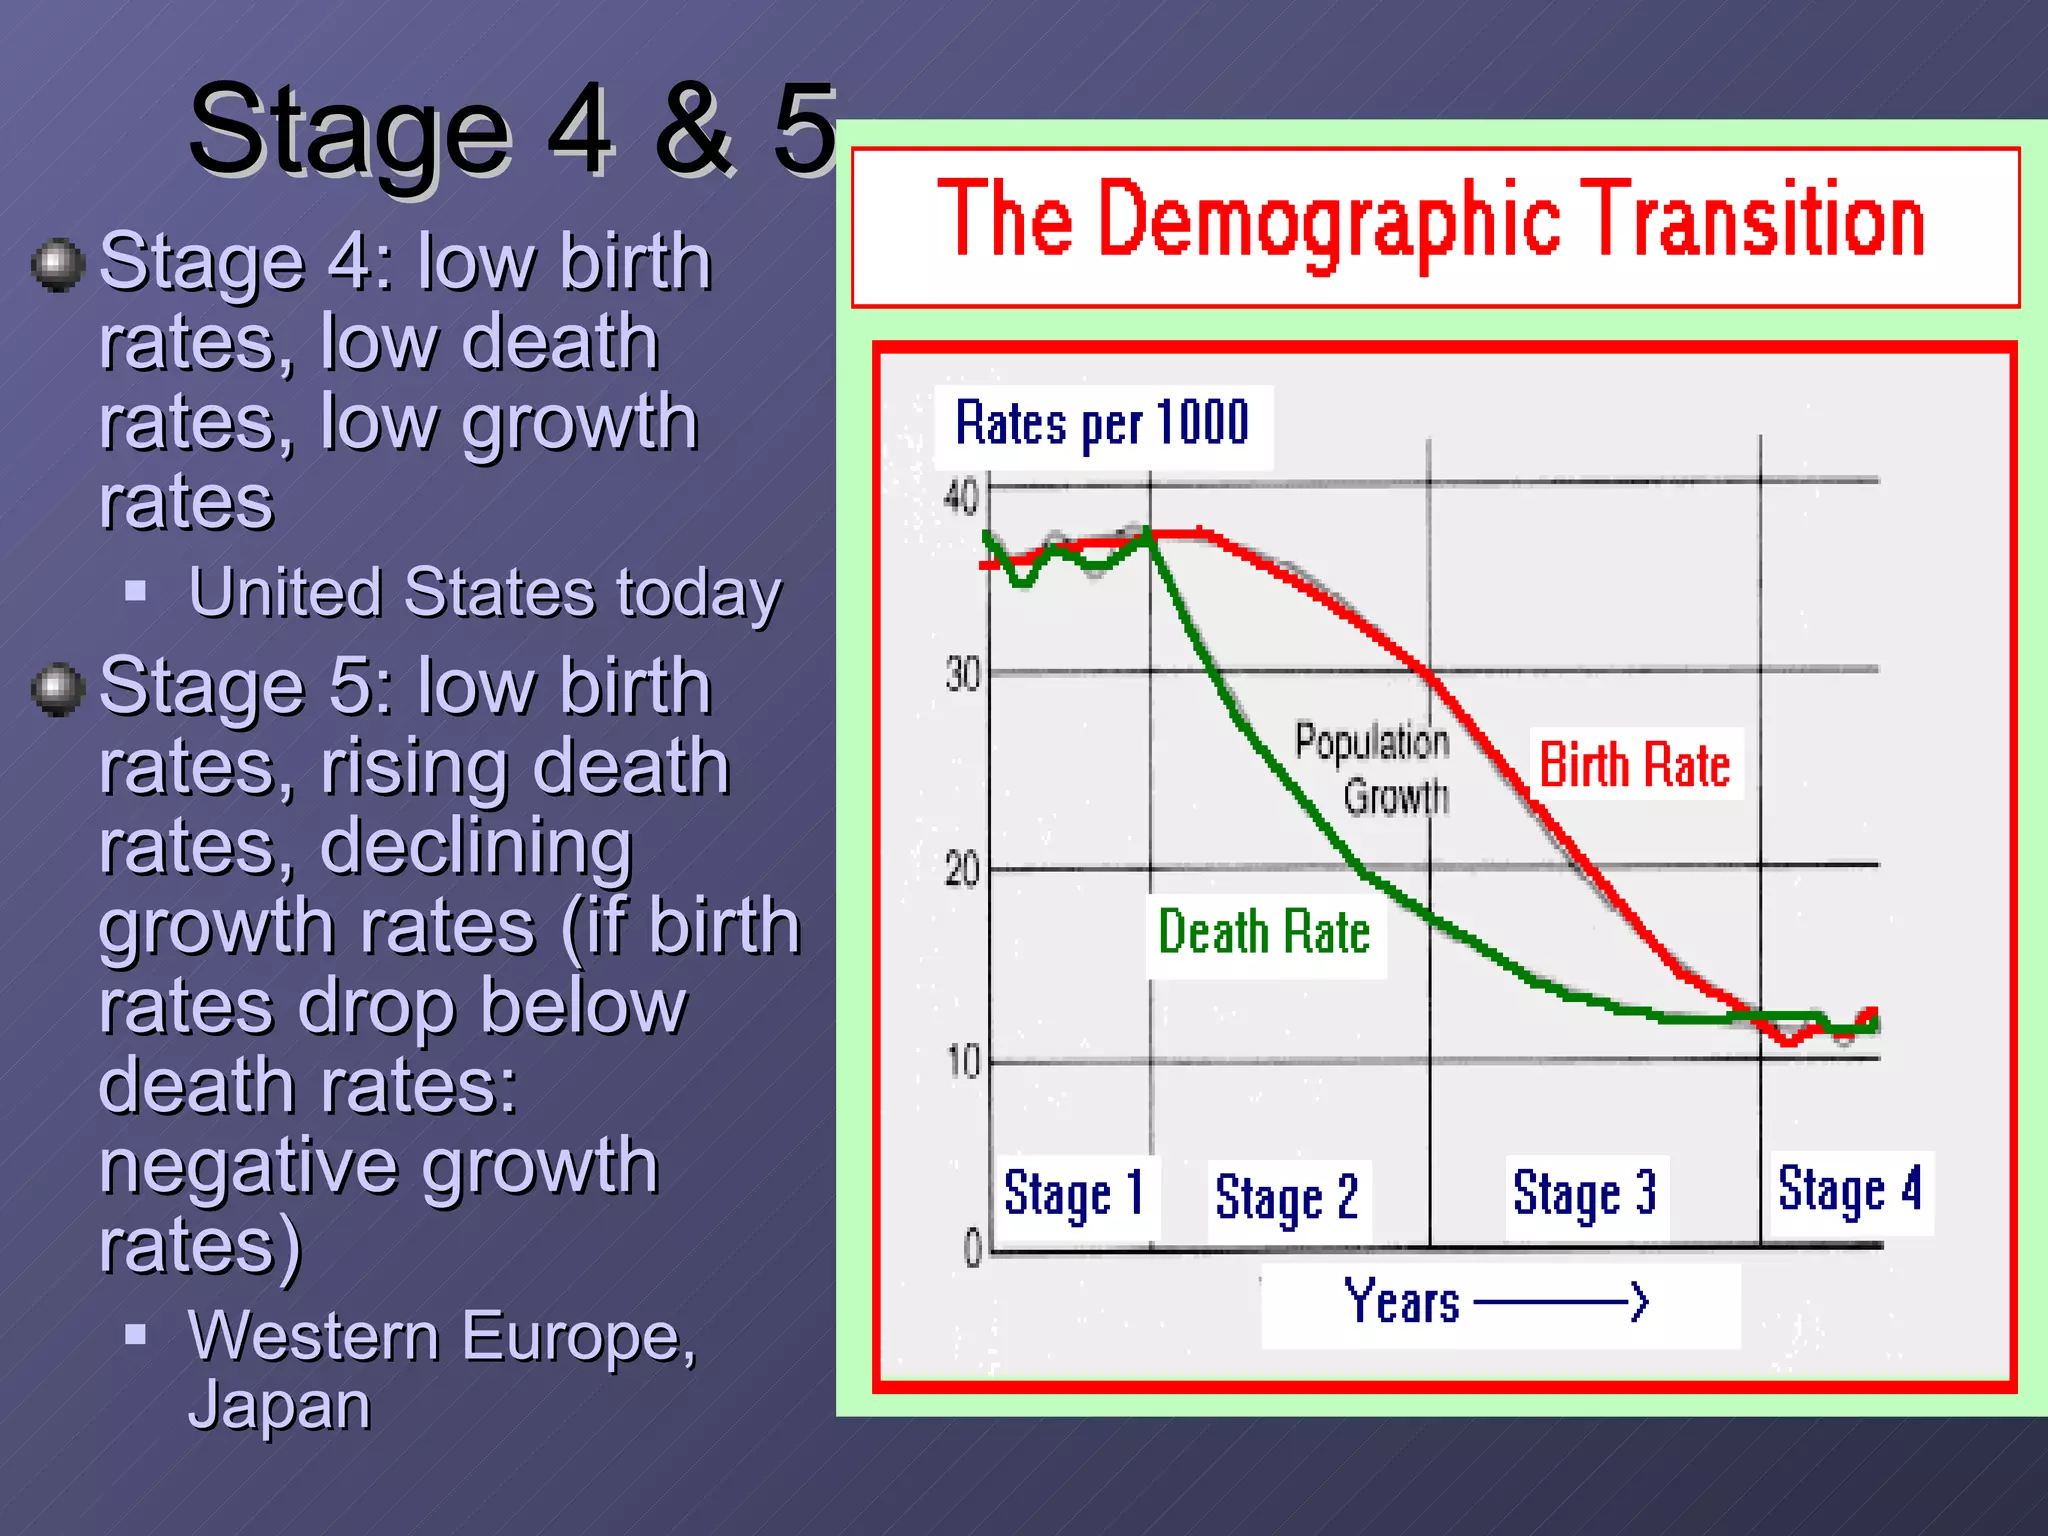
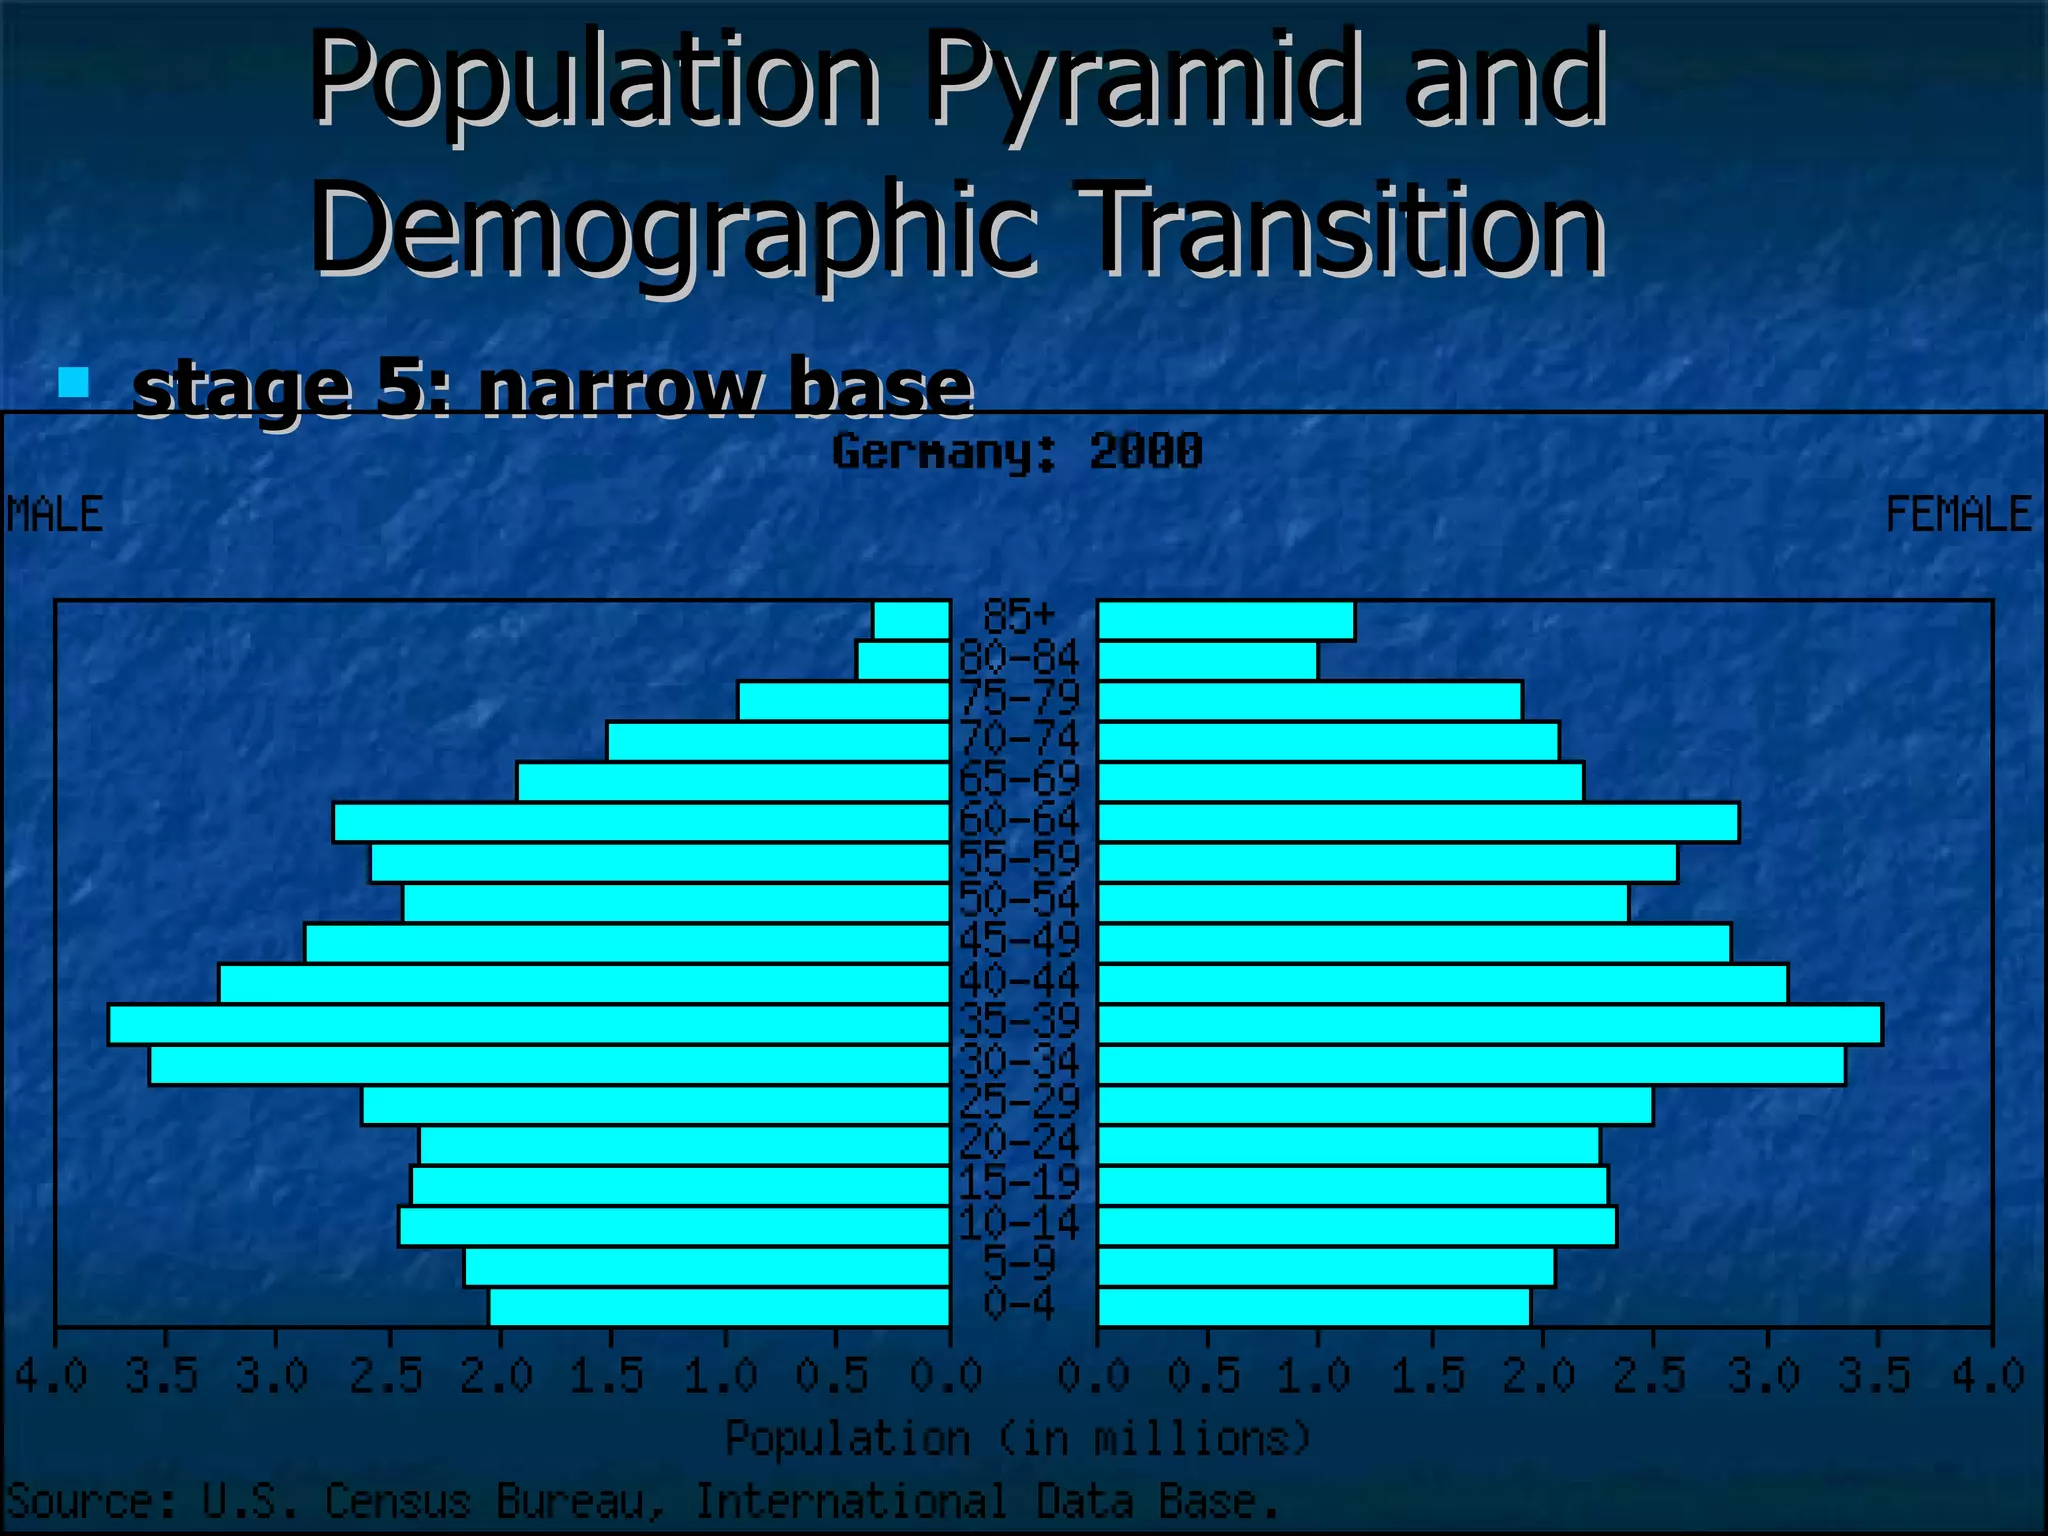
Stage 4 &5 Stage 4: low birth rates, low death rates, low growth rates United States today Stage 5: low birth rates, rising death rates, declining growth rates (if birth rates drop below death rates: negative growth rates) Western Europe, Japan
Population Pyramids andDemographic Stages characteristics shapes of ‘pyramids’ wide base (true pyramid) wide middle (bulge), somewhat wider base urn- or bottle-shaped reversed pyramid different shapes--different dynamics
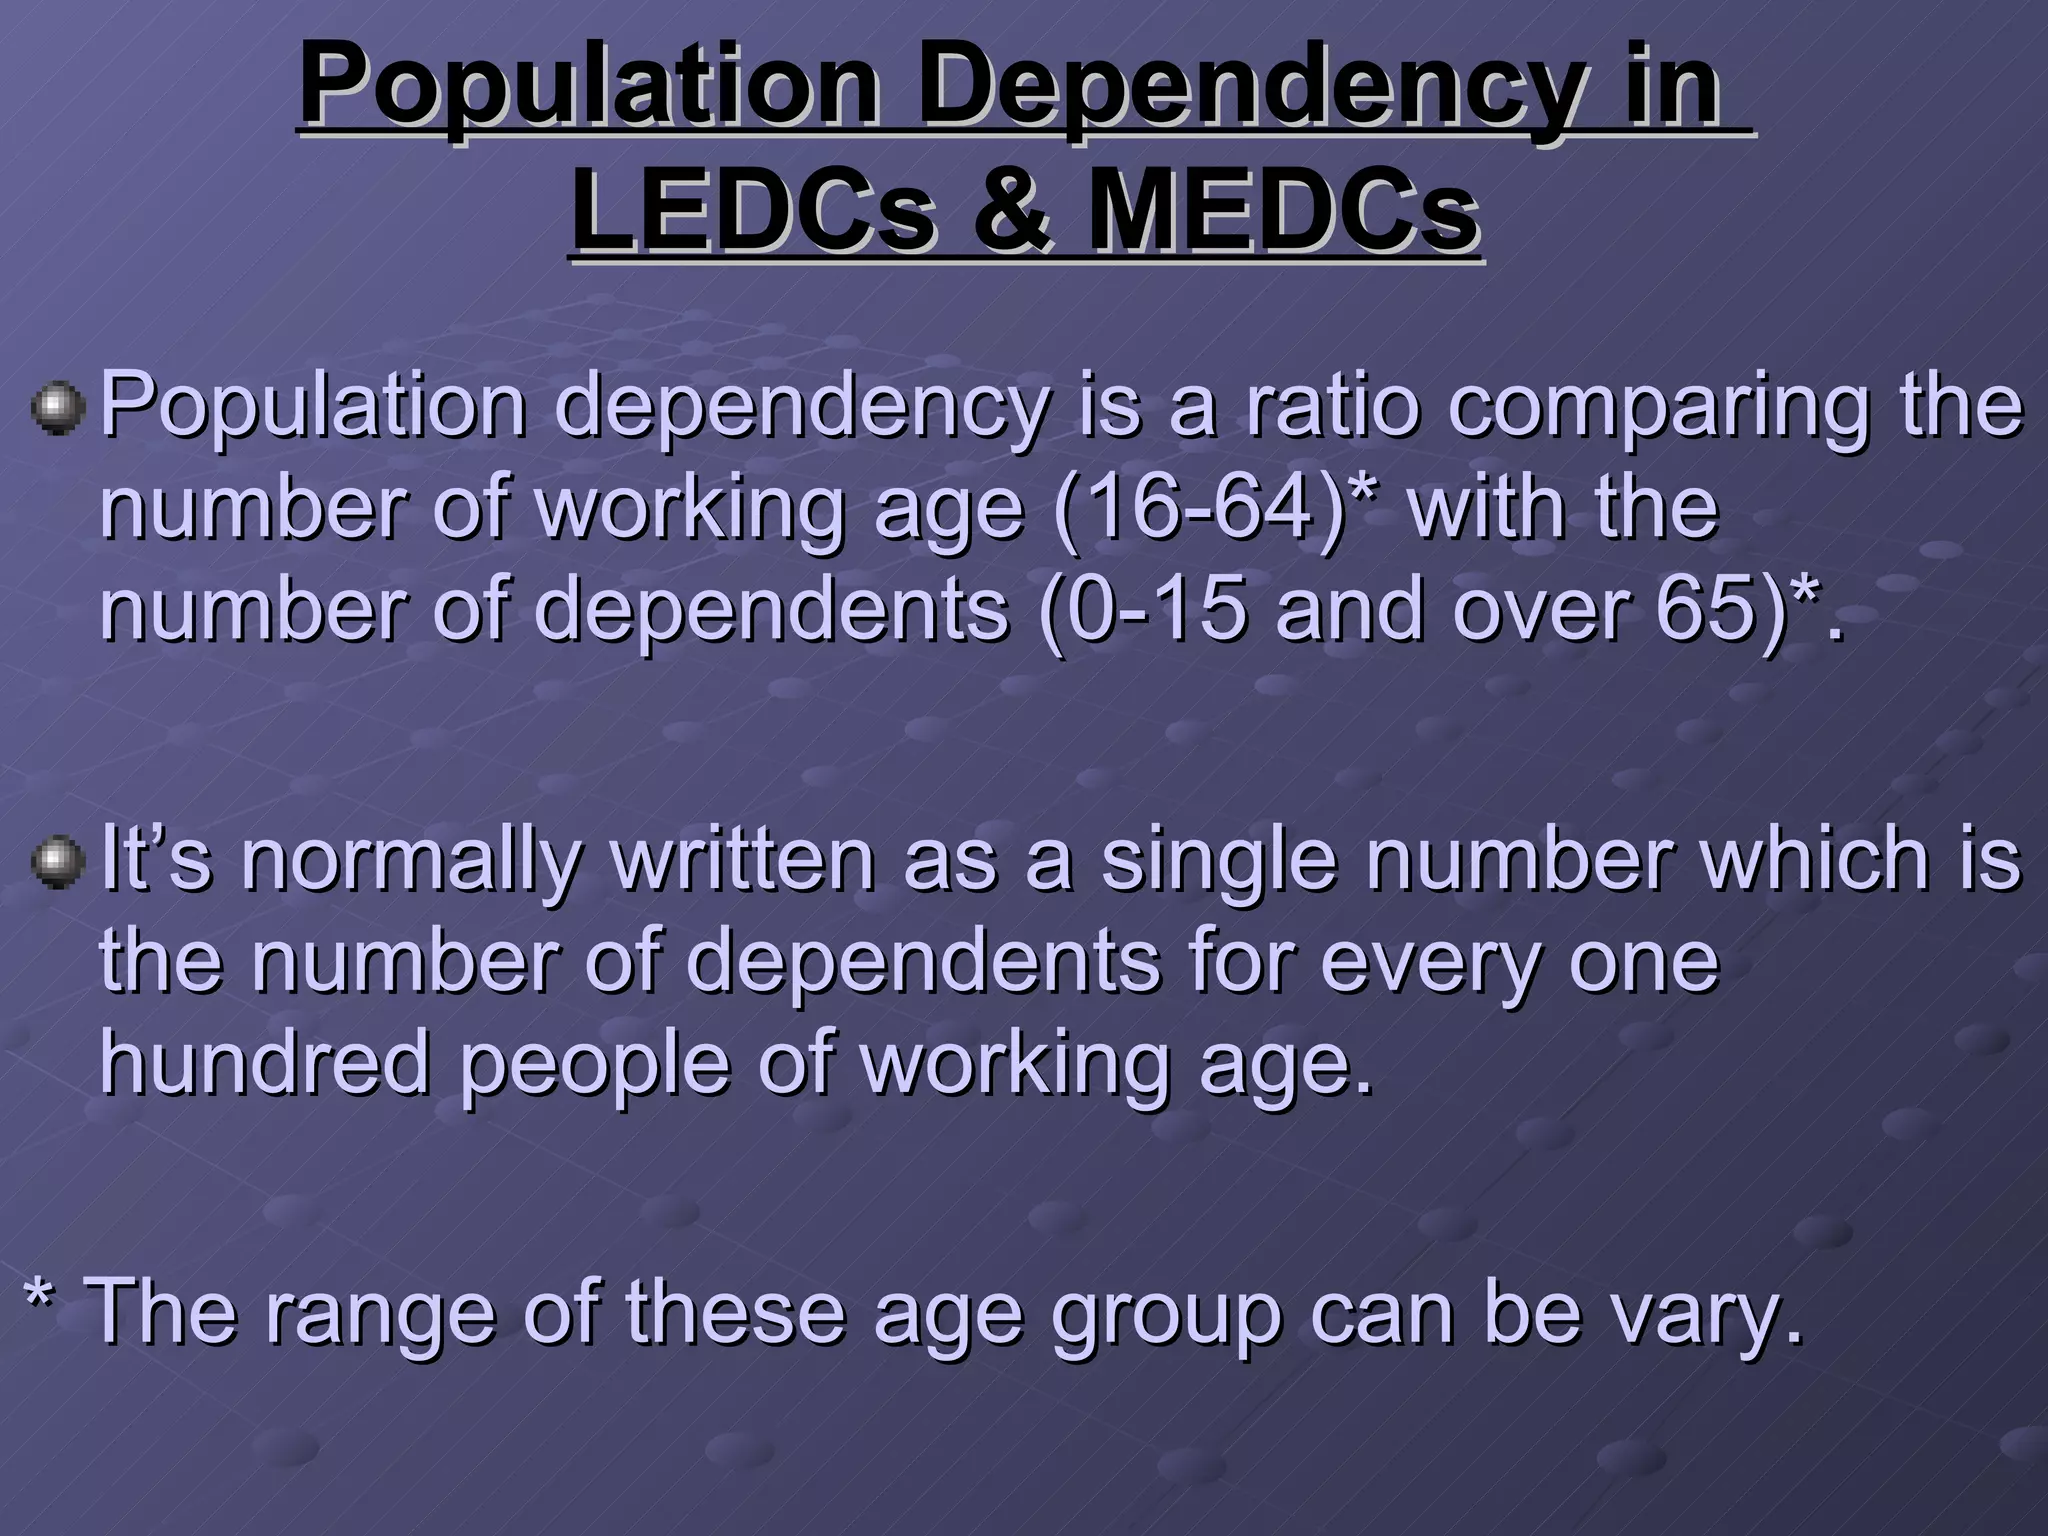
Population Dependency in LEDCs & MEDCs Population dependency is a ratio comparing the number of working age (16-64)* with the number of dependents (0-15 and over 65)*. It’s normally written as a single number which is the number of dependents for every one hundred people of working age. * The range of these age group can be vary.
35.
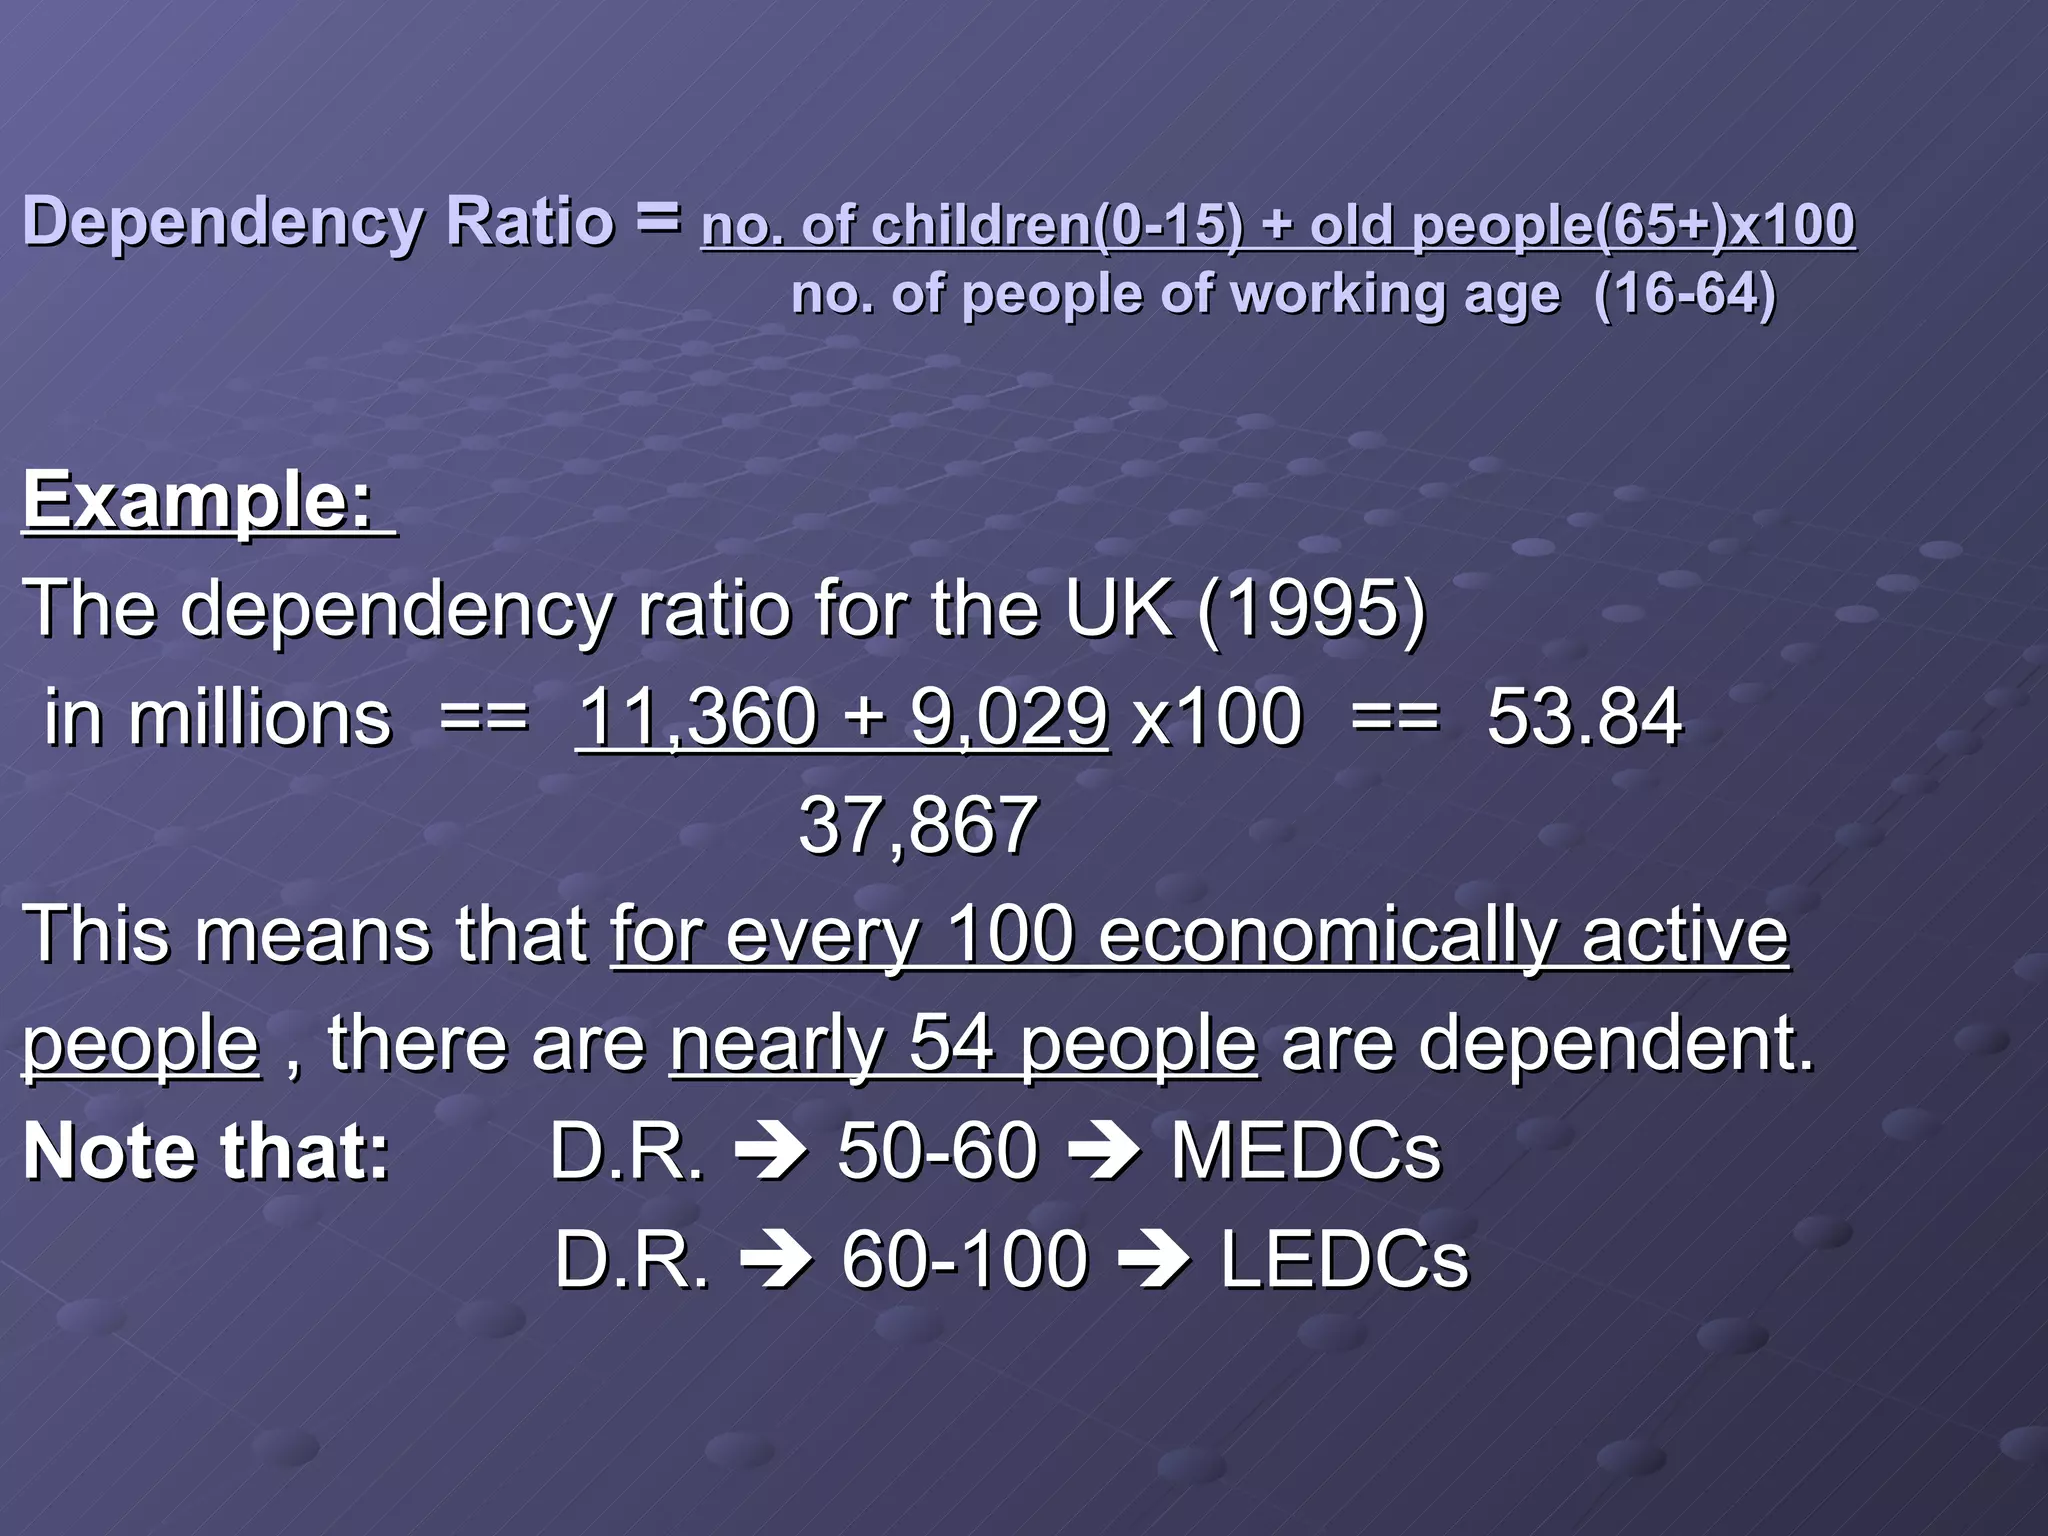
Dependency Ratio = no. of children(0-15) + old people(65+)x100 no. of people of working age (16-64) Example: The dependency ratio for the UK (1995) in millions == 11,360 + 9,029 x100 == 53.84 37,867 This means that for every 100 economically active people , there are nearly 54 people are dependent. Note that: D.R. 50-60 MEDCs D.R. 60-100 LEDCs
36.
37.
use: International DataBase http:// www.census.gov/ipc/www/idbnew.html , then Online Demographic Aggregation
38.
Frequency of VitalEvents: The Population Clock Population Clock http://www.census.gov/main/www/popclock.html Vital Events (per time unit) http://www.census.gov/cgi-bin/ipc/pcwe The global population reached 6 billion in fall of 1999