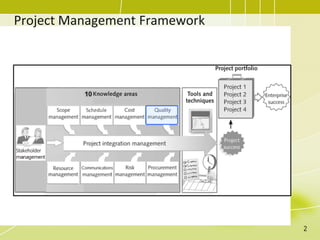
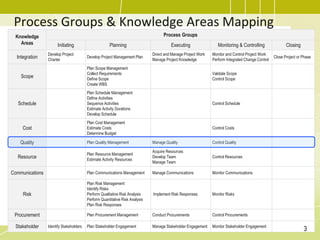
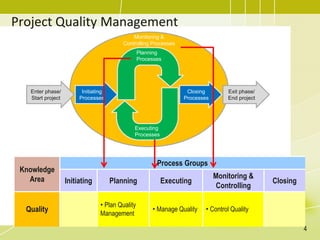
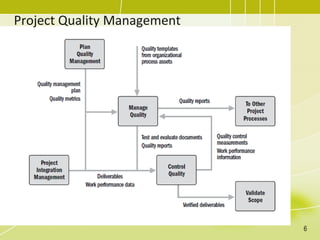
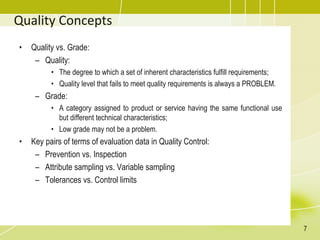
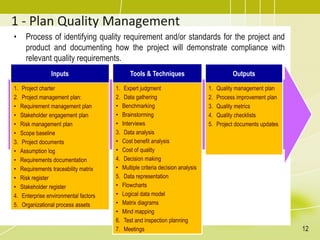
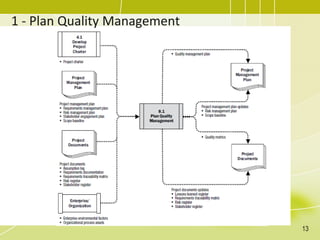
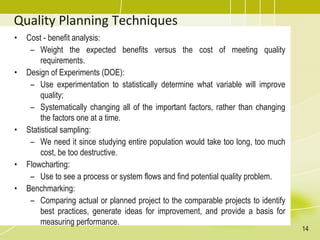
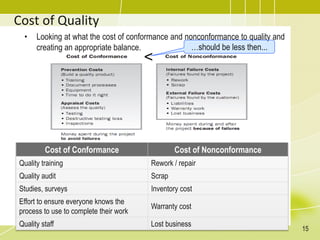
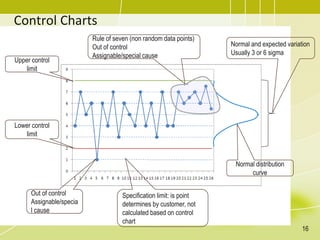
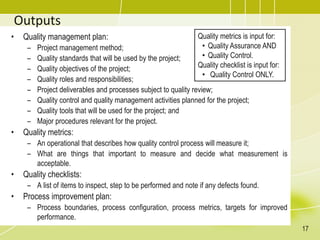
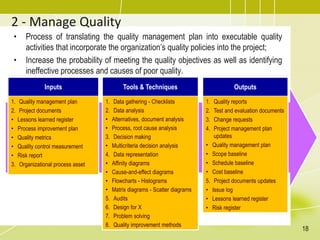
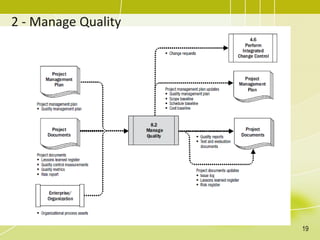
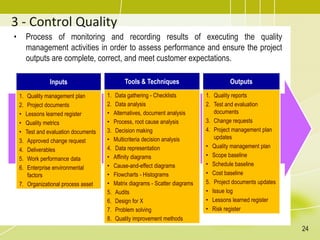
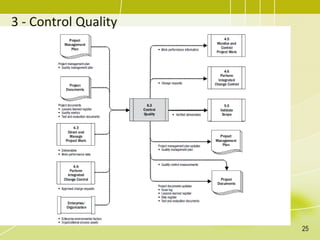
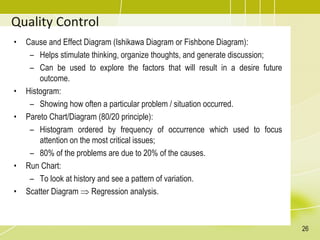
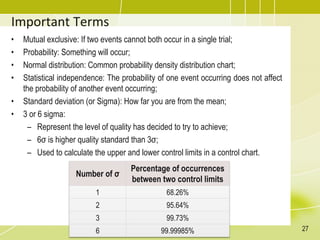
Project Quality Management
Dr. Huy Nguyen
Project Management Framework
2
Process Groups & Knowledge Areas Mapping
Knowledge
Areas
Process Groups
Initiating Planning Executing Monitoring & Controlling Closing
Integration
Develop Project
Charter
Develop Project Management Plan
Direct and Manage Project Work
Manage Project Knowledge
Monitor and Control Project Work
Perform Integrated Change Control
Close Project or Phase
Scope
Plan Scope Management
Collect Requirements
Define Scope
Create WBS
Validate Scope
Control Scope
Schedule
Plan Schedule Management
Define Activities
Sequence Activities
Estimate Activity Durations
Develop Schedule
Control Schedule
Cost
Plan Cost Management
Estimate Costs
Determine Budget
Control Costs
Quality Plan Quality Management Manage Quality Control Quality
Resource
Plan Resource Management
Estimate Activity Resources
Acquire Resources
Develop Team
Manage Team
Control Resources
Communications Plan Communications Management Manage Communications Monitor Communications
Risk
Plan Risk Management
Identify Risks
Perform Qualitative Risk Analysis
Perform Quantitative Risk Analysis
Plan Risk Responses
Implement Risk Responses Monitor Risks
Procurement Plan Procurement Management Conduct Procurements Control Procurements
Stakeholder Identify Stakeholders Plan Stakeholder Engagement Manage Stakeholder Engagement Monitor Stakeholder Engagement
3
Project Quality Management
Knowledge
Area
Process Groups
Initiating Planning Executing
Monitoring &
Controlling
Closing
Quality
• Plan Quality
Management
• Manage Quality • Control Quality
Enter phase/
Start project
Exit phase/
End project
Initiating
Processes
Closing
Processes
Planning
Processes
Executing
Processes
Monitoring &
Controlling Processes
4
Project Quality Management
• Quality is degree to which the project fulfills requirements.
• Quality Management includes creating and following policies and procedures
to ensure that a project meet the defined needs (from the customer’s
perspective) and further supporting continuous process improvement
activities.
• Completing project with no deviations from the project requirements.
5
Project Quality Management
6
Quality Concepts
• Quality vs. Grade:
– Quality:
• The degree to which a set of inherent characteristics fulfill requirements;
• Quality level that fails to meet quality requirements is always a PROBLEM.
– Grade:
• A category assigned to product or service having the same functional use
but different technical characteristics;
• Low grade may not be a problem.
• Key pairs of terms of evaluation data in Quality Control:
– Prevention vs. Inspection
– Attribute sampling vs. Variable sampling
– Tolerances vs. Control limits
7
Quality Management: Important points
• Customer satisfaction:
– Conformance to requirement: Project produces what it was created to
produce;
– Fitness for use: Product/service produced must satisfy real needs.
• Prevention over inspection:
– Cost of preventing mistakes is much less than cost of correcting.
• Continuous improvement (Kaizen):
– Based on PDCA cycle;
– Using quality improvement initiatives e.g. TQM, 6 sigma;
– Using process improvement models e.g. OPM3, CMMI, Malcolm Baldrige.
• Management responsibility:
– To provide the resource needed to succeed.
• Mutually beneficial partnership with suppliers:
– To enhance the ability for both the organization and the suppliers to create
value for each other, enhances the joint responses to customer needs and
expectations, and optimizes costs and resources.
8
Quality Management: 5 levels
• Level 1: The most expensive approach is to let the customer find the defects.
This approach can lead to warranty issues, recalls, loss of reputation, and
rework costs.
• Level 2: Detect and correct the defects before the deliverables are sent to
the customer as part of the quality control process. The control quality
process has related costs, which are mainly the appraisal costs and internal
failure costs.
• Level 3: Use quality assurance to examine and correct the process itself and
not just special defects.
• Level 4: Incorporate quality into the planning and designing of the project
and product.
• Level 5: Create a culture throughout the organization that is aware and
committed to quality in processes and products.
9
Quality Concepts
• Gold Plating:
– Giving the customer extras;
– This practice is not recommended.
• Marginal Analysis:
– Looking for the point where benefits/revenue to be received from
improving quality EQUALS the incremental cost to achieve that quality.
• Just in Time (JIT):
– Just when they are needed or just before they are needed;
– It forces attention on quality practices.
• Total Quality Management (TQM):
– Company & their employees focus on finding ways to continuous improve
the quality of their business practices & products.
10
Quality Concepts
11
1 - Plan Quality Management
• Process of identifying quality requirement and/or standards for the project and
product and documenting how the project will demonstrate compliance with
relevant quality requirements.
Inputs
1. Project charter
2. Project management plan:
• Requirement management plan
• Stakeholder engagement plan
• Risk management plan
• Scope baseline
3. Project documents
• Assumption log
• Requirements documentation
• Requirements traceability matrix
• Risk register
• Stakeholder register
4. Enterprise environmental factors
5. Organizational process assets
Tools & Techniques
1. Expert judgment
2. Data gathering
• Benchmarking
• Brainstorming
• Interviews
3. Data analysis
• Cost benefit analysis
• Cost of quality
4. Decision making
• Multiple criteria decision analysis
5. Data representation
• Flowcharts
• Logical data model
• Matrix diagrams
• Mind mapping
6. Test and inspection planning
7. Meetings
Outputs
1. Quality management plan
2. Process improvement plan
3. Quality metrics
4. Quality checklists
5. Project documents updates
12
1 - Plan Quality Management
13
Quality Planning Techniques
• Cost - benefit analysis:
– Weight the expected benefits versus the cost of meeting quality
requirements.
• Design of Experiments (DOE):
– Use experimentation to statistically determine what variable will improve
quality;
– Systematically changing all of the important factors, rather than changing
the factors one at a time.
• Statistical sampling:
– We need it since studying entire population would take too long, too much
cost, be too destructive.
• Flowcharting:
– Use to see a process or system flows and find potential quality problem.
• Benchmarking:
– Comparing actual or planned project to the comparable projects to identify
best practices, generate ideas for improvement, and provide a basis for
measuring performance.
14
Cost of Quality
• Looking at what the cost of conformance and nonconformance to quality and
creating an appropriate balance.
Cost of Conformance Cost of Nonconformance
Quality training Rework / repair
Quality audit Scrap
Studies, surveys Inventory cost
Effort to ensure everyone knows the
process to use to complete their work
Warranty cost
Quality staff Lost business
…should be less then...
<
15
Control Charts
Upper control
limit
Lower control
limit
Out of control
Assignable/specia
l cause
Specification limit: is point
determines by customer, not
calculated based on control
chart
Normal and expected variation
Usually 3 or 6 sigma
Rule of seven (non random data points)
Out of control
Assignable/special cause
Normal distribution
curve
16
Outputs
• Quality management plan:
– Project management method;
– Quality standards that will be used by the project;
– Quality objectives of the project;
– Quality roles and responsibilities;
– Project deliverables and processes subject to quality review;
– Quality control and quality management activities planned for the project;
– Quality tools that will be used for the project; and
– Major procedures relevant for the project.
• Quality metrics:
– An operational that describes how quality control process will measure it;
– What are things that important to measure and decide what measurement is
acceptable.
• Quality checklists:
– A list of items to inspect, step to be performed and note if any defects found.
• Process improvement plan:
– Process boundaries, process configuration, process metrics, targets for improved
performance.
Quality metrics is input for:
• Quality Assurance AND
• Quality Control.
Quality checklist is input for:
• Quality Control ONLY.
17
2 - Manage Quality
• Process of translating the quality management plan into executable quality
activities that incorporate the organization’s quality policies into the project;
• Increase the probability of meeting the quality objectives as well as identifying
ineffective processes and causes of poor quality.
Inputs
1. Quality management plan
2. Project documents
• Lessons learned register
• Process improvement plan
• Quality metrics
• Quality control measurement
• Risk report
3. Organizational process asset
Tools & Techniques
1. Data gathering - Checklists
2. Data analysis
• Alternatives, document analysis
• Process, root cause analysis
3. Decision making
• Multicriteria decision analysis
4. Data representation
• Affinity diagrams
• Cause-and-effect diagrams
• Flowcharts - Histograms
• Matrix diagrams - Scatter diagrams
5. Audits
6. Design for X
7. Problem solving
8. Quality improvement methods
Outputs
1. Quality reports
2. Test and evaluation documents
3. Change requests
4. Project management plan
updates
• Quality management plan
• Scope baseline
• Schedule baseline
• Cost baseline
5. Project documents updates
• Issue log
• Lessons learned register
• Risk register
18
2 - Manage Quality
19
Manage Quality
• Design an optimal and mature product by implementing specific design
guidelines that address specific aspects of the product;
• Build confidence that a future output will be completed in a manner that meets
the specified requirements and expectations through quality assurance tools
and techniques such as quality audits and failure analysis;
• Confirm that the quality processes are used and that their use meets the
quality objectives of the project; and
• Improve the efficiency and effectiveness of processes and activities to achieve
better results and performance and enhance stakeholders’ satisfaction.
20
Quality Assurance
• Are we using the standard?
• Can we improve the standard?
• Quality audits:
– Identifying all good and best practices being implemented;
– Identifying all nonconformity, gaps, and shortcomings;
– Sharing good practices introduced or implemented in similar projects in
the organization and/or industry;
– Proactively offering assistance in a positive manner to improve the
implementation of processes to help raise team productivity; and
– Highlighting contributions of each audit in the lessons learned repository
of the organization.
• Process analysis:
– Includes root cause analysis.
21
Manage Quality (Tools and Techniques)
22
• Cause-and-Effect Diagram:
Manage Quality (Tools and Techniques)
23
• Problem Solving:
– Defining the problem;
– Identifying the root-cause;
– Generating possible solutions;
– Choosing the best solution;
– Implementing the solution; and
– Verifying solution effectiveness.
3 - Control Quality
• Process of monitoring and recording results of executing the quality
management activities in order to assess performance and ensure the project
outputs are complete, correct, and meet customer expectations.
Inputs
1. Quality management plan
2. Project documents
• Lessons learned register
• Quality metrics
• Test and evaluation documents
3. Approved change request
4. Deliverables
5. Work performance data
6. Enterprise environmental
factors
7. Organizational process asset
Tools & Techniques
1. Data gathering - Checklists
2. Data analysis
• Alternatives, document analysis
• Process, root cause analysis
3. Decision making
• Multicriteria decision analysis
4. Data representation
• Affinity diagrams
• Cause-and-effect diagrams
• Flowcharts - Histograms
• Matrix diagrams - Scatter diagrams
5. Audits
6. Design for X
7. Problem solving
8. Quality improvement methods
Outputs
1. Quality reports
2. Test and evaluation
documents
3. Change requests
4. Project management plan
updates
• Quality management plan
• Scope baseline
• Schedule baseline
• Cost baseline
5. Project documents updates
• Issue log
• Lessons learned register
• Risk register
24
3 - Control Quality
25
Quality Control
• Cause and Effect Diagram (Ishikawa Diagram or Fishbone Diagram):
– Helps stimulate thinking, organize thoughts, and generate discussion;
– Can be used to explore the factors that will result in a desire future
outcome.
• Histogram:
– Showing how often a particular problem / situation occurred.
• Pareto Chart/Diagram (80/20 principle):
– Histogram ordered by frequency of occurrence which used to focus
attention on the most critical issues;
– 80% of the problems are due to 20% of the causes.
• Run Chart:
– To look at history and see a pattern of variation.
• Scatter Diagram  Regression analysis.
26
Important Terms
• Mutual exclusive: If two events cannot both occur in a single trial;
• Probability: Something will occur;
• Normal distribution: Common probability density distribution chart;
• Statistical independence: The probability of one event occurring does not affect
the probability of another event occurring;
• Standard deviation (or Sigma): How far you are from the mean;
• 3 or 6 sigma:
– Represent the level of quality has decided to try to achieve;
– 6σ is higher quality standard than 3σ;
– Used to calculate the upper and lower control limits in a control chart.
Number of σ
Percentage of occurrences
between two control limits
1 68.26%
2 95.64%
3 99.73%
6 99.99985% 27
Thank You
Next topic:
Project Stakeholder Management
28

Topic 8 - Project Quality Management.pdf

  • 1.
  • 2.
  • 3.
    Process Groups &Knowledge Areas Mapping Knowledge Areas Process Groups Initiating Planning Executing Monitoring & Controlling Closing Integration Develop Project Charter Develop Project Management Plan Direct and Manage Project Work Manage Project Knowledge Monitor and Control Project Work Perform Integrated Change Control Close Project or Phase Scope Plan Scope Management Collect Requirements Define Scope Create WBS Validate Scope Control Scope Schedule Plan Schedule Management Define Activities Sequence Activities Estimate Activity Durations Develop Schedule Control Schedule Cost Plan Cost Management Estimate Costs Determine Budget Control Costs Quality Plan Quality Management Manage Quality Control Quality Resource Plan Resource Management Estimate Activity Resources Acquire Resources Develop Team Manage Team Control Resources Communications Plan Communications Management Manage Communications Monitor Communications Risk Plan Risk Management Identify Risks Perform Qualitative Risk Analysis Perform Quantitative Risk Analysis Plan Risk Responses Implement Risk Responses Monitor Risks Procurement Plan Procurement Management Conduct Procurements Control Procurements Stakeholder Identify Stakeholders Plan Stakeholder Engagement Manage Stakeholder Engagement Monitor Stakeholder Engagement 3
  • 4.
    Project Quality Management Knowledge Area ProcessGroups Initiating Planning Executing Monitoring & Controlling Closing Quality • Plan Quality Management • Manage Quality • Control Quality Enter phase/ Start project Exit phase/ End project Initiating Processes Closing Processes Planning Processes Executing Processes Monitoring & Controlling Processes 4
  • 5.
    Project Quality Management •Quality is degree to which the project fulfills requirements. • Quality Management includes creating and following policies and procedures to ensure that a project meet the defined needs (from the customer’s perspective) and further supporting continuous process improvement activities. • Completing project with no deviations from the project requirements. 5
  • 6.
  • 7.
    Quality Concepts • Qualityvs. Grade: – Quality: • The degree to which a set of inherent characteristics fulfill requirements; • Quality level that fails to meet quality requirements is always a PROBLEM. – Grade: • A category assigned to product or service having the same functional use but different technical characteristics; • Low grade may not be a problem. • Key pairs of terms of evaluation data in Quality Control: – Prevention vs. Inspection – Attribute sampling vs. Variable sampling – Tolerances vs. Control limits 7
  • 8.
    Quality Management: Importantpoints • Customer satisfaction: – Conformance to requirement: Project produces what it was created to produce; – Fitness for use: Product/service produced must satisfy real needs. • Prevention over inspection: – Cost of preventing mistakes is much less than cost of correcting. • Continuous improvement (Kaizen): – Based on PDCA cycle; – Using quality improvement initiatives e.g. TQM, 6 sigma; – Using process improvement models e.g. OPM3, CMMI, Malcolm Baldrige. • Management responsibility: – To provide the resource needed to succeed. • Mutually beneficial partnership with suppliers: – To enhance the ability for both the organization and the suppliers to create value for each other, enhances the joint responses to customer needs and expectations, and optimizes costs and resources. 8
  • 9.
    Quality Management: 5levels • Level 1: The most expensive approach is to let the customer find the defects. This approach can lead to warranty issues, recalls, loss of reputation, and rework costs. • Level 2: Detect and correct the defects before the deliverables are sent to the customer as part of the quality control process. The control quality process has related costs, which are mainly the appraisal costs and internal failure costs. • Level 3: Use quality assurance to examine and correct the process itself and not just special defects. • Level 4: Incorporate quality into the planning and designing of the project and product. • Level 5: Create a culture throughout the organization that is aware and committed to quality in processes and products. 9
  • 10.
    Quality Concepts • GoldPlating: – Giving the customer extras; – This practice is not recommended. • Marginal Analysis: – Looking for the point where benefits/revenue to be received from improving quality EQUALS the incremental cost to achieve that quality. • Just in Time (JIT): – Just when they are needed or just before they are needed; – It forces attention on quality practices. • Total Quality Management (TQM): – Company & their employees focus on finding ways to continuous improve the quality of their business practices & products. 10
  • 11.
  • 12.
    1 - PlanQuality Management • Process of identifying quality requirement and/or standards for the project and product and documenting how the project will demonstrate compliance with relevant quality requirements. Inputs 1. Project charter 2. Project management plan: • Requirement management plan • Stakeholder engagement plan • Risk management plan • Scope baseline 3. Project documents • Assumption log • Requirements documentation • Requirements traceability matrix • Risk register • Stakeholder register 4. Enterprise environmental factors 5. Organizational process assets Tools & Techniques 1. Expert judgment 2. Data gathering • Benchmarking • Brainstorming • Interviews 3. Data analysis • Cost benefit analysis • Cost of quality 4. Decision making • Multiple criteria decision analysis 5. Data representation • Flowcharts • Logical data model • Matrix diagrams • Mind mapping 6. Test and inspection planning 7. Meetings Outputs 1. Quality management plan 2. Process improvement plan 3. Quality metrics 4. Quality checklists 5. Project documents updates 12
  • 13.
    1 - PlanQuality Management 13
  • 14.
    Quality Planning Techniques •Cost - benefit analysis: – Weight the expected benefits versus the cost of meeting quality requirements. • Design of Experiments (DOE): – Use experimentation to statistically determine what variable will improve quality; – Systematically changing all of the important factors, rather than changing the factors one at a time. • Statistical sampling: – We need it since studying entire population would take too long, too much cost, be too destructive. • Flowcharting: – Use to see a process or system flows and find potential quality problem. • Benchmarking: – Comparing actual or planned project to the comparable projects to identify best practices, generate ideas for improvement, and provide a basis for measuring performance. 14
  • 15.
    Cost of Quality •Looking at what the cost of conformance and nonconformance to quality and creating an appropriate balance. Cost of Conformance Cost of Nonconformance Quality training Rework / repair Quality audit Scrap Studies, surveys Inventory cost Effort to ensure everyone knows the process to use to complete their work Warranty cost Quality staff Lost business …should be less then... < 15
  • 16.
    Control Charts Upper control limit Lowercontrol limit Out of control Assignable/specia l cause Specification limit: is point determines by customer, not calculated based on control chart Normal and expected variation Usually 3 or 6 sigma Rule of seven (non random data points) Out of control Assignable/special cause Normal distribution curve 16
  • 17.
    Outputs • Quality managementplan: – Project management method; – Quality standards that will be used by the project; – Quality objectives of the project; – Quality roles and responsibilities; – Project deliverables and processes subject to quality review; – Quality control and quality management activities planned for the project; – Quality tools that will be used for the project; and – Major procedures relevant for the project. • Quality metrics: – An operational that describes how quality control process will measure it; – What are things that important to measure and decide what measurement is acceptable. • Quality checklists: – A list of items to inspect, step to be performed and note if any defects found. • Process improvement plan: – Process boundaries, process configuration, process metrics, targets for improved performance. Quality metrics is input for: • Quality Assurance AND • Quality Control. Quality checklist is input for: • Quality Control ONLY. 17
  • 18.
    2 - ManageQuality • Process of translating the quality management plan into executable quality activities that incorporate the organization’s quality policies into the project; • Increase the probability of meeting the quality objectives as well as identifying ineffective processes and causes of poor quality. Inputs 1. Quality management plan 2. Project documents • Lessons learned register • Process improvement plan • Quality metrics • Quality control measurement • Risk report 3. Organizational process asset Tools & Techniques 1. Data gathering - Checklists 2. Data analysis • Alternatives, document analysis • Process, root cause analysis 3. Decision making • Multicriteria decision analysis 4. Data representation • Affinity diagrams • Cause-and-effect diagrams • Flowcharts - Histograms • Matrix diagrams - Scatter diagrams 5. Audits 6. Design for X 7. Problem solving 8. Quality improvement methods Outputs 1. Quality reports 2. Test and evaluation documents 3. Change requests 4. Project management plan updates • Quality management plan • Scope baseline • Schedule baseline • Cost baseline 5. Project documents updates • Issue log • Lessons learned register • Risk register 18
  • 19.
    2 - ManageQuality 19
  • 20.
    Manage Quality • Designan optimal and mature product by implementing specific design guidelines that address specific aspects of the product; • Build confidence that a future output will be completed in a manner that meets the specified requirements and expectations through quality assurance tools and techniques such as quality audits and failure analysis; • Confirm that the quality processes are used and that their use meets the quality objectives of the project; and • Improve the efficiency and effectiveness of processes and activities to achieve better results and performance and enhance stakeholders’ satisfaction. 20
  • 21.
    Quality Assurance • Arewe using the standard? • Can we improve the standard? • Quality audits: – Identifying all good and best practices being implemented; – Identifying all nonconformity, gaps, and shortcomings; – Sharing good practices introduced or implemented in similar projects in the organization and/or industry; – Proactively offering assistance in a positive manner to improve the implementation of processes to help raise team productivity; and – Highlighting contributions of each audit in the lessons learned repository of the organization. • Process analysis: – Includes root cause analysis. 21
  • 22.
    Manage Quality (Toolsand Techniques) 22 • Cause-and-Effect Diagram:
  • 23.
    Manage Quality (Toolsand Techniques) 23 • Problem Solving: – Defining the problem; – Identifying the root-cause; – Generating possible solutions; – Choosing the best solution; – Implementing the solution; and – Verifying solution effectiveness.
  • 24.
    3 - ControlQuality • Process of monitoring and recording results of executing the quality management activities in order to assess performance and ensure the project outputs are complete, correct, and meet customer expectations. Inputs 1. Quality management plan 2. Project documents • Lessons learned register • Quality metrics • Test and evaluation documents 3. Approved change request 4. Deliverables 5. Work performance data 6. Enterprise environmental factors 7. Organizational process asset Tools & Techniques 1. Data gathering - Checklists 2. Data analysis • Alternatives, document analysis • Process, root cause analysis 3. Decision making • Multicriteria decision analysis 4. Data representation • Affinity diagrams • Cause-and-effect diagrams • Flowcharts - Histograms • Matrix diagrams - Scatter diagrams 5. Audits 6. Design for X 7. Problem solving 8. Quality improvement methods Outputs 1. Quality reports 2. Test and evaluation documents 3. Change requests 4. Project management plan updates • Quality management plan • Scope baseline • Schedule baseline • Cost baseline 5. Project documents updates • Issue log • Lessons learned register • Risk register 24
  • 25.
    3 - ControlQuality 25
  • 26.
    Quality Control • Causeand Effect Diagram (Ishikawa Diagram or Fishbone Diagram): – Helps stimulate thinking, organize thoughts, and generate discussion; – Can be used to explore the factors that will result in a desire future outcome. • Histogram: – Showing how often a particular problem / situation occurred. • Pareto Chart/Diagram (80/20 principle): – Histogram ordered by frequency of occurrence which used to focus attention on the most critical issues; – 80% of the problems are due to 20% of the causes. • Run Chart: – To look at history and see a pattern of variation. • Scatter Diagram  Regression analysis. 26
  • 27.
    Important Terms • Mutualexclusive: If two events cannot both occur in a single trial; • Probability: Something will occur; • Normal distribution: Common probability density distribution chart; • Statistical independence: The probability of one event occurring does not affect the probability of another event occurring; • Standard deviation (or Sigma): How far you are from the mean; • 3 or 6 sigma: – Represent the level of quality has decided to try to achieve; – 6σ is higher quality standard than 3σ; – Used to calculate the upper and lower control limits in a control chart. Number of σ Percentage of occurrences between two control limits 1 68.26% 2 95.64% 3 99.73% 6 99.99985% 27
  • 28.
    Thank You Next topic: ProjectStakeholder Management 28