Downloaded 202 times


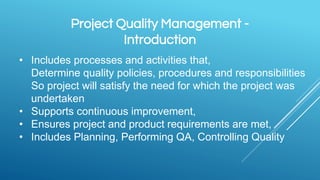

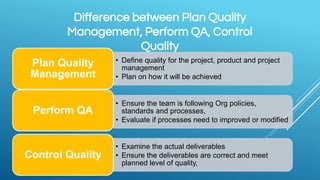
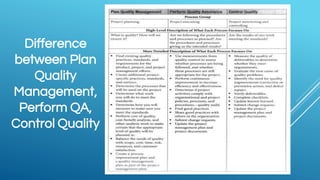
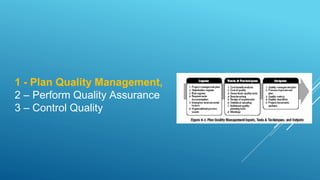


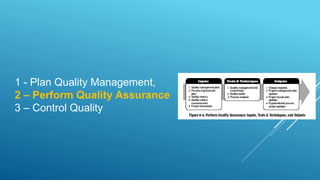
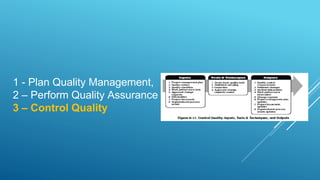
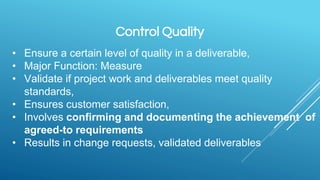


Quality management involves three main processes: 1. Plan Quality Management determines quality requirements and standards and how the project will meet them. 2. Perform Quality Assurance audits work to ensure standards are followed and identifies improvements. 3. Control Quality measures work against standards and checks for variances, validating deliverables meet requirements.


