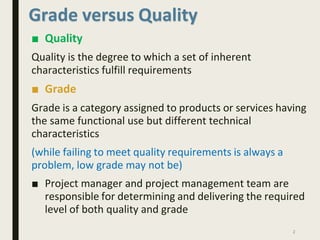
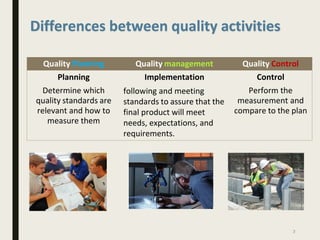
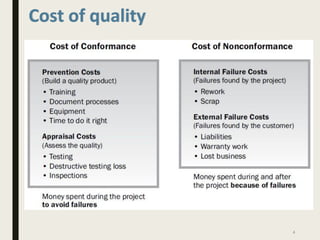
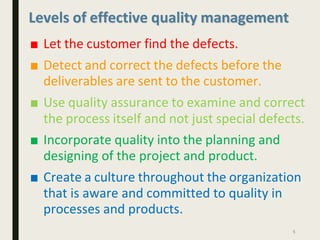
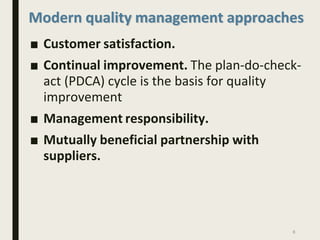
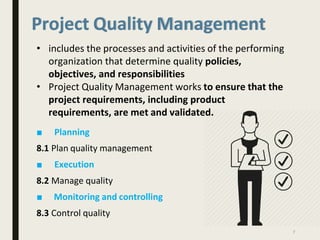
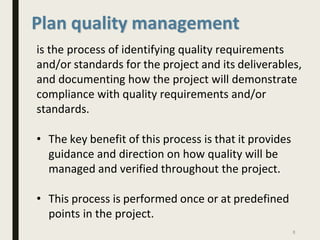
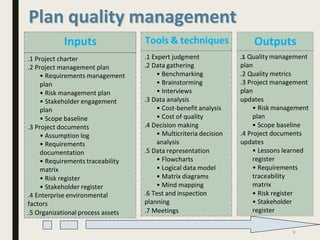
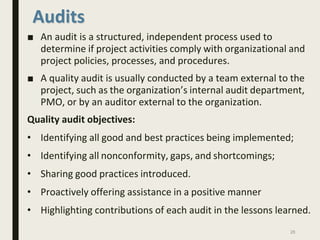
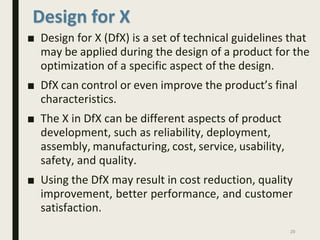
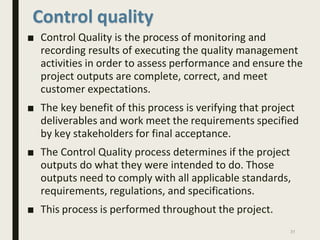
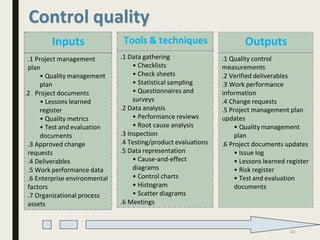
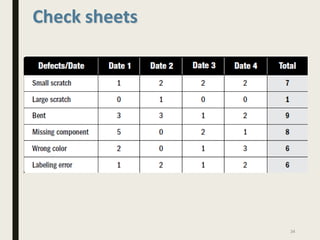
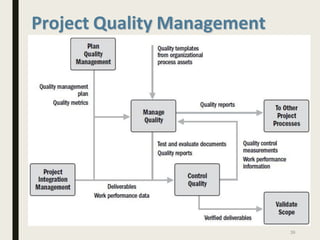
PROJECT QUALITY
MANAGEMENT
Quality is the degree to which a set of inherent
characteristics fulfill requirements
■ Grade
Grade is a category assigned to products or services having
the same functional use but different technical
characteristics
(while failing to meet quality requirements is always a
problem, low grade may not be)
■ Project manager and project management team are
responsible for determining and delivering the required
level of both quality and grade
2
Grade versus Quality
■ Quality
Quality Planning Quality management Quality Control
Planning Implementation Control
Determine which
quality standards are
relevant and how to
measure them
following and meeting
standards to assure that the
final product will meet
needs, expectations, and
requirements.
Perform the
measurement and
compare to the plan
3
Differences between quality activities
Cost of quality
4
Levels of effective quality management
■ Let the customer find the defects.
■ Detect and correct the defects before the
deliverables are sent to the customer.
■ Use quality assurance to examine and correct
the process itself and not just special defects.
■ Incorporate quality into the planning and
designing of the project and product.
■ Create a culture throughout the organization
that is aware and committed to quality in
processes and products.
5
Modern quality management approaches
■ Customer satisfaction.
■ Continual improvement. The plan-do-check-
act (PDCA) cycle is the basis for quality
improvement
■ Management responsibility.
■ Mutually beneficial partnership with
suppliers.
6
Project Quality Management
• includes the processes and activities of the performing
organization that determine quality policies,
objectives, and responsibilities
• Project Quality Management works to ensure that the
project requirements, including product
requirements, are met and validated.
■ Planning
8.1 Plan quality management
■ Execution
8.2 Manage quality
■ Monitoring and controlling
8.3 Control quality
7
Plan quality management
is the process of identifying quality requirements
and/or standards for the project and its deliverables,
and documenting how the project will demonstrate
compliance with quality requirements and/or
standards.
• The key benefit of this process is that it provides
guidance and direction on how quality will be
managed and verified throughout the project.
• This process is performed once or at predefined
points in the project.
8
Plan quality management
9
Outputs
.1 Quality management
plan
.2 Quality metrics
.3 Project management
plan
updates
• Risk management
plan
• Scope baseline
.4 Project documents
updates
• Lessons learned
register
• Requirements
traceability
matrix
• Risk register
• Stakeholder
register
Tools & techniques
.1 Expert judgment
.2 Data gathering
• Benchmarking
• Brainstorming
• Interviews
.3 Data analysis
• Cost-benefit analysis
• Cost of quality
.4 Decision making
• Multicriteria decision
analysis
.5 Data representation
• Flowcharts
• Logical data model
• Matrix diagrams
• Mind mapping
.6 Test and inspection
planning
.7 Meetings
Inputs
.1 Project charter
.2 Project management plan
• Requirements management
plan
• Risk management plan
• Stakeholder engagement
plan
• Scope baseline
.3 Project documents
• Assumption log
• Requirements
documentation
• Requirements traceability
matrix
• Risk register
• Stakeholder register
.4 Enterprise environmental
factors
.5 Organizational process assets
10
Logical data model
11
Matrix Diagram
12
Decision making (prioritization matrix)
13
Decision making (prioritization matrix)
14
Decision making (prioritization matrix)
15
Decision making (prioritization matrix)
16
Decision making (prioritization matrix)
Mind mapping
17
Quality Metrics
• A quality metric specifically describes a project or
product attribute and how the Control Quality
process will verify compliance to it.
• Some examples of quality metrics include percentage
of tasks completed on time, cost performance
measured by CPI, failure rate, number of defects
identified per day, total downtime per month, errors
found per line of code, customer satisfaction scores,
and percentage of requirements covered by the test
plan as a measure of test coverage.
18
Manage quality
is the process of translating the quality management
plan into executable quality activities that incorporate
the organization’s quality policies into the project.
• The key benefits of this process are that it increases
the probability of meeting the quality objectives as
well as identifying ineffective processes and causes of
poor quality.
• Manage Quality uses the data and results from the
control quality process to reflect the overall quality
status of the project to the stakeholders.
• This process is performed throughout the project.
19
Quality assurance
■ Manage Quality is sometimes called quality
assurance, although Manage Quality has a broader
definition than quality assurance as it is used in non-
project work.
■ In project management, the focus of quality
assurance is on the processes used in the project. It is
about using project processes effectively.
■ Quality assurance involves following and meeting
standards to assure that the final product will meet
needs, expectations, and requirements.
20
Manage quality
21
.1 Data gathering
• Checklists
.2 Data analysis
• Alternatives analysis
• Document analysis
• Process analysis
• Root cause analysis
.3 Decision making
• Multicriteria decision
analysis
.4 Data representation
• Affinity diagrams
• Cause-and-effect diagrams
• Flowcharts
• Histograms
• Matrix diagrams
• Scatter diagrams
.5 Audits
.6 Design for X
.7 Problem solving
.8 Quality improvement methods
Tools & techniques
Inputs
.1 Project management
plan
• Quality
management plan
.2 Project documents
• Lessons learned
register
• Quality control
measurements
• Quality metrics
• Risk report
.3 Organizational process
assets
Outputs
.1 Quality reports
.2 Test and evaluation
documents
.3 Change requests
.4 Project management
plan
updates
• Quality management plan
• Scope baseline
• Schedule baseline
• Cost baseline
.5 Project documents
updates
• Issue log
• Lessons learned register
• Risk register
Affinity diagram
22
Cause-and-Effect Diagram
The Fishbone or Ishikawa diagram can also
contain probabilities
Time Material Machine Method
Energy Personnel Measurement Environment
Potential causes
23
effect
Major
defect
Flowcharting
1
project
request
2
Compliance
copy
3
Develop
artwork
7
Vendors
Make proofs
6
Artwork out
For proofs
no
5
Change control
Of specs
4
Artwork
approved
no no
8
yes
10
Package
development
Review/
approval
yes
9
QA review/
approval
yes
Approved
Proof back
To vendor
24
11
Specs signed
( package and QA)
12
Order material
Cause of late time entry
35
30
25
20
15
10
5
0
25
Histogram
Insufficient
Time
Management
Direction
Process
Documentatio
System
Failure
Travel
Series1 22 3 30 3 16
Scatter diagram
27
Audits
■ An audit is a structured, independent process used to
determine if project activities comply with organizational and
project policies, processes, and procedures.
■ A quality audit is usually conducted by a team external to the
project, such as the organization’s internal audit department,
PMO, or by an auditor external to the organization.
Quality audit objectives:
• Identifying all good and best practices being implemented;
• Identifying all nonconformity, gaps, and shortcomings;
• Sharing good practices introduced.
• Proactively offering assistance in a positive manner
• Highlighting contributions of each audit in the lessons learned.
28
Design for X
■ Design for X (DfX) is a set of technical guidelines that
may be applied during the design of a product for the
optimization of a specific aspect of the design.
■ DfX can control or even improve the product’s final
characteristics.
■ The X in DfX can be different aspects of product
development, such as reliability, deployment,
assembly, manufacturing, cost, service, usability,
safety, and quality.
■ Using the DfX may result in cost reduction, quality
improvement, better performance, and customer
satisfaction.
29
■ DfA focuses on maximizing the ease with which a product can
or will be assembled. Major considerations include whether
human labor or automation will be used to join
subcomponents together.
■ When an assembly process is more manual (i.e. dependent
on human labor) then important things to incorporate into
your designs include designing mistake proofing into the parts
themselves.
30
Design for X example
■ Design for assembly (DFA)
Control quality
■ Control Quality is the process of monitoring and
recording results of executing the quality management
activities in order to assess performance and ensure the
project outputs are complete, correct, and meet
customer expectations.
■ The key benefit of this process is verifying that project
deliverables and work meet the requirements specified
by key stakeholders for final acceptance.
■ The Control Quality process determines if the project
outputs do what they were intended to do. Those
outputs need to comply with all applicable standards,
requirements, regulations, and specifications.
■ This process is performed throughout the project.
31
Control quality
32
Outputs
.1 Quality control
measurements
.2 Verified deliverables
.3 Work performance
information
.4 Change requests
.5 Project management plan
updates
• Quality management
plan
.6 Project documents updates
• Issue log
• Lessons learned register
• Risk register
• Test and evaluation
documents
Tools & techniques
.1 Data gathering
• Checklists
• Check sheets
• Statistical sampling
• Questionnaires and
surveys
.2 Data analysis
• Performance reviews
• Root cause analysis
.3 Inspection
.4 Testing/product evaluations
.5 Data representation
• Cause-and-effect
diagrams
• Control charts
• Histogram
• Scatter diagrams
.6 Meetings
Inputs
.1 Project management
plan
• Quality management
plan
.2 Project documents
• Lessons learned
register
• Quality metrics
• Test and evaluation
documents
.3 Approved change
requests
.4 Deliverables
.5 Work performance data
.6 Enterprise environmental
factors
.7 Organizational process
assets
Checklists
33
34
Check sheets
Control Chart
Graphic display of results over a period of time to determine if a process is
in control
USL
UCL
X
LCL
LSL
USL- upper specification limit
LSL- lower specification limit
UCL-upper control limit
LCL- lower control limit
Time
X- mean or expected value
36
Control Chart
Graphic display of results over a period of time to determine if a
process is in control
USL
UCL
X
LCL
LSL
USL- upper specification limit
LSL- lower specification limit
UCL-upper control limit
LCL- lower control limit
Time
X- mean or expected value
37
( rule of seven)
■ While using control-charts we say process is out
of control if:
• Data point is out of upper or lower control
limit
• Seven consecutive points are on one side of
the mean (Rule of Seven)
■ if there are seven points on one side of mean,
then an assignable cause must be found.
38
Rule of seven
Project Quality Management
39
Prevention and inspection
■ Prevention is preferred over inspection. It is better to design
quality into deliverables, rather than to find quality issues
during inspection.
Differences between the following pairs of terms:
■ Prevention and inspection
■ Attribute sampling (the result either conforms or does not
conform) and variable sampling (the result is rated on a
continuous scale that measures the degree of conformity);
and
■ Tolerances (specified range of acceptable results) and
control limits (that identify the boundaries of common
variation in a statistically stable process or process
performance).
40
Tailoring considerations
■ Policy compliance and auditing.
■ Standards and regulatory
compliance.
■ Continuous improvement.
■ Stakeholder engagement.
41
42
Project Quality Management | Gaurav Singh Rajput

Project Quality Management | Gaurav Singh Rajput

  • 1.
  • 2.
    Quality is thedegree to which a set of inherent characteristics fulfill requirements ■ Grade Grade is a category assigned to products or services having the same functional use but different technical characteristics (while failing to meet quality requirements is always a problem, low grade may not be) ■ Project manager and project management team are responsible for determining and delivering the required level of both quality and grade 2 Grade versus Quality ■ Quality
  • 3.
    Quality Planning Qualitymanagement Quality Control Planning Implementation Control Determine which quality standards are relevant and how to measure them following and meeting standards to assure that the final product will meet needs, expectations, and requirements. Perform the measurement and compare to the plan 3 Differences between quality activities
  • 4.
  • 5.
    Levels of effectivequality management ■ Let the customer find the defects. ■ Detect and correct the defects before the deliverables are sent to the customer. ■ Use quality assurance to examine and correct the process itself and not just special defects. ■ Incorporate quality into the planning and designing of the project and product. ■ Create a culture throughout the organization that is aware and committed to quality in processes and products. 5
  • 6.
    Modern quality managementapproaches ■ Customer satisfaction. ■ Continual improvement. The plan-do-check- act (PDCA) cycle is the basis for quality improvement ■ Management responsibility. ■ Mutually beneficial partnership with suppliers. 6
  • 7.
    Project Quality Management •includes the processes and activities of the performing organization that determine quality policies, objectives, and responsibilities • Project Quality Management works to ensure that the project requirements, including product requirements, are met and validated. ■ Planning 8.1 Plan quality management ■ Execution 8.2 Manage quality ■ Monitoring and controlling 8.3 Control quality 7
  • 8.
    Plan quality management isthe process of identifying quality requirements and/or standards for the project and its deliverables, and documenting how the project will demonstrate compliance with quality requirements and/or standards. • The key benefit of this process is that it provides guidance and direction on how quality will be managed and verified throughout the project. • This process is performed once or at predefined points in the project. 8
  • 9.
    Plan quality management 9 Outputs .1Quality management plan .2 Quality metrics .3 Project management plan updates • Risk management plan • Scope baseline .4 Project documents updates • Lessons learned register • Requirements traceability matrix • Risk register • Stakeholder register Tools & techniques .1 Expert judgment .2 Data gathering • Benchmarking • Brainstorming • Interviews .3 Data analysis • Cost-benefit analysis • Cost of quality .4 Decision making • Multicriteria decision analysis .5 Data representation • Flowcharts • Logical data model • Matrix diagrams • Mind mapping .6 Test and inspection planning .7 Meetings Inputs .1 Project charter .2 Project management plan • Requirements management plan • Risk management plan • Stakeholder engagement plan • Scope baseline .3 Project documents • Assumption log • Requirements documentation • Requirements traceability matrix • Risk register • Stakeholder register .4 Enterprise environmental factors .5 Organizational process assets
  • 10.
  • 11.
  • 12.
  • 13.
  • 14.
  • 15.
  • 16.
  • 17.
  • 18.
    Quality Metrics • Aquality metric specifically describes a project or product attribute and how the Control Quality process will verify compliance to it. • Some examples of quality metrics include percentage of tasks completed on time, cost performance measured by CPI, failure rate, number of defects identified per day, total downtime per month, errors found per line of code, customer satisfaction scores, and percentage of requirements covered by the test plan as a measure of test coverage. 18
  • 19.
    Manage quality is theprocess of translating the quality management plan into executable quality activities that incorporate the organization’s quality policies into the project. • The key benefits of this process are that it increases the probability of meeting the quality objectives as well as identifying ineffective processes and causes of poor quality. • Manage Quality uses the data and results from the control quality process to reflect the overall quality status of the project to the stakeholders. • This process is performed throughout the project. 19
  • 20.
    Quality assurance ■ ManageQuality is sometimes called quality assurance, although Manage Quality has a broader definition than quality assurance as it is used in non- project work. ■ In project management, the focus of quality assurance is on the processes used in the project. It is about using project processes effectively. ■ Quality assurance involves following and meeting standards to assure that the final product will meet needs, expectations, and requirements. 20
  • 21.
    Manage quality 21 .1 Datagathering • Checklists .2 Data analysis • Alternatives analysis • Document analysis • Process analysis • Root cause analysis .3 Decision making • Multicriteria decision analysis .4 Data representation • Affinity diagrams • Cause-and-effect diagrams • Flowcharts • Histograms • Matrix diagrams • Scatter diagrams .5 Audits .6 Design for X .7 Problem solving .8 Quality improvement methods Tools & techniques Inputs .1 Project management plan • Quality management plan .2 Project documents • Lessons learned register • Quality control measurements • Quality metrics • Risk report .3 Organizational process assets Outputs .1 Quality reports .2 Test and evaluation documents .3 Change requests .4 Project management plan updates • Quality management plan • Scope baseline • Schedule baseline • Cost baseline .5 Project documents updates • Issue log • Lessons learned register • Risk register
  • 22.
  • 23.
    Cause-and-Effect Diagram The Fishboneor Ishikawa diagram can also contain probabilities Time Material Machine Method Energy Personnel Measurement Environment Potential causes 23 effect Major defect
  • 24.
    Flowcharting 1 project request 2 Compliance copy 3 Develop artwork 7 Vendors Make proofs 6 Artwork out Forproofs no 5 Change control Of specs 4 Artwork approved no no 8 yes 10 Package development Review/ approval yes 9 QA review/ approval yes Approved Proof back To vendor 24 11 Specs signed ( package and QA) 12 Order material
  • 25.
    Cause of latetime entry 35 30 25 20 15 10 5 0 25 Histogram Insufficient Time Management Direction Process Documentatio System Failure Travel Series1 22 3 30 3 16
  • 26.
  • 27.
    Audits ■ An auditis a structured, independent process used to determine if project activities comply with organizational and project policies, processes, and procedures. ■ A quality audit is usually conducted by a team external to the project, such as the organization’s internal audit department, PMO, or by an auditor external to the organization. Quality audit objectives: • Identifying all good and best practices being implemented; • Identifying all nonconformity, gaps, and shortcomings; • Sharing good practices introduced. • Proactively offering assistance in a positive manner • Highlighting contributions of each audit in the lessons learned. 28
  • 28.
    Design for X ■Design for X (DfX) is a set of technical guidelines that may be applied during the design of a product for the optimization of a specific aspect of the design. ■ DfX can control or even improve the product’s final characteristics. ■ The X in DfX can be different aspects of product development, such as reliability, deployment, assembly, manufacturing, cost, service, usability, safety, and quality. ■ Using the DfX may result in cost reduction, quality improvement, better performance, and customer satisfaction. 29
  • 29.
    ■ DfA focuseson maximizing the ease with which a product can or will be assembled. Major considerations include whether human labor or automation will be used to join subcomponents together. ■ When an assembly process is more manual (i.e. dependent on human labor) then important things to incorporate into your designs include designing mistake proofing into the parts themselves. 30 Design for X example ■ Design for assembly (DFA)
  • 30.
    Control quality ■ ControlQuality is the process of monitoring and recording results of executing the quality management activities in order to assess performance and ensure the project outputs are complete, correct, and meet customer expectations. ■ The key benefit of this process is verifying that project deliverables and work meet the requirements specified by key stakeholders for final acceptance. ■ The Control Quality process determines if the project outputs do what they were intended to do. Those outputs need to comply with all applicable standards, requirements, regulations, and specifications. ■ This process is performed throughout the project. 31
  • 31.
    Control quality 32 Outputs .1 Qualitycontrol measurements .2 Verified deliverables .3 Work performance information .4 Change requests .5 Project management plan updates • Quality management plan .6 Project documents updates • Issue log • Lessons learned register • Risk register • Test and evaluation documents Tools & techniques .1 Data gathering • Checklists • Check sheets • Statistical sampling • Questionnaires and surveys .2 Data analysis • Performance reviews • Root cause analysis .3 Inspection .4 Testing/product evaluations .5 Data representation • Cause-and-effect diagrams • Control charts • Histogram • Scatter diagrams .6 Meetings Inputs .1 Project management plan • Quality management plan .2 Project documents • Lessons learned register • Quality metrics • Test and evaluation documents .3 Approved change requests .4 Deliverables .5 Work performance data .6 Enterprise environmental factors .7 Organizational process assets
  • 32.
  • 33.
  • 34.
    Control Chart Graphic displayof results over a period of time to determine if a process is in control USL UCL X LCL LSL USL- upper specification limit LSL- lower specification limit UCL-upper control limit LCL- lower control limit Time X- mean or expected value 36
  • 35.
    Control Chart Graphic displayof results over a period of time to determine if a process is in control USL UCL X LCL LSL USL- upper specification limit LSL- lower specification limit UCL-upper control limit LCL- lower control limit Time X- mean or expected value 37 ( rule of seven)
  • 36.
    ■ While usingcontrol-charts we say process is out of control if: • Data point is out of upper or lower control limit • Seven consecutive points are on one side of the mean (Rule of Seven) ■ if there are seven points on one side of mean, then an assignable cause must be found. 38 Rule of seven
  • 37.
  • 38.
    Prevention and inspection ■Prevention is preferred over inspection. It is better to design quality into deliverables, rather than to find quality issues during inspection. Differences between the following pairs of terms: ■ Prevention and inspection ■ Attribute sampling (the result either conforms or does not conform) and variable sampling (the result is rated on a continuous scale that measures the degree of conformity); and ■ Tolerances (specified range of acceptable results) and control limits (that identify the boundaries of common variation in a statistically stable process or process performance). 40
  • 39.
    Tailoring considerations ■ Policycompliance and auditing. ■ Standards and regulatory compliance. ■ Continuous improvement. ■ Stakeholder engagement. 41
  • 40.