Downloaded 192 times
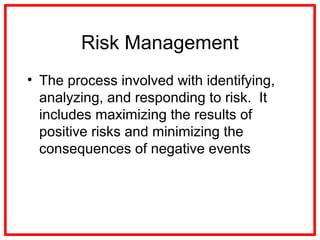
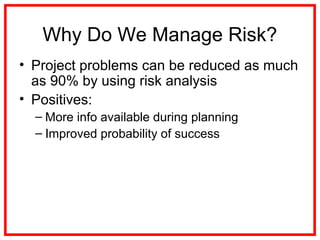


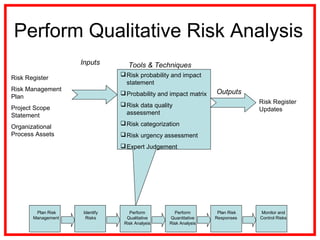
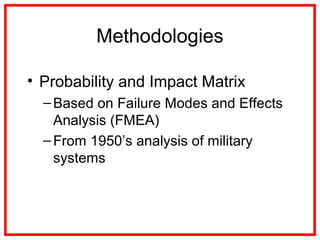
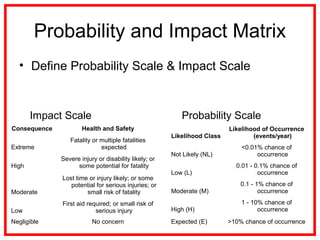
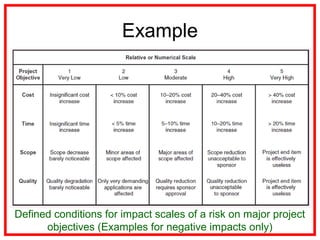


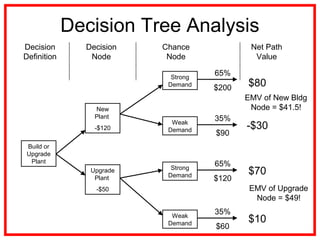
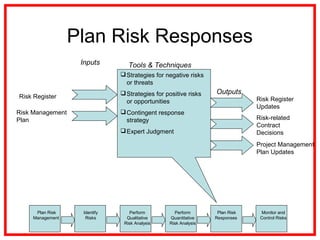
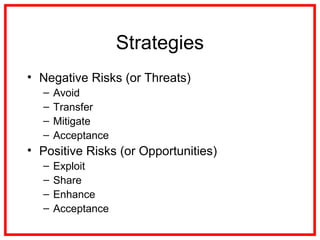


The document outlines the processes and methodologies involved in project risk management, including identifying, analyzing, and responding to risks. It emphasizes the importance of managing risks to improve project outcomes and introduces key terms, risk management processes, and tools like qualitative and quantitative risk analysis. The document also details strategies for addressing both negative threats and positive opportunities in risk management.


