Downloaded 170 times

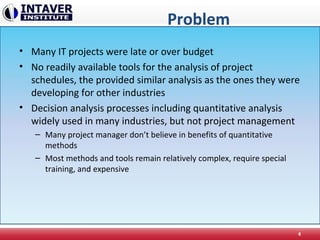

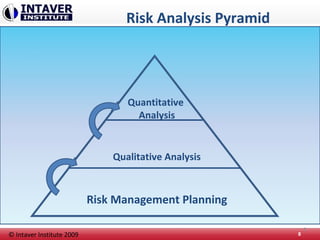


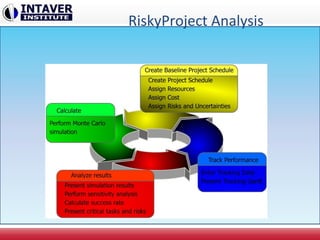


The document presents a framework for quantitative project risk analysis developed by Intaver Institute, aimed at improving project decision-making while addressing common issues like project delays and budget overruns. It emphasizes the integration of quantitative methods into project management to provide accessible and user-friendly tools, alongside training and consulting services. Key methodologies discussed include Monte Carlo simulations, risk event modeling, and sensitivity analysis to identify critical risks and uncertainties in project schedules.


![Getting Started with Apache Spark: Big Data Made Simple [Free Meetup]](https://cdn.slidesharecdn.com/ss_thumbnails/apachesparkgettingstarted-260203175547-8361bcc3-thumbnail.jpg?width=640&height=640&fit=bounds)


