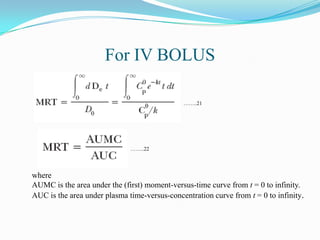
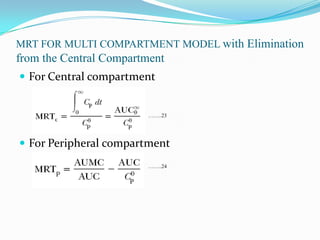
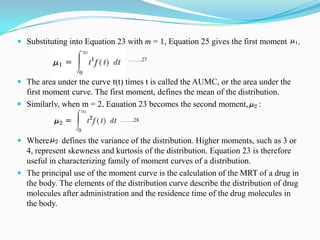
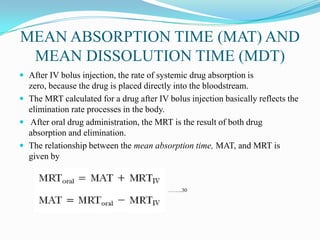
This document discusses physiological pharmacokinetic models, which describe drug movement and disposition in the body based on organ blood flow and organ spaces penetrated by the drug. It presents different types of models, including blood flow-limited models, models incorporating drug binding, and membrane-limited models. It discusses key concepts like mean residence time, mean absorption time, and mean dissolution time. Physiological pharmacokinetic models provide a more exact description of drug concentrations over time compared to non-physiological models.
1. Measurement of Bioavailability:
Direct and indirect methods may be used to assess drug bioavailability. The in-vivo bioavailability of a drug product is demonstrated by the rate and extent of drug absorption, as determined by comparison of measured parameters, e.g., concentration of the active drug ingredient in the blood, cumulative urinary excretion rates, or pharmacological effects.
For drug products that are not intended to be absorbed into the bloodstream, bioavailability may be assessed by measurements intended to reflect the rate and extent to which the active ingredient or active moiety becomes available at the site of action.
The design of the bioavailability study depends on the objectives of the study, the ability to analyze the drug (and metabolites) in biological fluids, the pharmacodynamics of the drug substance, the route of drug administration, and the nature of the drug product.
Pharmacokinetic and/or pharmacodynamic parameters as well as clinical observations and in-vitro studies may be used to determine drug bioavailability from a drug product.
1.1. Pharmacokinetic methods:
These are very widely used and based upon the assumption that the pharmacokinetic profile reflects the therapeutic effectiveness of a drug. Thus these are indirect methods. The two major pharmacokinetic methods are:
The major pharmacokinetic methods are:
Plasma / blood level time profile.
o Time for peak plasma (blood) concentration (t max)
o Peak plasma drug concentration (Cmax)
o Area under the plasma drug concentration–time curve (AUC)
Urinary excretion studies.
o Cumulative amount of drug excreted in the urine (Du)
o Rate of drug excretion in the urine (dDu/dt)
o Time for maximum urinary excretion (t)
C. Other biological fluids
1.2. Pharmacodynamic methods:
IT involves direct measurement of drug effect on a (patho) physiological process as a function of time. Disadvantages of it may be high variability, difficult to measure, limited choices, less reliable, more subjective, drug response influenced by several physiological & environmental factors.
They involve determination of bioavailability from:
Acute pharmacological response.
Therapeutic response.
1.3. In-vitro dissolution studies
Closed compartment apparatus
Open compartment apparatus
Dialysis systems.
1.4. Clinical observations
Well-controlled clinical trials
PHARMACOKINETIC MODELS
Drug movement within the body is a complex process. The major objective is therefore to develop a generalized and simple approach to describe, analyse and interpret the data obtained during in vivo drug disposition studies.
The two major approaches in the quantitative study of various kinetic processes of drug disposition in the body are
Model approach, and
Model-independent approach (also called as non-compartmental analysis).
Methods For Assesment Of Bioavailability Anindya Jana
Bioavailability means the rate and extent to which the active ingredient or active moiety is absorbed from a drug product and becomes available at the site of action. For drug products that are not intended to be absorbed into the bloodstream, bioavailability may be assessed by measurements intended to reflect the rate and extent to which the active ingredient or active moiety becomes available at the site of action.
Bioavailability studies are important in the Primary stages of development of a suitable dosage form for a new drug entity, determination of influence of excipients, patient related factors & possible interaction with other drugs on the efficiency of absorption, development of new formulations of the existing drugs, control of quality of a drug product during the early stages of marketing in order to determine the influence of processing factors, storage & stability on drug absorption
Bioavailability & Bioequivalence Studies
https://youtube.com/vishalshelke99
https://instagram.com/vishal_stagram
Sub :- Research Methodology
M.Phrmacy Semister 1
Savitribai Phule Pune University
Bioavailability:
Bioavailability is defined as a measure, of the rate and amount of drug, which reaches the systemic circulation unchanged following the administration of a dosage form.
Absolute bioavailability:
When systemic availability of a drug administered orally
is determined in comparison to its I.V. administration, denoted by F.
Relative bioavailability:
When systemic availability of a drug after oral administration is
Compared with that of oral standard of the same drug
( Solution or suspension ) and denoted by Fr.
This presentation is about the process by which prolonged therapeutic activity of drug is achieved and it's importance. By this presentation you will learn about dosage regimen, steady state concentration, principle of superposition, drug accumulation, repetitive intravenous injections etc. By this you will also learn how to adjust the dose to the patient.
Compartmental analysis is an analytical method developed to assume the kinetics ( absorption, distribution, metabolism, half life, excretion, etc.) of a drug, where a live organ is considered as one or more compartments. Observed result helps a researcher to predict how the drug or formulation may act inside body, for how long, if the formulation is suitable to produce maximum deliberation of drugs in body as well as compatibility of drug or drug toxicity study. Among numerous models, in non cmpartmental model it is considerd that the formulation kinetics depend on other variables instead of compartment itself. This slide is an short overview of pharmaceutical compartmental models with a slightly elaborate discussions about different non compartmental analytical methods.
The prostate is an exocrine gland of the male mammalian reproductive system
It is a walnut-sized gland that forms part of the male reproductive system and is located in front of the rectum and just below the urinary bladder
Function is to store and secrete a clear, slightly alkaline fluid that constitutes 10-30% of the volume of the seminal fluid that along with the spermatozoa, constitutes semen
A healthy human prostate measures (4cm-vertical, by 3cm-horizontal, 2cm ant-post ).
It surrounds the urethra just below the urinary bladder. It has anterior, median, posterior and two lateral lobes
It’s work is regulated by androgens which are responsible for male sex characteristics
Generalised disease of the prostate due to hormonal derangement which leads to non malignant enlargement of the gland (increase in the number of epithelial cells and stromal tissue)to cause compression of the urethra leading to symptoms (LUTS
- Video recording of this lecture in English language: https://youtu.be/lK81BzxMqdo
- Video recording of this lecture in Arabic language: https://youtu.be/Ve4P0COk9OI
- Link to download the book free: https://nephrotube.blogspot.com/p/nephrotube-nephrology-books.html
- Link to NephroTube website: www.NephroTube.com
- Link to NephroTube social media accounts: https://nephrotube.blogspot.com/p/join-nephrotube-on-social-media.html
Explore natural remedies for syphilis treatment in Singapore. Discover alternative therapies, herbal remedies, and lifestyle changes that may complement conventional treatments. Learn about holistic approaches to managing syphilis symptoms and supporting overall health.
ARTIFICIAL INTELLIGENCE IN HEALTHCARE.pdfAnujkumaranit
Artificial intelligence (AI) refers to the simulation of human intelligence processes by machines, especially computer systems. It encompasses tasks such as learning, reasoning, problem-solving, perception, and language understanding. AI technologies are revolutionizing various fields, from healthcare to finance, by enabling machines to perform tasks that typically require human intelligence.
Pulmonary Thromboembolism - etilogy, types, medical- Surgical and nursing man...VarunMahajani
Disruption of blood supply to lung alveoli due to blockage of one or more pulmonary blood vessels is called as Pulmonary thromboembolism. In this presentation we will discuss its causes, types and its management in depth.
Anti ulcer drugs and their Advance pharmacology ||
Anti-ulcer drugs are medications used to prevent and treat ulcers in the stomach and upper part of the small intestine (duodenal ulcers). These ulcers are often caused by an imbalance between stomach acid and the mucosal lining, which protects the stomach lining.
||Scope: Overview of various classes of anti-ulcer drugs, their mechanisms of action, indications, side effects, and clinical considerations.
micro teaching on communication m.sc nursing.pdfAnurag Sharma
Microteaching is a unique model of practice teaching. It is a viable instrument for the. desired change in the teaching behavior or the behavior potential which, in specified types of real. classroom situations, tends to facilitate the achievement of specified types of objectives.
Title: Sense of Smell
Presenter: Dr. Faiza, Assistant Professor of Physiology
Qualifications:
MBBS (Best Graduate, AIMC Lahore)
FCPS Physiology
ICMT, CHPE, DHPE (STMU)
MPH (GC University, Faisalabad)
MBA (Virtual University of Pakistan)
Learning Objectives:
Describe the primary categories of smells and the concept of odor blindness.
Explain the structure and location of the olfactory membrane and mucosa, including the types and roles of cells involved in olfaction.
Describe the pathway and mechanisms of olfactory signal transmission from the olfactory receptors to the brain.
Illustrate the biochemical cascade triggered by odorant binding to olfactory receptors, including the role of G-proteins and second messengers in generating an action potential.
Identify different types of olfactory disorders such as anosmia, hyposmia, hyperosmia, and dysosmia, including their potential causes.
Key Topics:
Olfactory Genes:
3% of the human genome accounts for olfactory genes.
400 genes for odorant receptors.
Olfactory Membrane:
Located in the superior part of the nasal cavity.
Medially: Folds downward along the superior septum.
Laterally: Folds over the superior turbinate and upper surface of the middle turbinate.
Total surface area: 5-10 square centimeters.
Olfactory Mucosa:
Olfactory Cells: Bipolar nerve cells derived from the CNS (100 million), with 4-25 olfactory cilia per cell.
Sustentacular Cells: Produce mucus and maintain ionic and molecular environment.
Basal Cells: Replace worn-out olfactory cells with an average lifespan of 1-2 months.
Bowman’s Gland: Secretes mucus.
Stimulation of Olfactory Cells:
Odorant dissolves in mucus and attaches to receptors on olfactory cilia.
Involves a cascade effect through G-proteins and second messengers, leading to depolarization and action potential generation in the olfactory nerve.
Quality of a Good Odorant:
Small (3-20 Carbon atoms), volatile, water-soluble, and lipid-soluble.
Facilitated by odorant-binding proteins in mucus.
Membrane Potential and Action Potential:
Resting membrane potential: -55mV.
Action potential frequency in the olfactory nerve increases with odorant strength.
Adaptation Towards the Sense of Smell:
Rapid adaptation within the first second, with further slow adaptation.
Psychological adaptation greater than receptor adaptation, involving feedback inhibition from the central nervous system.
Primary Sensations of Smell:
Camphoraceous, Musky, Floral, Pepperminty, Ethereal, Pungent, Putrid.
Odor Detection Threshold:
Examples: Hydrogen sulfide (0.0005 ppm), Methyl-mercaptan (0.002 ppm).
Some toxic substances are odorless at lethal concentrations.
Characteristics of Smell:
Odor blindness for single substances due to lack of appropriate receptor protein.
Behavioral and emotional influences of smell.
Transmission of Olfactory Signals:
From olfactory cells to glomeruli in the olfactory bulb, involving lateral inhibition.
Primitive, less old, and new olfactory systems with different path
Title: Sense of Taste
Presenter: Dr. Faiza, Assistant Professor of Physiology
Qualifications:
MBBS (Best Graduate, AIMC Lahore)
FCPS Physiology
ICMT, CHPE, DHPE (STMU)
MPH (GC University, Faisalabad)
MBA (Virtual University of Pakistan)
Learning Objectives:
Describe the structure and function of taste buds.
Describe the relationship between the taste threshold and taste index of common substances.
Explain the chemical basis and signal transduction of taste perception for each type of primary taste sensation.
Recognize different abnormalities of taste perception and their causes.
Key Topics:
Significance of Taste Sensation:
Differentiation between pleasant and harmful food
Influence on behavior
Selection of food based on metabolic needs
Receptors of Taste:
Taste buds on the tongue
Influence of sense of smell, texture of food, and pain stimulation (e.g., by pepper)
Primary and Secondary Taste Sensations:
Primary taste sensations: Sweet, Sour, Salty, Bitter, Umami
Chemical basis and signal transduction mechanisms for each taste
Taste Threshold and Index:
Taste threshold values for Sweet (sucrose), Salty (NaCl), Sour (HCl), and Bitter (Quinine)
Taste index relationship: Inversely proportional to taste threshold
Taste Blindness:
Inability to taste certain substances, particularly thiourea compounds
Example: Phenylthiocarbamide
Structure and Function of Taste Buds:
Composition: Epithelial cells, Sustentacular/Supporting cells, Taste cells, Basal cells
Features: Taste pores, Taste hairs/microvilli, and Taste nerve fibers
Location of Taste Buds:
Found in papillae of the tongue (Fungiform, Circumvallate, Foliate)
Also present on the palate, tonsillar pillars, epiglottis, and proximal esophagus
Mechanism of Taste Stimulation:
Interaction of taste substances with receptors on microvilli
Signal transduction pathways for Umami, Sweet, Bitter, Sour, and Salty tastes
Taste Sensitivity and Adaptation:
Decrease in sensitivity with age
Rapid adaptation of taste sensation
Role of Saliva in Taste:
Dissolution of tastants to reach receptors
Washing away the stimulus
Taste Preferences and Aversions:
Mechanisms behind taste preference and aversion
Influence of receptors and neural pathways
Impact of Sensory Nerve Damage:
Degeneration of taste buds if the sensory nerve fiber is cut
Abnormalities of Taste Detection:
Conditions: Ageusia, Hypogeusia, Dysgeusia (parageusia)
Causes: Nerve damage, neurological disorders, infections, poor oral hygiene, adverse drug effects, deficiencies, aging, tobacco use, altered neurotransmitter levels
Neurotransmitters and Taste Threshold:
Effects of serotonin (5-HT) and norepinephrine (NE) on taste sensitivity
Supertasters:
25% of the population with heightened sensitivity to taste, especially bitterness
Increased number of fungiform papillae
Prix Galien International 2024 Forum ProgramLevi Shapiro
June 20, 2024, Prix Galien International and Jerusalem Ethics Forum in ROME. Detailed agenda including panels:
- ADVANCES IN CARDIOLOGY: A NEW PARADIGM IS COMING
- WOMEN’S HEALTH: FERTILITY PRESERVATION
- WHAT’S NEW IN THE TREATMENT OF INFECTIOUS,
ONCOLOGICAL AND INFLAMMATORY SKIN DISEASES?
- ARTIFICIAL INTELLIGENCE AND ETHICS
- GENE THERAPY
- BEYOND BORDERS: GLOBAL INITIATIVES FOR DEMOCRATIZING LIFE SCIENCE TECHNOLOGIES AND PROMOTING ACCESS TO HEALTHCARE
- ETHICAL CHALLENGES IN LIFE SCIENCES
- Prix Galien International Awards Ceremony
HOT NEW PRODUCT! BIG SALES FAST SHIPPING NOW FROM CHINA!! EU KU DB BK substit...GL Anaacs
Contact us if you are interested:
Email / Skype : kefaya1771@gmail.com
Threema: PXHY5PDH
New BATCH Ku !!! MUCH IN DEMAND FAST SALE EVERY BATCH HAPPY GOOD EFFECT BIG BATCH !
Contact me on Threema or skype to start big business!!
Hot-sale products:
NEW HOT EUTYLONE WHITE CRYSTAL!!
5cl-adba precursor (semi finished )
5cl-adba raw materials
ADBB precursor (semi finished )
ADBB raw materials
APVP powder
5fadb/4f-adb
Jwh018 / Jwh210
Eutylone crystal
Protonitazene (hydrochloride) CAS: 119276-01-6
Flubrotizolam CAS: 57801-95-3
Metonitazene CAS: 14680-51-4
Payment terms: Western Union,MoneyGram,Bitcoin or USDT.
Deliver Time: Usually 7-15days
Shipping method: FedEx, TNT, DHL,UPS etc.Our deliveries are 100% safe, fast, reliable and discreet.
Samples will be sent for your evaluation!If you are interested in, please contact me, let's talk details.
We specializes in exporting high quality Research chemical, medical intermediate, Pharmaceutical chemicals and so on. Products are exported to USA, Canada, France, Korea, Japan,Russia, Southeast Asia and other countries.
Lung Cancer: Artificial Intelligence, Synergetics, Complex System Analysis, S...Oleg Kshivets
RESULTS: Overall life span (LS) was 2252.1±1742.5 days and cumulative 5-year survival (5YS) reached 73.2%, 10 years – 64.8%, 20 years – 42.5%. 513 LCP lived more than 5 years (LS=3124.6±1525.6 days), 148 LCP – more than 10 years (LS=5054.4±1504.1 days).199 LCP died because of LC (LS=562.7±374.5 days). 5YS of LCP after bi/lobectomies was significantly superior in comparison with LCP after pneumonectomies (78.1% vs.63.7%, P=0.00001 by log-rank test). AT significantly improved 5YS (66.3% vs. 34.8%) (P=0.00000 by log-rank test) only for LCP with N1-2. Cox modeling displayed that 5YS of LCP significantly depended on: phase transition (PT) early-invasive LC in terms of synergetics, PT N0—N12, cell ratio factors (ratio between cancer cells- CC and blood cells subpopulations), G1-3, histology, glucose, AT, blood cell circuit, prothrombin index, heparin tolerance, recalcification time (P=0.000-0.038). Neural networks, genetic algorithm selection and bootstrap simulation revealed relationships between 5YS and PT early-invasive LC (rank=1), PT N0—N12 (rank=2), thrombocytes/CC (3), erythrocytes/CC (4), eosinophils/CC (5), healthy cells/CC (6), lymphocytes/CC (7), segmented neutrophils/CC (8), stick neutrophils/CC (9), monocytes/CC (10); leucocytes/CC (11). Correct prediction of 5YS was 100% by neural networks computing (area under ROC curve=1.0; error=0.0).
CONCLUSIONS: 5YS of LCP after radical procedures significantly depended on: 1) PT early-invasive cancer; 2) PT N0--N12; 3) cell ratio factors; 4) blood cell circuit; 5) biochemical factors; 6) hemostasis system; 7) AT; 8) LC characteristics; 9) LC cell dynamics; 10) surgery type: lobectomy/pneumonectomy; 11) anthropometric data. Optimal diagnosis and treatment strategies for LC are: 1) screening and early detection of LC; 2) availability of experienced thoracic surgeons because of complexity of radical procedures; 3) aggressive en block surgery and adequate lymph node dissection for completeness; 4) precise prediction; 5) adjuvant chemoimmunoradiotherapy for LCP with unfavorable prognosis.
These lecture slides, by Dr Sidra Arshad, offer a quick overview of physiological basis of a normal electrocardiogram.
Learning objectives:
1. Define an electrocardiogram (ECG) and electrocardiography
2. Describe how dipoles generated by the heart produce the waveforms of the ECG
3. Describe the components of a normal electrocardiogram of a typical bipolar leads (limb II)
4. Differentiate between intervals and segments
5. Enlist some common indications for obtaining an ECG
Study Resources:
1. Chapter 11, Guyton and Hall Textbook of Medical Physiology, 14th edition
2. Chapter 9, Human Physiology - From Cells to Systems, Lauralee Sherwood, 9th edition
3. Chapter 29, Ganong’s Review of Medical Physiology, 26th edition
4. Electrocardiogram, StatPearls - https://www.ncbi.nlm.nih.gov/books/NBK549803/
5. ECG in Medical Practice by ABM Abdullah, 4th edition
6. ECG Basics, http://www.nataliescasebook.com/tag/e-c-g-basics
2. INTRODUCTION
Physiological Pharmacokinetics models are mathematical
models describing
Drug movement and disposition in the body based on organ
blood flow and organ spaces penetrated by the drug
Models are elaborated on the basis of
known anatomy and physiology of humans and other
animals
Incorporates physiological, anatomical and physiochemical
data
3. MERITS
Ideally provide an exact description of the time course of
drug concentration in any organ or tissue.
Able to provide greater insight to drug distribution in the
body.
Parameters of these models corresponds to actual
physiological and anatomical measures.
Introduce the possibility of animal scale-up which would
provide a rational basis for the correlation of drug data
among animal species.
4. DEMERITS
Greater requirements for in vitro or in vivo data
Statistical evaluation of uncertainty and variability more
challenging
Model development and implementation requires
appropriate expertise
5. ASSUMPTION
Exchange of drug between capillary blood and interstitial
water is considered to be very rapid.
Cell membrane is considered to be very permeable to the
drug.
Capillary membrane does not offer any resistance to drug
permeation.
Constant ratio of drug concentration between organ and
venous blood is quickly established.
6. TYPES OF MODEL
Blood flow limited model
Physiologic Pharmacokinetic Model with Binding
Membrane limited model
7. BLOOD FLOW LIMITED MODEL
Drug movement and disposition in the body based on
organ blood flow and the organ spaces penetrated by the
drug.
In its simplest form, a physiologic pharmacokinetic model
considers the drug to be blood flow limited.
Drugs are carried to organs by arterial blood and leave
organs by venous blood.
Differential mass balance equations are written for each
compartment to describe the
inflow, outflow, accumulation, and disappearance of
drug, and are solved simultaneously with the aid of a
computer.
8. Figure 1: Non eliminating tissue organ
• Uptake of drug into the tissues is rapid, and a constant ratio
of drug concentrations between the organ and the venous
blood is quickly established.
• This ratio is the tissue/blood partition coefficient:
where P is the partition coefficient
……..1
• The magnitude of the partition coefficient can vary
depending on the drug and on the type of tissue.
• for example: Adipose tissue has a high partition for
lipophilic drugs
9. The rate of blood flow to the tissue is expressed as Qt
(mL/min), and the rate of change in the drug concentration
with respect to time within a given tissue organ is
expressed as
……..2
……..3
where Cart is the arterial blood drug concentration and Cven is the venous blood
drug concentration. Qt is blood flow and represents the volume of blood flowing
through a typical tissue organ per unit of time
10. If drug uptake occurs in the tissue, the incoming
concentration, Cart, is higher than the outgoing venous
concentration, Cven.
In the blood flow-limited model, drug concentration in the
blood leaving the tissue and the drug concentration within
the tissue are in equilibrium, and Cven may be estimated
from the tissue/blood partition coefficient
Using equation 1 and 3;
……..4
• Equation 4 describes drug distribution in a non eliminating
organ or tissue group. For example, drug distribution to
muscle, adipose tissue, and skin is represented in a similar
manner by Equations 5, 6, and 7, respectively
11. For tissue organs in which drug is eliminated , parameters
representing drug elimination from the liver (k LIV) and
kidney (k KID) are added to account for drug removal
through metabolism or excretion.
Figure 2: A typical eliminating tissue organ
12. The rate of drug elimination may be described for each
organ or tissue
……..5
……..6
……..7
……..8
……..9
……..10
where LIV = liver, SP = spleen, GI = gastrointestinal tract, KID = kidney, LU = lung, FAT = adipose, SKIN =
skin, and MUS = muscle
13. The mass balance for the rate of change in drug
concentration in the blood pool is:
……..11
14. Figure 3: Example of blood flow to organs in a physiologic pharmacokinetic model
16. PHYSIOLOGIC PHARMACOKINETIC
MODEL WITH BINDING
The physiologic pharmacokinetic model assumes flow-
limited drug distribution without drug binding to either
plasma or tissues.
In reality, many drugs are bound to a variable extent in
either plasma or tissues.
With most physiologic models, drug binding is assumed to
be linear (not saturable or concentration dependent).
Bound and free drug in both tissue and plasma are in
equilibrium. Further, the free drug in the plasma and in the
tissue equilibrates rapidly.
17. Free drug concentration in the tissue and the free drug
concentration in the emerging blood are equal:
……..12
……..13
……..14
where fb is the blood free drug fraction, ft is the tissue free drug fraction, Ct is the
total drug concentration in tissue, and C b is the total drug concentration in blood.
Partition ratio, P t, of the tissue drug concentration to that of the plasma drug
concentration is:
……..15
18. By assuming linear drug binding and rapid drug
equilibration, the free drug fraction in tissue and blood may
be incorporated into the partition ratio and the differential
equations.
These equations are similar to those above except that free
drug concentrations are substituted for Cb.
Drug clearance in the liver is assumed to occur only with
the free drug.
The inherent capacity for drug metabolism (and
elimination) is described by the term Clint.
19. General mass balance of various tissues is described by
Equation 16
or
……..16
For liver metabolism
……..17
20. Mass balance for the drug in the blood pool is:
……..18
• The influence of binding on drug distribution is an
important factor in interspecies differences in
pharmacokinetics.
• Animal data may predict drug distribution in humans by
taking into account the differences in drug binding.
21. BLOOD FLOW-LIMITED VERSUS
DIFFUSION-LIMITED MODEL
BLOOD FLOW LIMITED MODEL DIFFUSION-LIMITED MODEL
Rapid drug equilibrium assumes that drug
diffusion is extremely fast and that the cell
membrane offers no barrier to drug
permeation
cell membrane acts as a barrier for the drug,
which gradually permeates by diffusion
If no drug binding is involved, the tissue
drug concentration is the same as that of the
venous blood leaving the tissue
blood flow is very rapid and drug
permeation is slow, a drug concentration
gradient is established between the tissue
and the venous blood
Rate limiting step is Blood flow Rate limiting step is Permeation across the
cell membrane
assumption greatly simplifies the
mathematics involved
time lag in equilibration between blood and
tissue, the pharmacokinetic equation for the
diffusion-limited model is very
complicated.
22. EXAMPLES OF DRUG DESCRIBED BY
PHYSIOLOGIC PHARMACOKINETIC MODEL
Drug Category Comment
Thiopental Anaesthetic Blood flow Limited
Nicotine Stimulant Blood flow Limited
Lidocaine Antiarrhythmic Blood flow Limited
Methotrexate Antineoplastic Plasma flow Limited
Biperiden Anticholinergic Blood flow Limited
Cisplatin Antineoplastic Plasma, Multiple
Metabolite , Binding
23. MEAN RESIDENCE TIME (MRT)
Describes the average time for all the drug molecules to reside in the
body.
Also considered as the mean transit time or mean sojourn time.
The residence time for the drug molecules in the dose may be sorted
into groups i (i = 1, 2, 3, . . . , m) according to their residing time.
The total residence time is the summation of the number of
molecules in each group i multiplied by the residence time, ti, for
each group.
The summation of n i (number of molecules in each group) is the
total number of molecules, n.
MRT is the total residence time for all molecules in the body divided
by the total number of molecules in the body, as shown in equation
19.
24. where ni is the number of molecules and ti is the residence time of the ith group
of molecules
where Dei (i = 1, 2, 3, . . . , m) is the amount of drug (mg) in the ith group with
residence time ti.
25. For IV BOLUS
……..22
……..21
where
AUMC is the area under the (first) moment-versus-time curve from t = 0 to infinity.
AUC is the area under plasma time-versus-concentration curve from t = 0 to infinity.
26. MRT FOR MULTI COMPARTMENT MODEL with Elimination
from the Central Compartment
For Central compartment
For Peripheral compartment
……..23
……..24
27. MRT is merely the expected value or mean of the
distribution.
MRT provides a fundamentally different approach than
classical pharmacokinetic models, which involve the
concept of dose, half-life, volume, and concentration.
MRT is an alternative concept to describe how drug
molecules move in and out of a system.
The concept is well established in chemical kinetics, where
the relationships between MRT and rate constants for
different systems are known.
In the last two decades, MRT has been well characterized
for various pharmacokinetic models, although MRT
application is less developed in pharmacodynamics.
28. STATISTICAL MOMENT THEORY
Statistical moment theory provides a unique way to study time-
related changes in macroscopic events.
A macroscopic event is considered as the overall event brought
about by the constitutive elements involved.
For example, in chemical processing, a dose of tracer molecules
may be injected into a reactor tank to track the transit time
(residence time) of materials that stay in the tank.
The constitutive elements in this example are the tracer
molecules, and the macroscopic events are the residence times
shared by groups of tracer molecules.
Each tracer molecule is well mixed and distributes non-
interactively and randomly in the tank
29. A probability density function f(t) multiplied by t m and integrated over time yields the
moment curve (Equation 23). The moment curve shows the characteristics of the
distribution.
where f(t) is the probability density function, t is time, and m is the mth moment
……..25
For example, when m = 0, substituting for m = 0 yields Equation 24 called the zero
moment( ),
……..26
If the distribution is a true probability function, the area under the zero moment curve is 1.
30. Substituting into Equation 23 with m = 1, Equation 25 gives the first moment ,
The area under the curve f(t) times t is called the AUMC, or the area under the
first moment curve. The first moment, defines the mean of the distribution.
Similarly, when m = 2, Equation 23 becomes the second moment, :
Where defines the variance of the distribution. Higher moments, such as 3 or
4, represent skewness and kurtosis of the distribution. Equation 23 is therefore
useful in characterizing family of moment curves of a distribution.
The principal use of the moment curve is the calculation of the MRT of a drug in
the body. The elements of the distribution curve describe the distribution of drug
molecules after administration and the residence time of the drug molecules in
the body.
……..27
……..28
31. Example
Question:
An antibiotic was given to two subjects by an IV bolus dose of 1000 mg. The drug has a volume of distribution
of 10 L and follows a one-compartment model with an elimination constant of (1) 0.1 hr– 1 and (2) 0.2 hr– 1 in
the two subjects. Determine the MRT from each C p–time curve and compare your values with the MRT
determined by taking the reciprocal of k.
Solution
Non compartmental Approach (MRT = AUMC/AUC)
1. Multiply each time point with the corresponding plasma C p to obtain points for the moment curve. Use the
trapezoid rule and sum the area to obtain area under the moment curve (AUMC1) for subject 1. Also, determine
the area under the plasma curve using the trapezoid rule.
2. The steps are as follows.
a. Multiply each C p by t as in column 5
b. Sum all C p x t values, and find the area under the moment curve (AUMC)—that is, 9986.45 (g/mL) hr2
c. Estimate tail area of the moment curve (beyond the last data point) using the equation
……..29
32. Substituting the last data point, C p = 0.00454 g/mL, the last time point, 100 hours, and the last moment curve
point, 0.454 (g/mL) hr2:
d. Estimate AUC using the trapezoid rule from columns 1 and 2 (AUC = 1000.79 g/mL/hr).
33.
34. MEAN ABSORPTION TIME (MAT) AND
MEAN DISSOLUTION TIME (MDT)
After IV bolus injection, the rate of systemic drug absorption is
zero, because the drug is placed directly into the bloodstream.
The MRT calculated for a drug after IV bolus injection basically reflects the
elimination rate processes in the body.
After oral drug administration, the MRT is the result of both drug
absorption and elimination.
The relationship between the mean absorption time, MAT, and MRT is
given by
……..30
35. For a one-compartment model, MRTIV = 1/k
In some cases, IV data are not available and an MRT for a solution
may be calculated. The mean dissolution time (MDT), or in-vivo
mean dissolution time, for a solid drug product is
MDT reflects the time for the drug to dissolve in vivo.
MDT is most readily estimated for the drugs that follow the kinetics
of a one-compartment model.
MDT is considered model independent because MRT is model
independent.
MDT has been used to compare the in-vitro dissolution versus in-vivo
bioavailability for immediate-release and extended-release drug
products.
……..31
……..32
36. Example
Data for ibuprofen are shown in table 2 and 3 Serum concentrations for ibuprofen after a capsule
and a solution are tabulated as a function of time
37. For Capsule
For solution
The MRT was determined using the trapezoid method and Equation 23
The MRT for the solution was 2.63 hours and for the product was 4.48 hours.
Therefore, MDT for the product is 4.48 – 2.63 = 1.85 hours
38. Applying Equation 22.52 directly
Alternatively,
MDT obtained for the product differs according to the method of calculation.
Errors in calculating the elimination constant, k, may greatly affect the values for
MAT and MDT.
Equation 32 is recommended because it is less affected by k.
39. REFERENCE
1. Gibaldi M, Perrier D. (2007). Pharmacokinetics (2nd ed., Vol. 15). New York:
Informa healthcare.355-80
2. Shargel L, Wu-pong S. et al (2004). Applied Biopharmaceutics and
pharmacokinetics (5th ed.). New York: McGraw-Hill Medical.