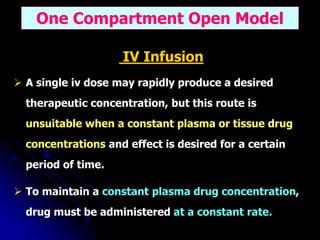
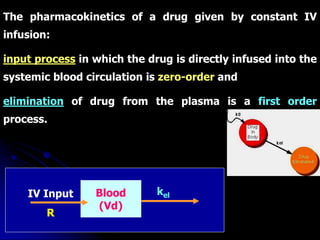
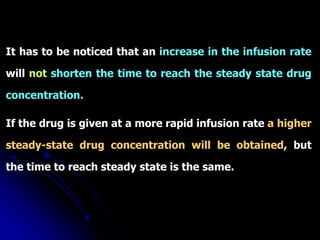
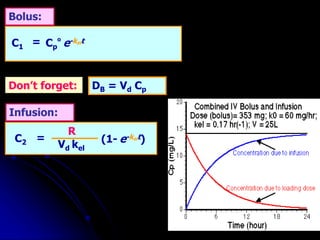
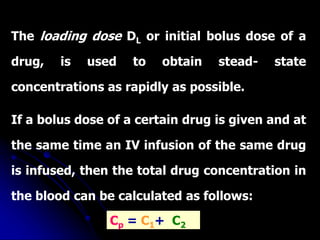
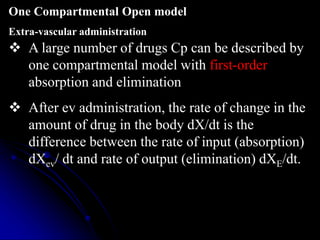
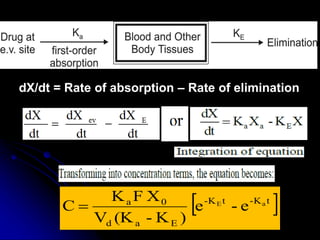
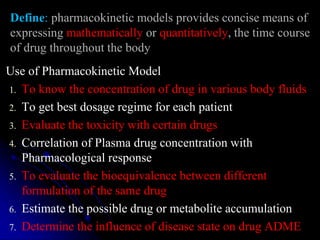
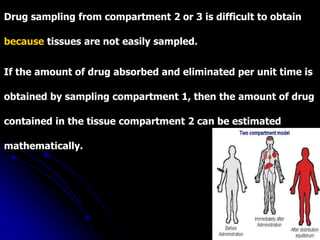
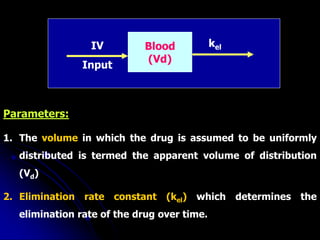
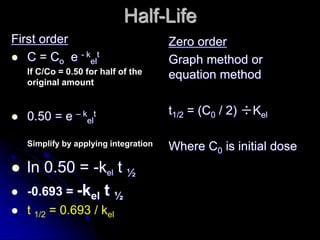
1. The document outlines a lecture on pharmacokinetic models, which provide mathematical descriptions of how drugs move through the body over time.
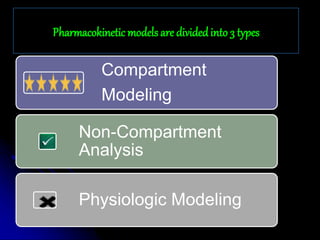
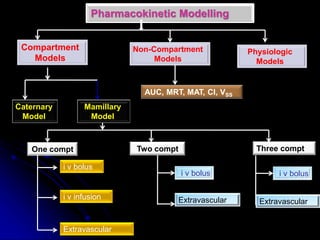
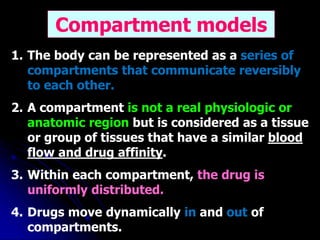
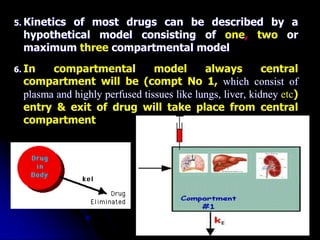
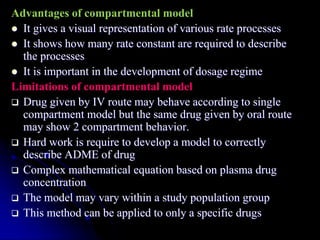
2. Pharmacokinetic models are classified as compartmental models, non-compartment models, or physiological models. Compartmental models divide the body into compartments and use rate constants to describe drug movement between compartments.
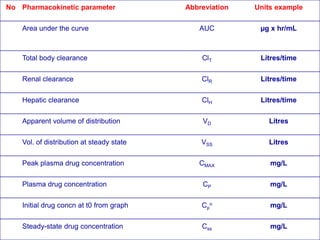
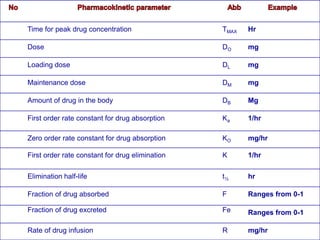
3. Key pharmacokinetic parameters like volume of distribution, elimination rate constant, half-life, and clearance can be calculated from compartmental model equations to quantify a drug's absorption, distribution, metabolism, and excretion.

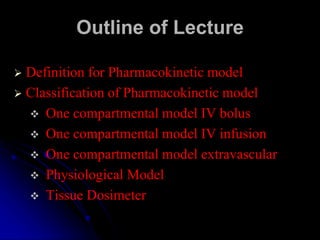
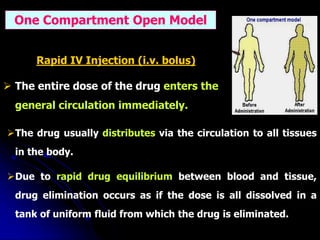
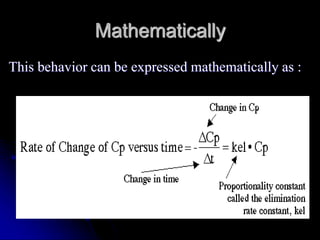
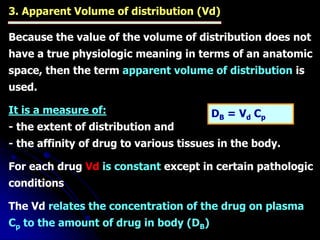
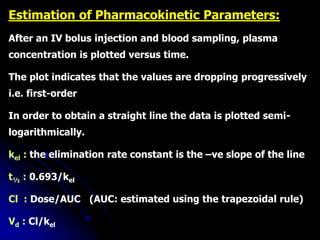
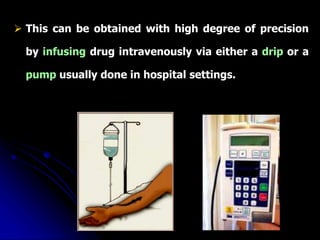
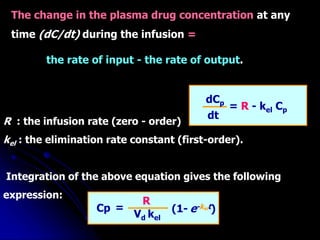
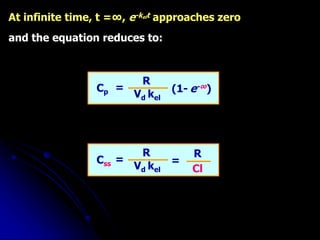
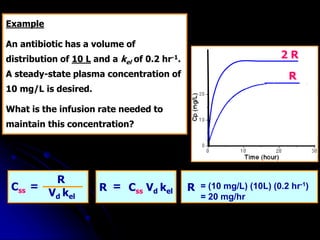
![In one-compartment model with IV injection,
the Vd is calculated from the following equation:
Vd
Dose
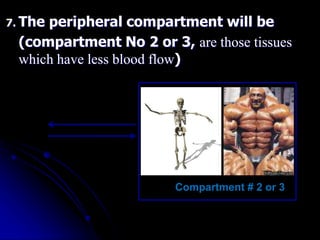
Cp
°
= =
DB
°
Cp
°
kel[AUC]
Dose
= ∞
o
Vd
• The apparent volume of distribution may be determined by
knowing the dose, elimination rate constant and the AUC.
NONCOMPARTMENTAL METHOD](https://image.slidesharecdn.com/chapter2to5-230806072337-3013e9d5/85/Pharmacokinetic-Models-32-320.jpg)
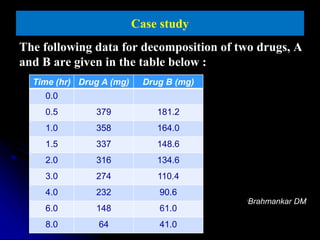
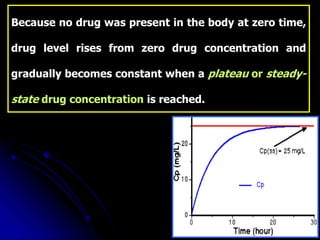
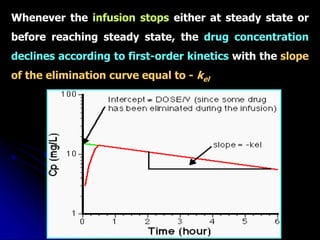
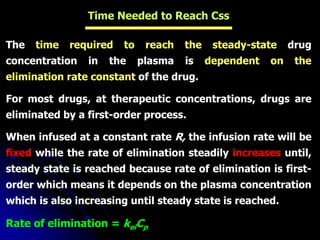
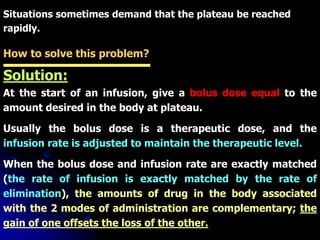
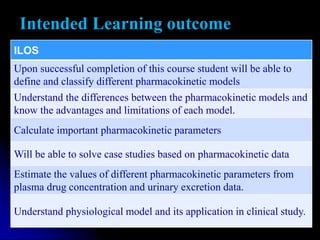
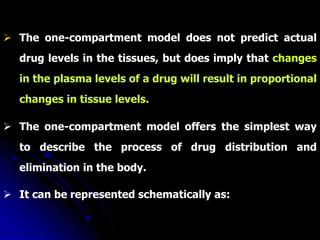
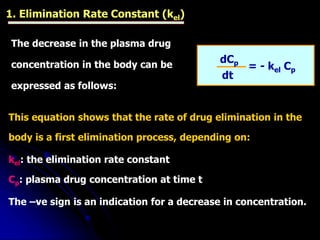
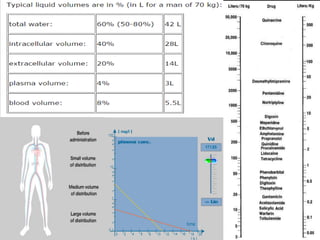
![Clearance can be also calculated from the dose and AUC:
[AUC]
Dose
Cl = ∞
o
or
From the equation it is obvious that there is no need
to know the half-life or the volume of distribution to
calculate the clearance.
Cl = kel Vd](https://image.slidesharecdn.com/chapter2to5-230806072337-3013e9d5/85/Pharmacokinetic-Models-35-320.jpg)
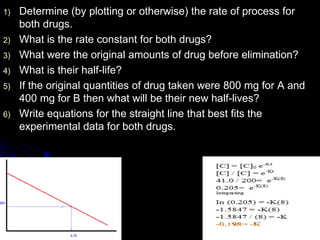
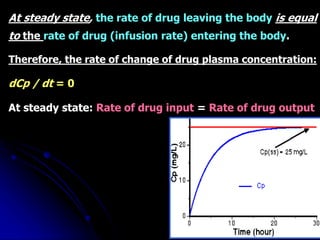
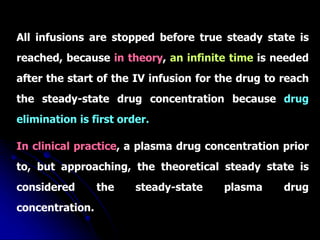
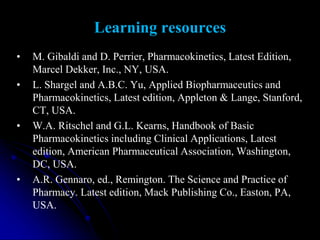
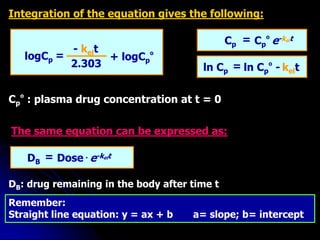
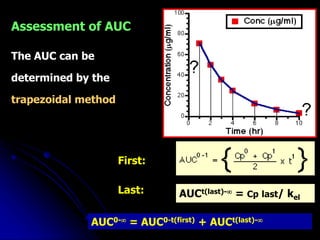
![logCp + logCp
º
- kelt
2.303
=
Cp Cp
º e-kelt
=
ln Cp ln Cp
º - kelt
=
t1/2
0.693
kel
=
Vd
Dose
Cp
°
=
k [AUC]
Dose
= ∞
o
Vd
Cl = kel Vd
[AUC]
Dose
Cl = ∞
o
kel
Cl
=
Vd](https://image.slidesharecdn.com/chapter2to5-230806072337-3013e9d5/85/Pharmacokinetic-Models-36-320.jpg)