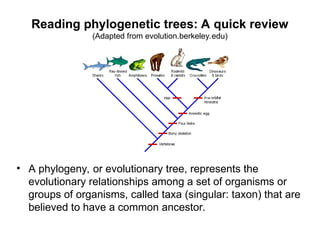
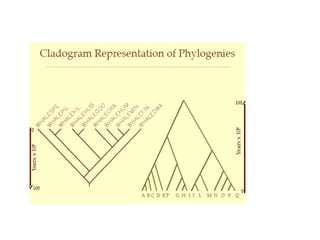
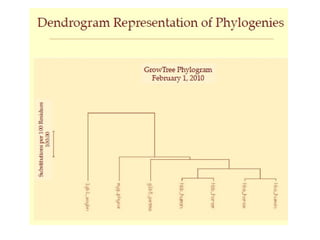
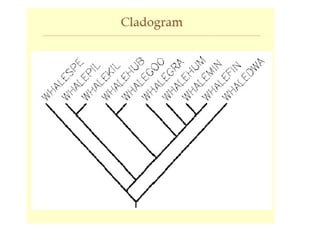
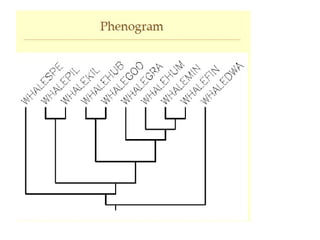
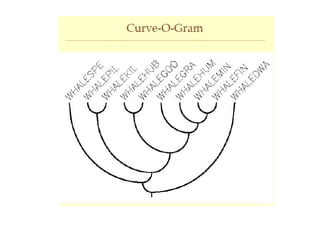
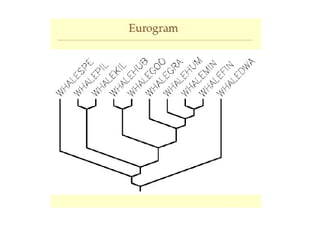
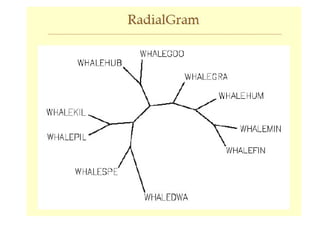
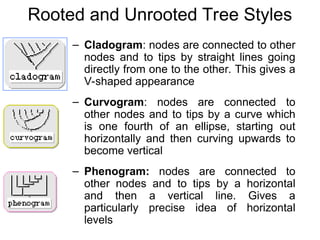
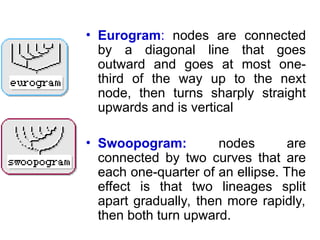
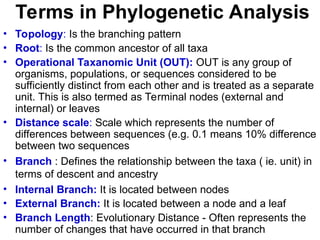
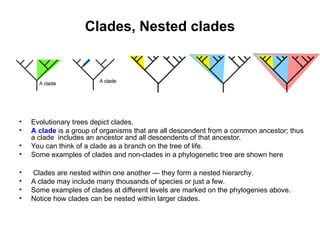
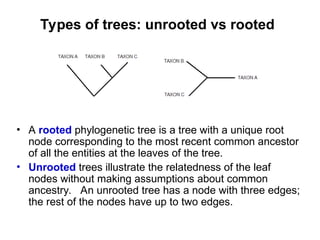
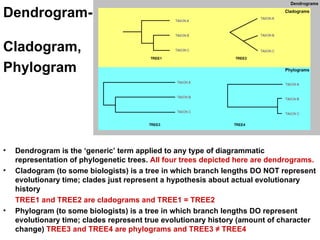
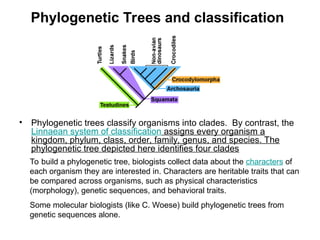
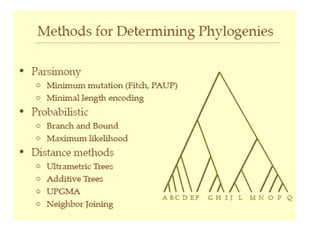
Phylogenetic Trees
Dr. R. Amutha
Reading phylogenetic trees: A quick review
(Adapted from evolution.berkeley.edu)
• A phylogeny, or evolutionary tree, represents the
evolutionary relationships among a set of organisms or
groups of organisms, called taxa (singular: taxon) that are
believed to have a common ancestor.
Rooted and Unrooted Tree Styles
– Cladogram: nodes are connected to other
nodes and to tips by straight lines going
directly from one to the other. This gives a
V-shaped appearance
– Curvogram: nodes are connected to
other nodes and to tips by a curve which
is one fourth of an ellipse, starting out
horizontally and then curving upwards to
become vertical
– Phenogram: nodes are connected to
other nodes and to tips by a horizontal
and then a vertical line. Gives a
particularly precise idea of horizontal
levels
• Eurogram: nodes are connected
by a diagonal line that goes
outward and goes at most one-
third of the way up to the next
node, then turns sharply straight
upwards and is vertical
• Swoopogram: nodes are
connected by two curves that are
each one-quarter of an ellipse. The
effect is that two lineages split
apart gradually, then more rapidly,
then both turn upward.
Terms in Phylogenetic Analysis
• Topology: Is the branching pattern
• Root: Is the common ancestor of all taxa
• Operational Taxanomic Unit (OUT): OUT is any group of
organisms, populations, or sequences considered to be
sufficiently distinct from each other and is treated as a separate
unit. This is also termed as Terminal nodes (external and
internal) or leaves
• Distance scale: Scale which represents the number of
differences between sequences (e.g. 0.1 means 10% difference
between two sequences
• Branch : Defines the relationship between the taxa ( ie. unit) in
terms of descent and ancestry
• Internal Branch: It is located between nodes
• External Branch: It is located between a node and a leaf
• Branch Length: Evolutionary Distance - Often represents the
number of changes that have occurred in that branch
Tips, Internal Nodes, Edges
• The tips of the phylogenetic tree represent groups of
descendent taxa (often species)
• The internal nodes of the tree represent the common
ancestors of those descendents.
• The tips are the present and the internal nodes are the
past.
• The edge lengths in some trees correspond to time
estimates – evolutionary time.
Sister Groups and a common ancestor
• Two descendents that split from the same node are called
sister groups.
• In the trees above, species A & B are sister groups —
they are each other's closest relatives; which means that:
– i) they have a lot of evolutionary history in common and very little
evolutionary history that is unique to either one of the two sister
species and
– ii) that they have a common ancestor that is unique to them.
Equivalent trees
• For any speciation event on a phylogeny, the choice of
which lineage goes to the right and which one goes to the
left is arbitrary.
• These three phylogenies are therefore equivalent.
Outgroup
• Many phylogenies also include an outgroup — a taxon
outside the group of interest.
• All the members of the group of interest are more closely
related to each other than they are to the outgroup.
Hence, the outgroup stems from the base of the tree.
• An outgroup can give you a sense of where the main
group of organisms falls on the bigger tree of life. It is also
useful when constructing evolutionary trees.
Clades, Nested clades
• Evolutionary trees depict clades.
• A clade is a group of organisms that are all descendent from a common ancestor; thus
a clade includes an ancestor and all descendents of that ancestor.
• You can think of a clade as a branch on the tree of life.
• Some examples of clades and non-clades in a phylogenetic tree are shown here
• Clades are nested within one another — they form a nested hierarchy.
• A clade may include many thousands of species or just a few.
• Some examples of clades at different levels are marked on the phylogenies above.
• Notice how clades can be nested within larger clades.
Types of trees: unrooted vs rooted
• A rooted phylogenetic tree is a tree with a unique root
node corresponding to the most recent common ancestor
of all the entities at the leaves of the tree.
• Unrooted trees illustrate the relatedness of the leaf
nodes without making assumptions about common
ancestry. An unrooted tree has a node with three edges;
the rest of the nodes have up to two edges.
Dendrogram-
Cladogram,
Phylogram
• Dendrogram is the ‘generic’ term applied to any type of diagrammatic
representation of phylogenetic trees. All four trees depicted here are dendrograms.
• Cladogram (to some biologists) is a tree in which branch lengths DO NOT represent
evolutionary time; clades just represent a hypothesis about actual evolutionary
history
TREE1 and TREE2 are cladograms and TREE1 = TREE2
• Phylogram (to some biologists) is a tree in which branch lengths DO represent
evolutionary time; clades represent true evolutionary history (amount of character
change) TREE3 and TREE4 are phylograms and TREE3 ≠ TREE4
Phylogenetic Trees and classification
• Phylogenetic trees classify organisms into clades. By contrast, the
Linnaean system of classification assigns every organism a
kingdom, phylum, class, order, family, genus, and species. The
phylogenetic tree depicted here identifies four clades
To build a phylogenetic tree, biologists collect data about the characters of
each organism they are interested in. Characters are heritable traits that can
be compared across organisms, such as physical characteristics
(morphology), genetic sequences, and behavioral traits.
Some molecular biologists (like C. Woese) build phylogenetic trees from
genetic sequences alone.
Phylogenetic tree analysis-Rooted and unrooted

Phylogenetic tree analysis-Rooted and unrooted

  • 1.
  • 2.
    Reading phylogenetic trees:A quick review (Adapted from evolution.berkeley.edu) • A phylogeny, or evolutionary tree, represents the evolutionary relationships among a set of organisms or groups of organisms, called taxa (singular: taxon) that are believed to have a common ancestor.
  • 10.
    Rooted and UnrootedTree Styles – Cladogram: nodes are connected to other nodes and to tips by straight lines going directly from one to the other. This gives a V-shaped appearance – Curvogram: nodes are connected to other nodes and to tips by a curve which is one fourth of an ellipse, starting out horizontally and then curving upwards to become vertical – Phenogram: nodes are connected to other nodes and to tips by a horizontal and then a vertical line. Gives a particularly precise idea of horizontal levels
  • 11.
    • Eurogram: nodesare connected by a diagonal line that goes outward and goes at most one- third of the way up to the next node, then turns sharply straight upwards and is vertical • Swoopogram: nodes are connected by two curves that are each one-quarter of an ellipse. The effect is that two lineages split apart gradually, then more rapidly, then both turn upward.
  • 12.
    Terms in PhylogeneticAnalysis • Topology: Is the branching pattern • Root: Is the common ancestor of all taxa • Operational Taxanomic Unit (OUT): OUT is any group of organisms, populations, or sequences considered to be sufficiently distinct from each other and is treated as a separate unit. This is also termed as Terminal nodes (external and internal) or leaves • Distance scale: Scale which represents the number of differences between sequences (e.g. 0.1 means 10% difference between two sequences • Branch : Defines the relationship between the taxa ( ie. unit) in terms of descent and ancestry • Internal Branch: It is located between nodes • External Branch: It is located between a node and a leaf • Branch Length: Evolutionary Distance - Often represents the number of changes that have occurred in that branch
  • 13.
    Tips, Internal Nodes,Edges • The tips of the phylogenetic tree represent groups of descendent taxa (often species) • The internal nodes of the tree represent the common ancestors of those descendents. • The tips are the present and the internal nodes are the past. • The edge lengths in some trees correspond to time estimates – evolutionary time.
  • 14.
    Sister Groups anda common ancestor • Two descendents that split from the same node are called sister groups. • In the trees above, species A & B are sister groups — they are each other's closest relatives; which means that: – i) they have a lot of evolutionary history in common and very little evolutionary history that is unique to either one of the two sister species and – ii) that they have a common ancestor that is unique to them.
  • 15.
    Equivalent trees • Forany speciation event on a phylogeny, the choice of which lineage goes to the right and which one goes to the left is arbitrary. • These three phylogenies are therefore equivalent.
  • 16.
    Outgroup • Many phylogeniesalso include an outgroup — a taxon outside the group of interest. • All the members of the group of interest are more closely related to each other than they are to the outgroup. Hence, the outgroup stems from the base of the tree. • An outgroup can give you a sense of where the main group of organisms falls on the bigger tree of life. It is also useful when constructing evolutionary trees.
  • 17.
    Clades, Nested clades •Evolutionary trees depict clades. • A clade is a group of organisms that are all descendent from a common ancestor; thus a clade includes an ancestor and all descendents of that ancestor. • You can think of a clade as a branch on the tree of life. • Some examples of clades and non-clades in a phylogenetic tree are shown here • Clades are nested within one another — they form a nested hierarchy. • A clade may include many thousands of species or just a few. • Some examples of clades at different levels are marked on the phylogenies above. • Notice how clades can be nested within larger clades.
  • 18.
    Types of trees:unrooted vs rooted • A rooted phylogenetic tree is a tree with a unique root node corresponding to the most recent common ancestor of all the entities at the leaves of the tree. • Unrooted trees illustrate the relatedness of the leaf nodes without making assumptions about common ancestry. An unrooted tree has a node with three edges; the rest of the nodes have up to two edges.
  • 19.
    Dendrogram- Cladogram, Phylogram • Dendrogram isthe ‘generic’ term applied to any type of diagrammatic representation of phylogenetic trees. All four trees depicted here are dendrograms. • Cladogram (to some biologists) is a tree in which branch lengths DO NOT represent evolutionary time; clades just represent a hypothesis about actual evolutionary history TREE1 and TREE2 are cladograms and TREE1 = TREE2 • Phylogram (to some biologists) is a tree in which branch lengths DO represent evolutionary time; clades represent true evolutionary history (amount of character change) TREE3 and TREE4 are phylograms and TREE3 ≠ TREE4
  • 20.
    Phylogenetic Trees andclassification • Phylogenetic trees classify organisms into clades. By contrast, the Linnaean system of classification assigns every organism a kingdom, phylum, class, order, family, genus, and species. The phylogenetic tree depicted here identifies four clades To build a phylogenetic tree, biologists collect data about the characters of each organism they are interested in. Characters are heritable traits that can be compared across organisms, such as physical characteristics (morphology), genetic sequences, and behavioral traits. Some molecular biologists (like C. Woese) build phylogenetic trees from genetic sequences alone.