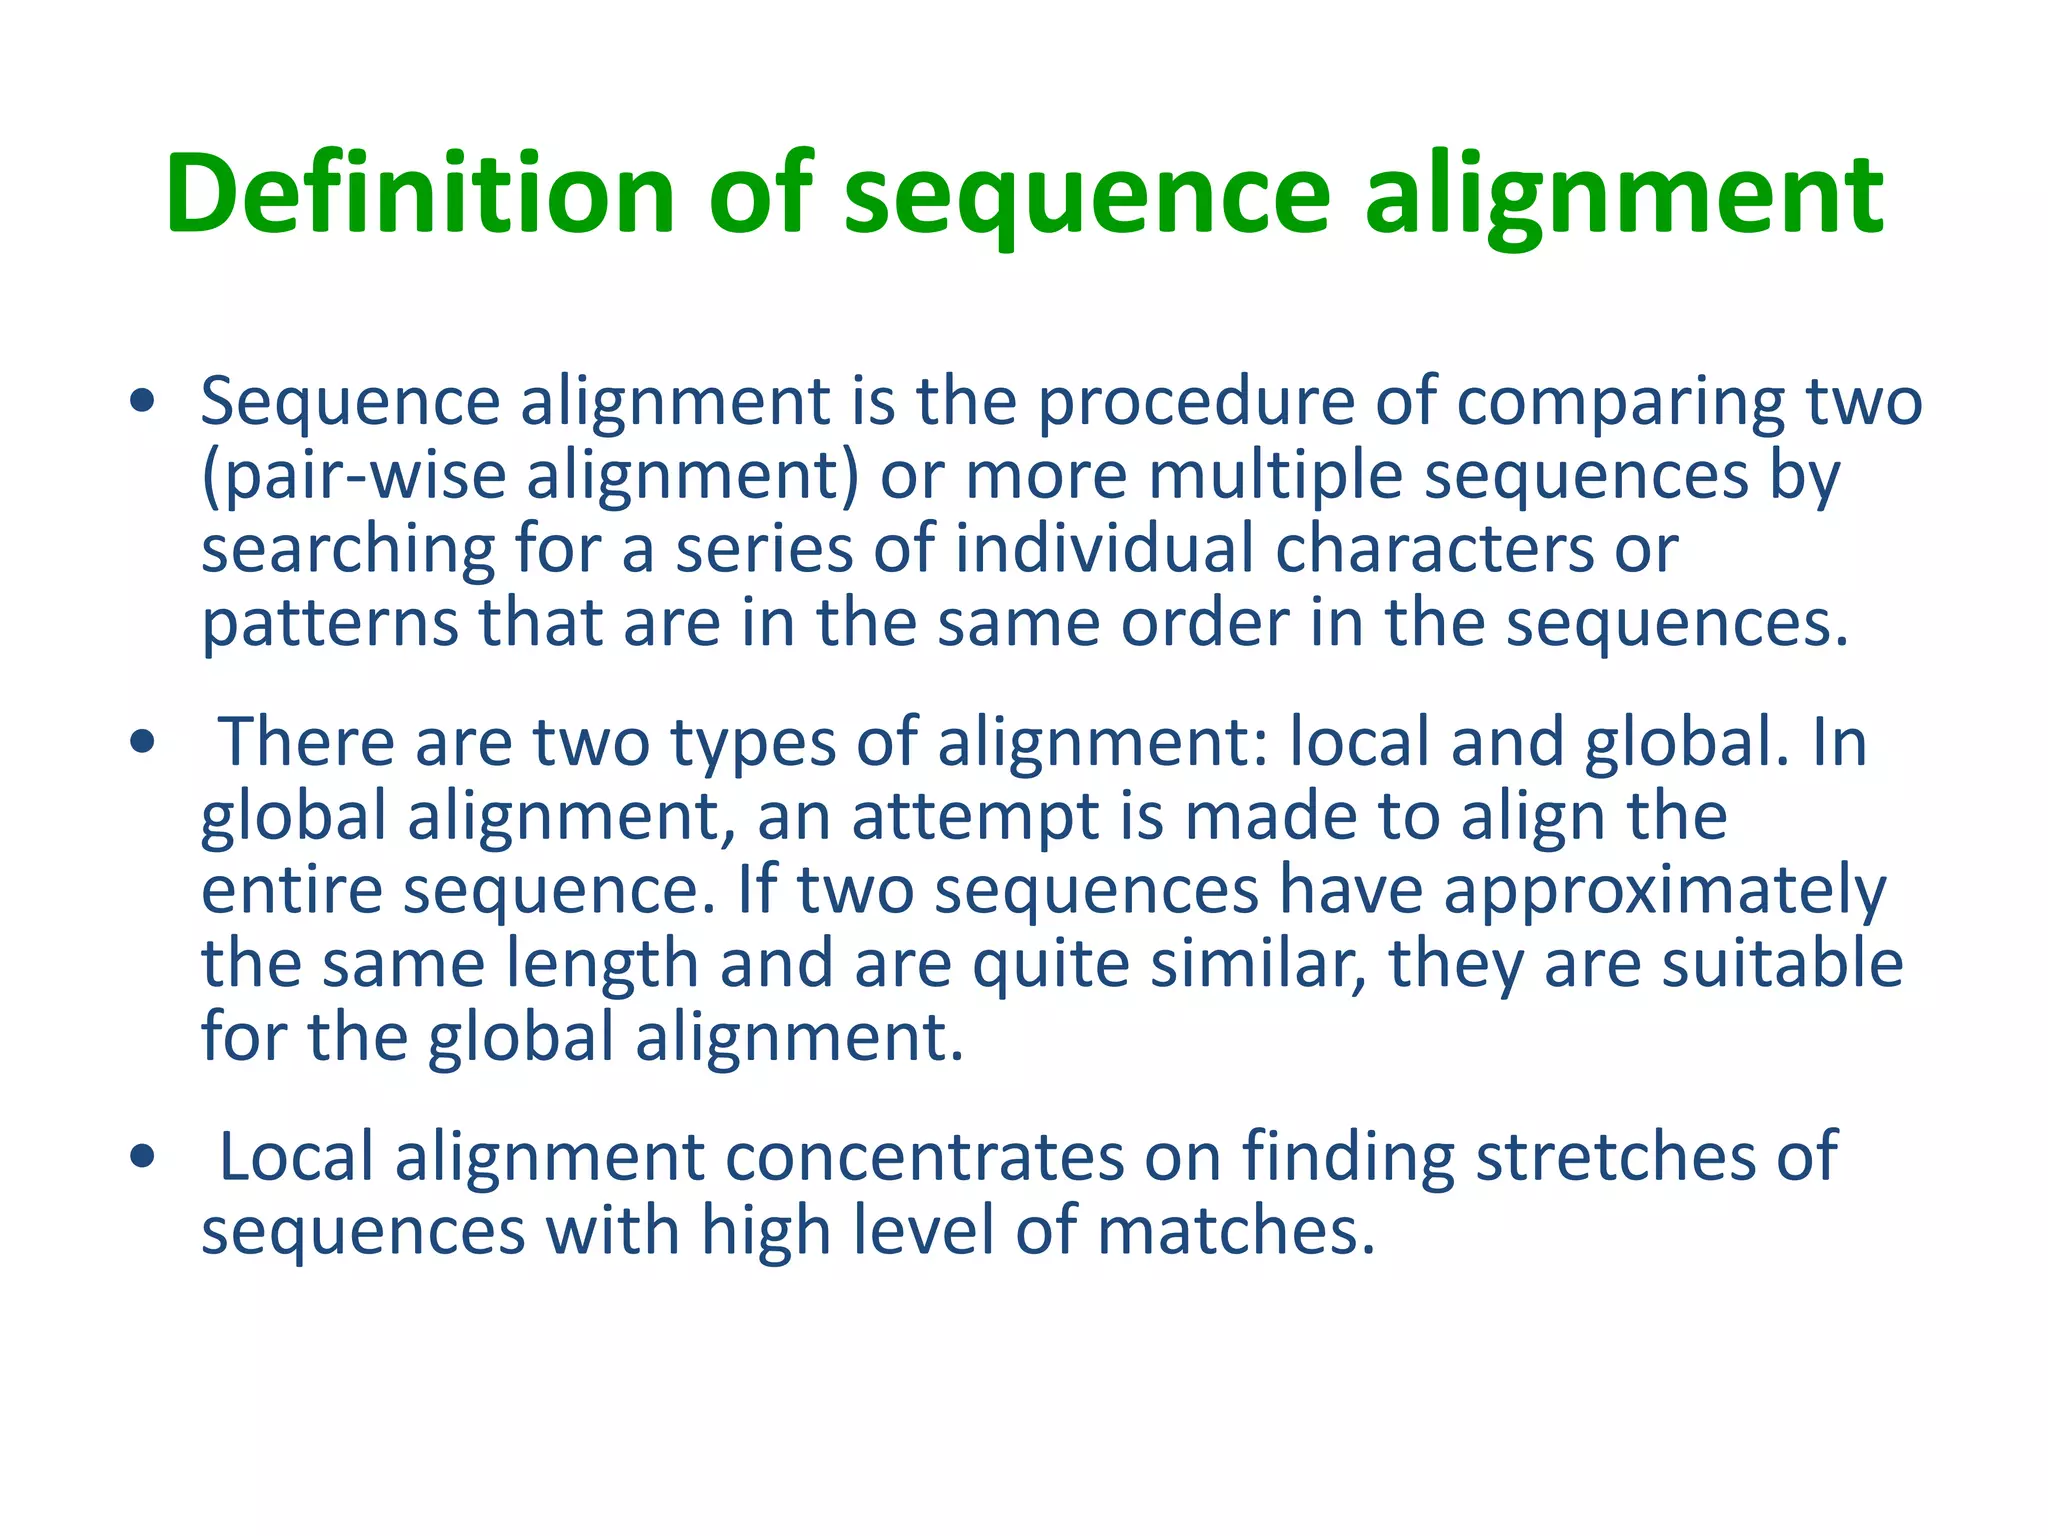
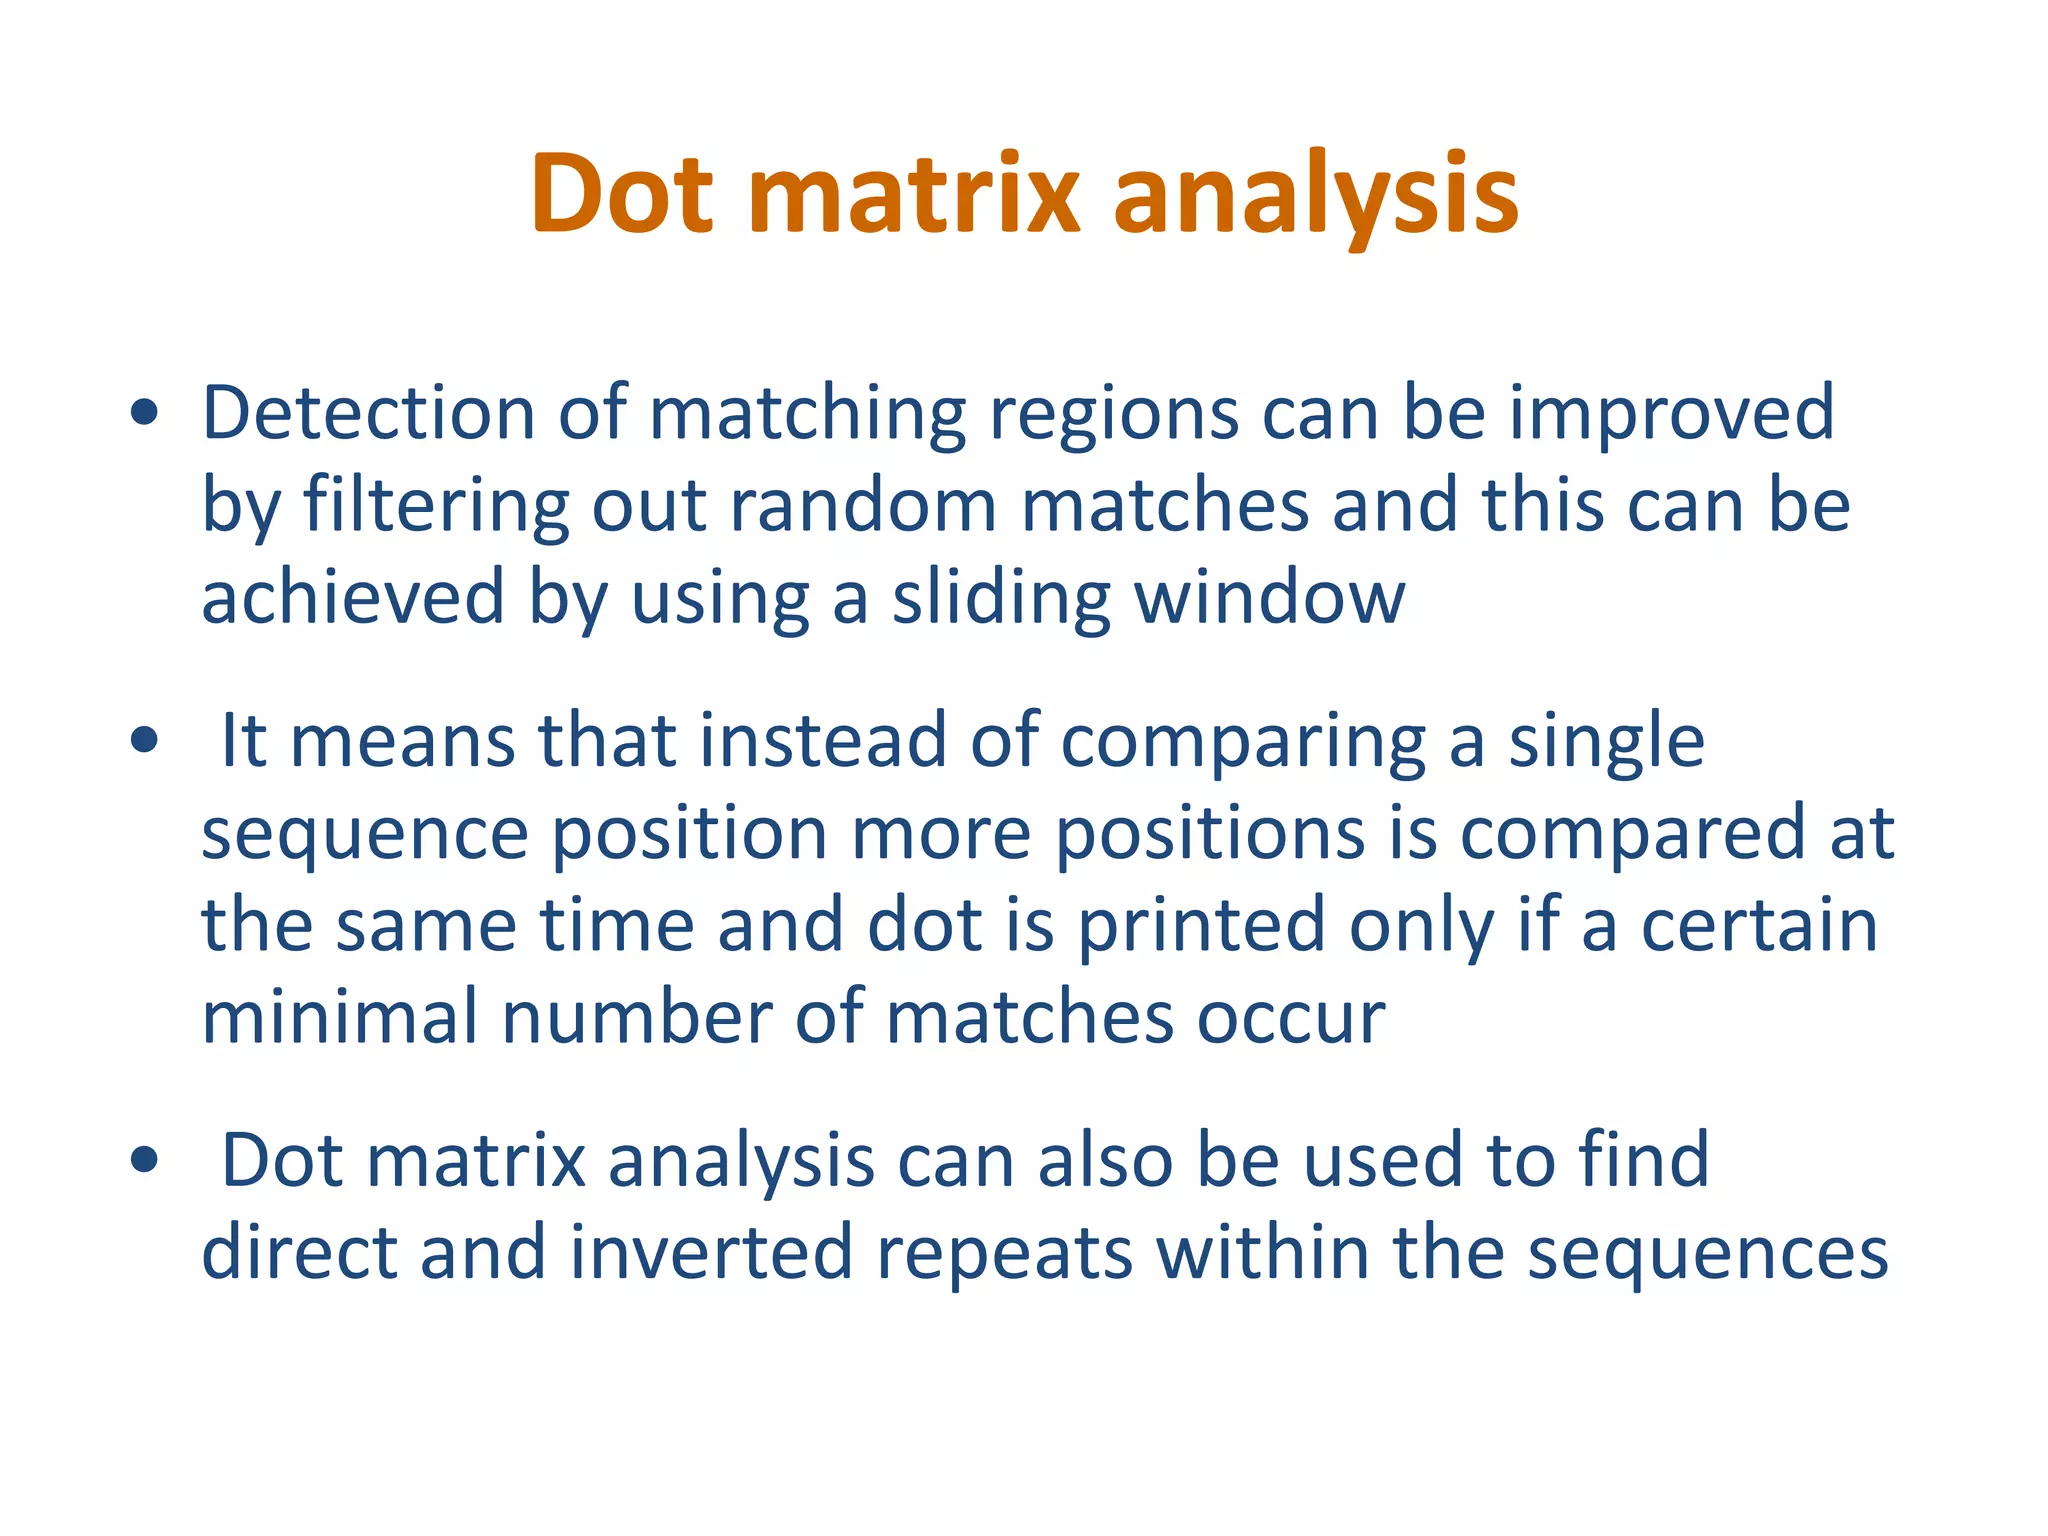
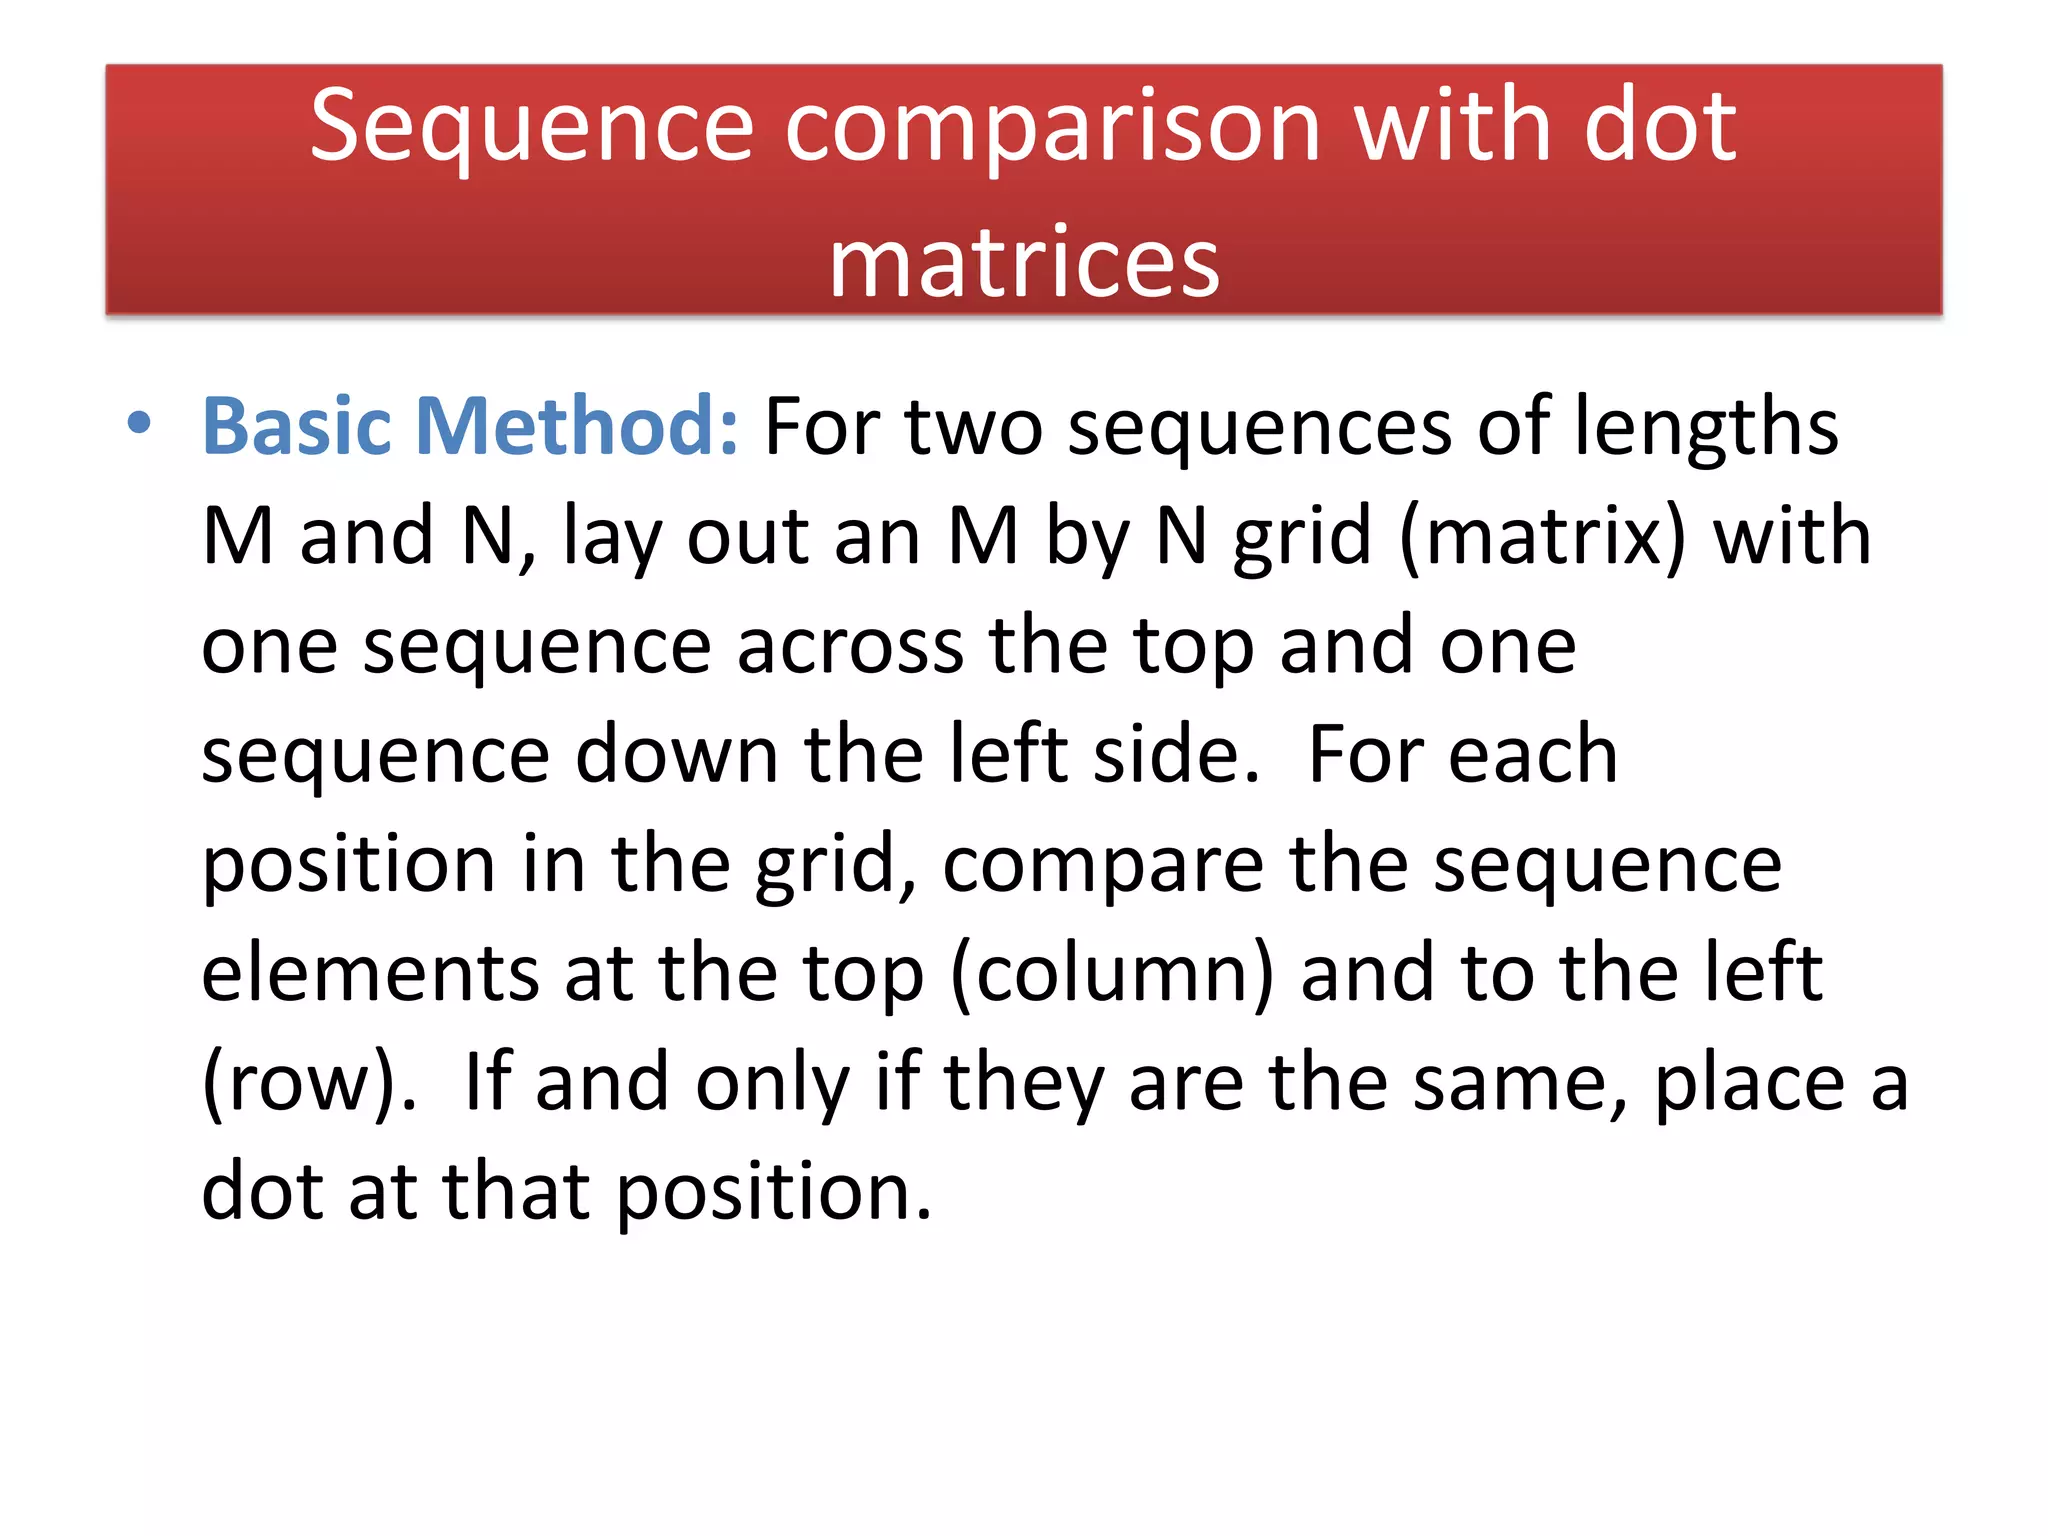
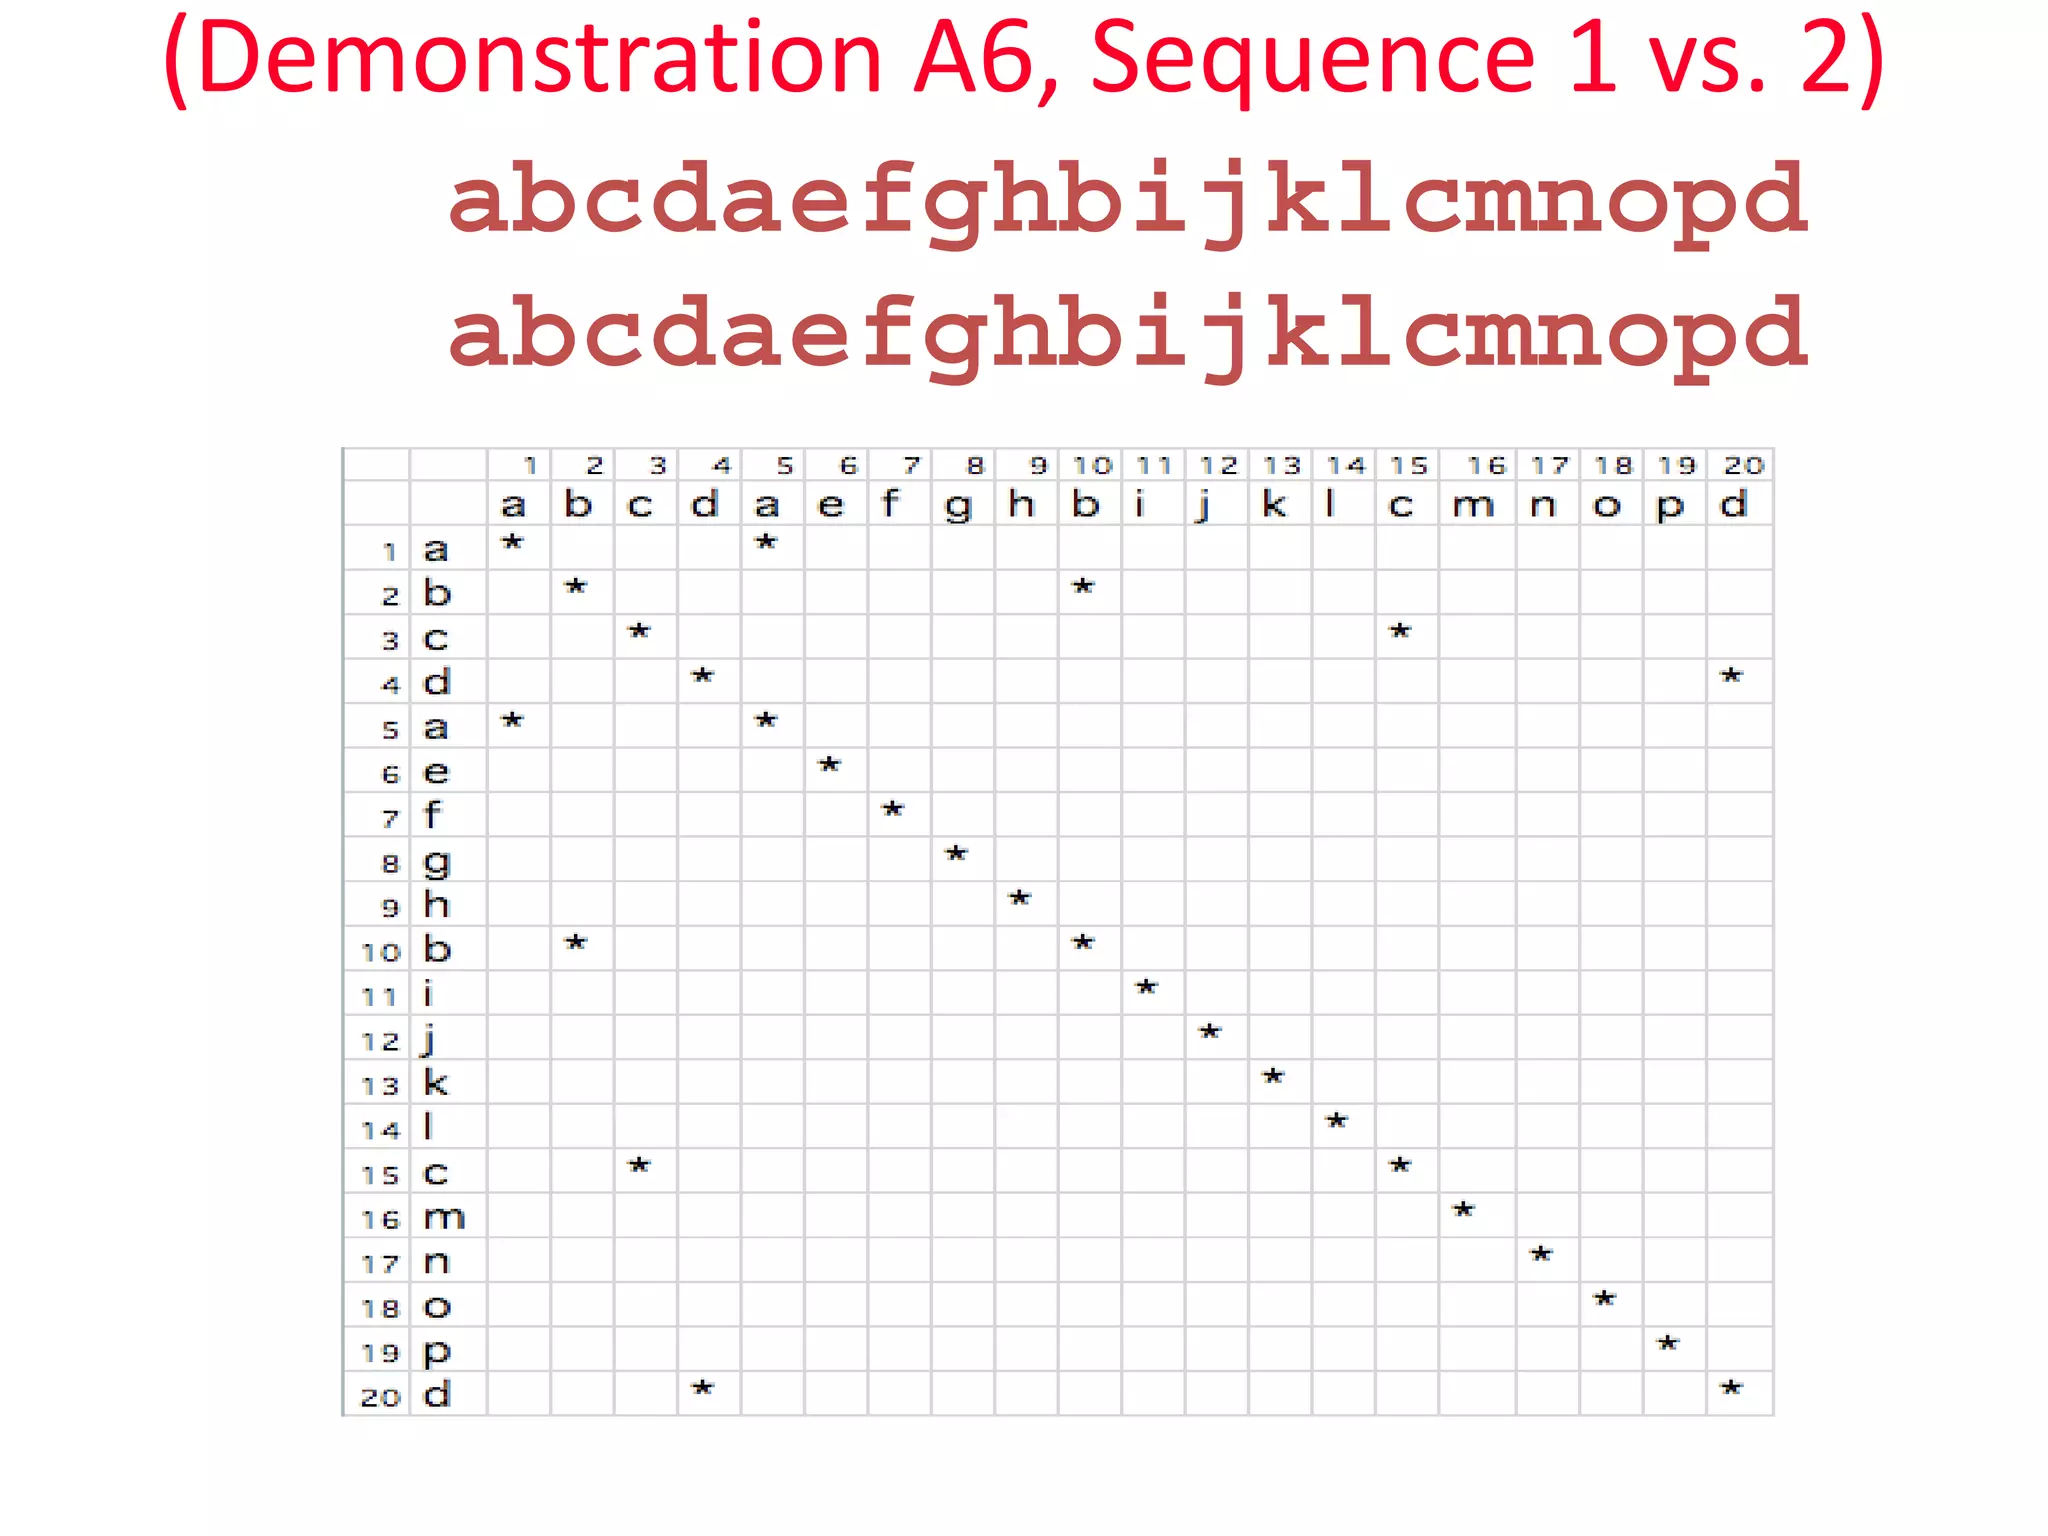
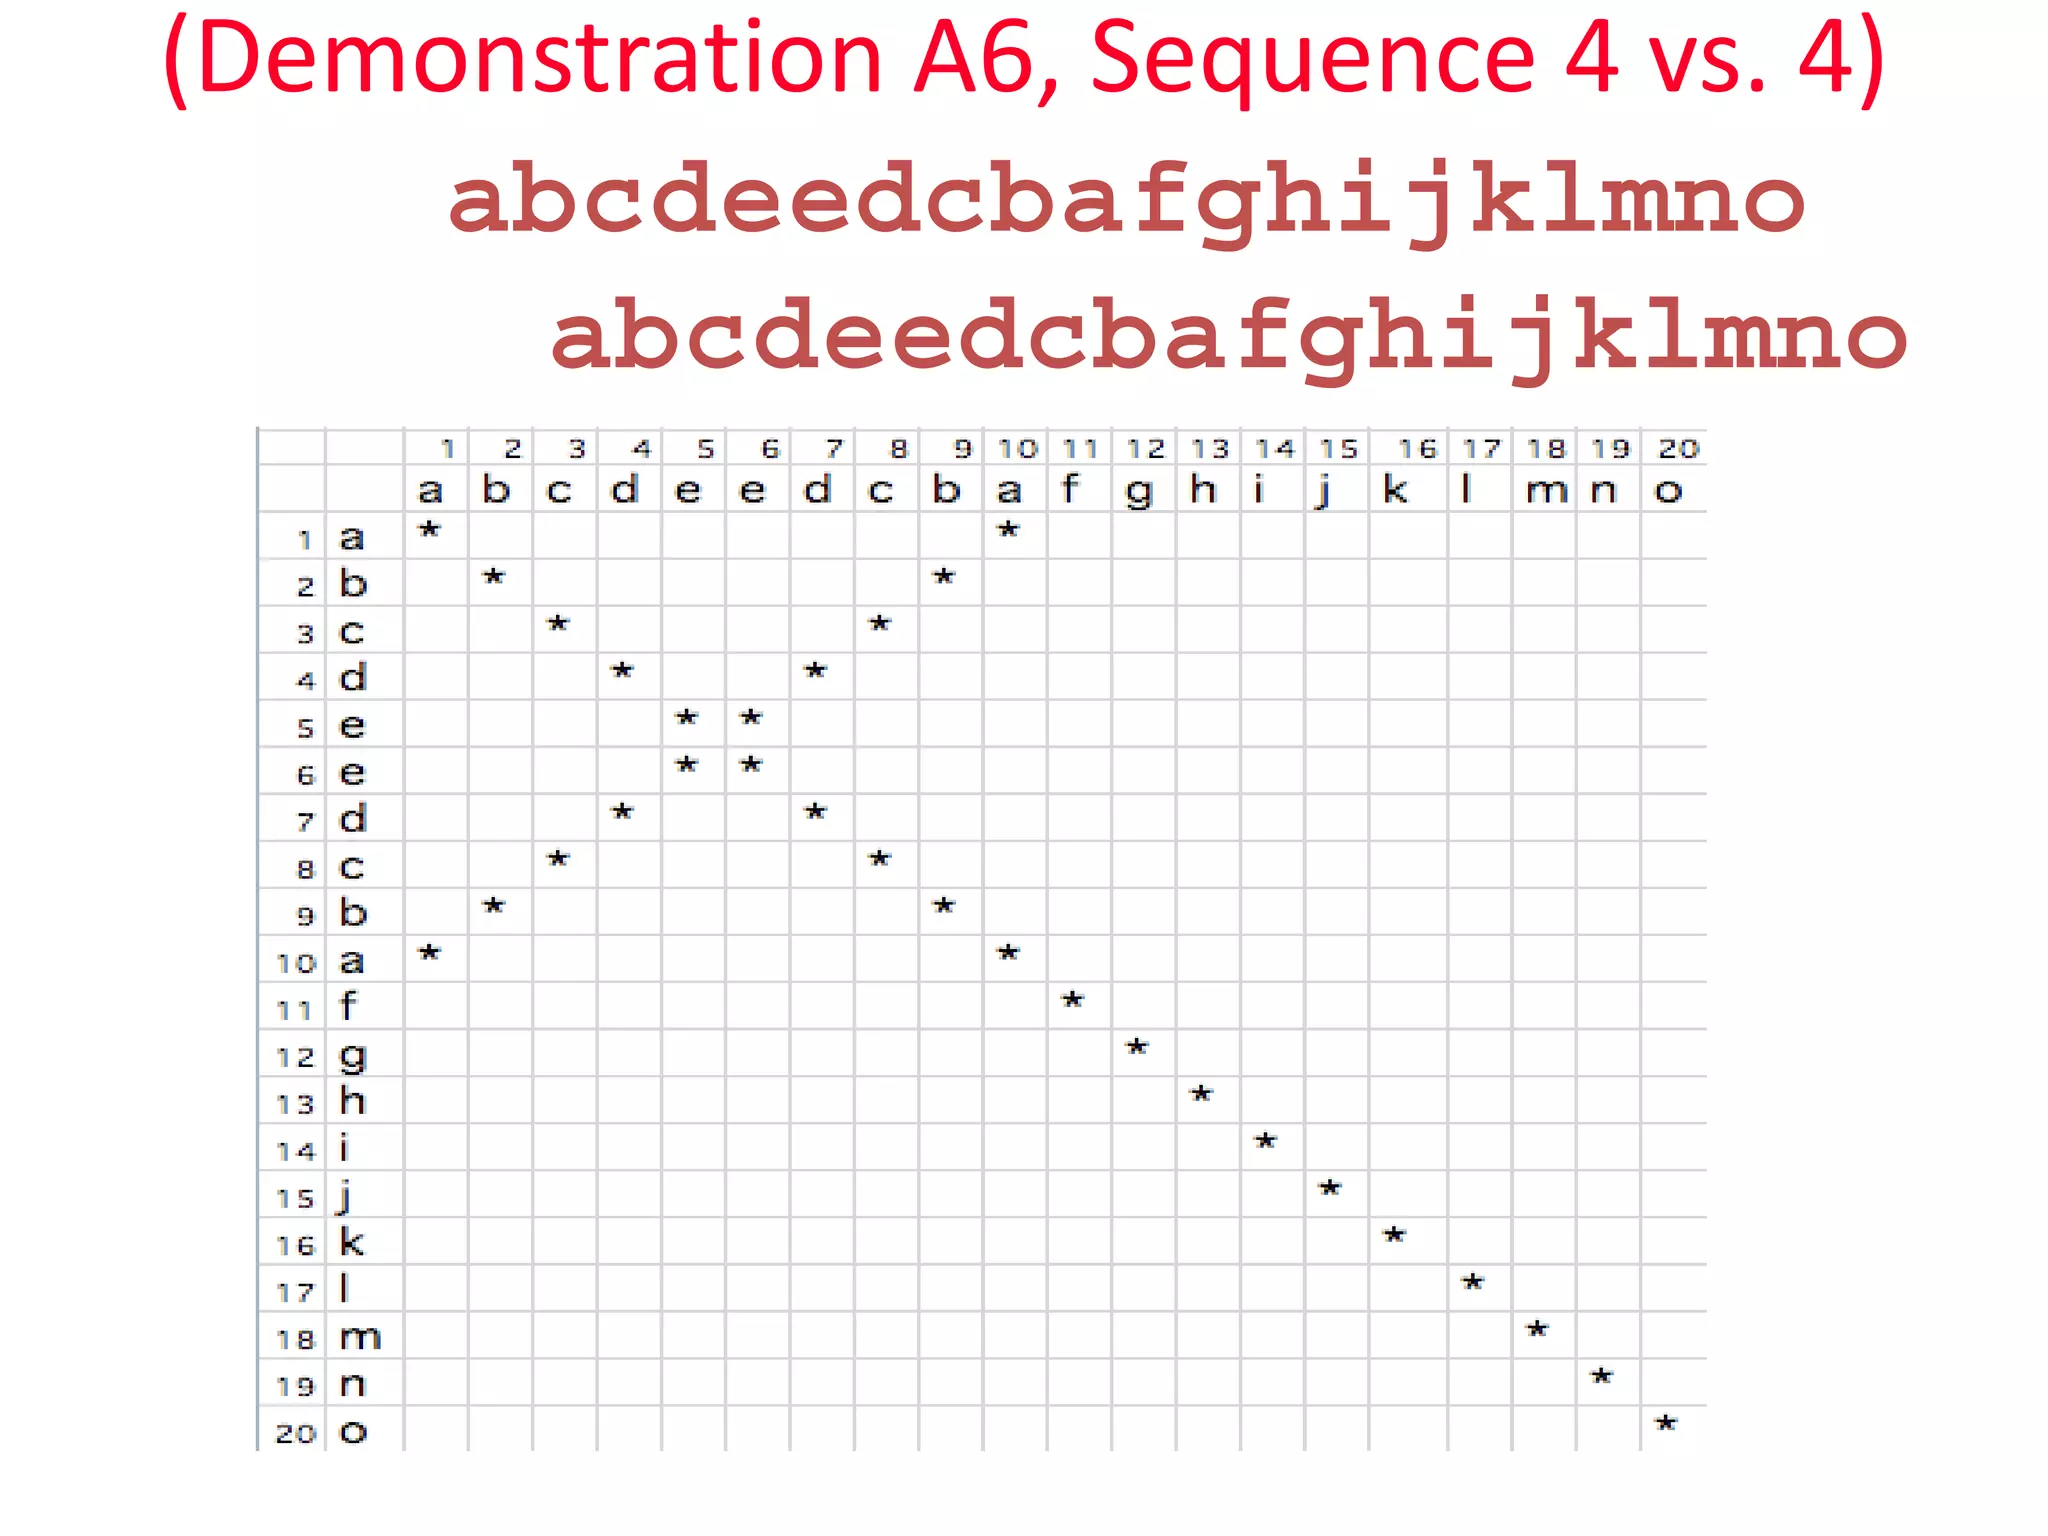
Definition of sequence alignment
• Sequence alignment is the procedure of comparing two 
(pair‐wise alignment) or more multiple sequences by 
searching for a series of individual characters or 
patterns that are in the same order in the sequences.
• There are two types of alignment: local and global. In 
global alignment, an attempt is made to align the 
entire sequence. If two sequences have approximately  
the same length and are quite similar, they are suitable 
for the global alignment.
• Local alignment concentrates on finding stretches of 
sequences with high level of matches.
Methods of sequence alignment
• Dot matrix analysis
• The dynamic programming (DP) algorithm
• Word or k‐tuple methods
Dot matrix analysis
• A dot matrix analysis is a method for comparing two sequences to 
look for possible alignment (Gibbs and McIntyre 1970)
• One sequence (A) is listed across the top of the matrix and the 
other (B) is listed down the left side
• Starting from the first character in B, one moves across the page 
keeping in the first row and placing a dot in many column where the 
character in A is the same
• The process is continued until all possible comparisons between A 
and B are made 
• Any region of similarity is revealed by a diagonal row of dots
• Isolated dots not on diagonal represent random matches
Dot matrix analysis
• Detection of matching regions can be improved 
by filtering out random matches and this can be 
achieved by using a sliding window
• It means that instead of comparing a single 
sequence position more positions is compared at 
the same time and dot is printed only if a certain 
minimal number of matches occur
• Dot matrix analysis can also be used to find 
direct and inverted repeats within the sequences
Sequence comparison with dot 
matrices
• Basic Method: For two sequences of lengths 
M and N, lay out an M by N grid (matrix) with 
one sequence across the top and one 
sequence down the left side.  For each 
position in the grid, compare the sequence 
elements at the top (column) and to the left 
(row).  If and only if they are the same, place a 
dot at that position.
(Demonstration A6, Sequence 1 vs. 2)
abcdaefghbijklcmnopd
Interpretation of dot matrices
• Regions of similarity appear as diagonal runs 
of dots
• Reverse diagonals (perpendicular to diagonal) 
indicate inversions
• Reverse diagonals crossing diagonals (Xs) 
indicate palindromes
(Demonstration A6, Sequence 4 vs. 4)
abcdeedcbafghijklmno
Interpretation of dot matrices
• Can link or "join" separate diagonals to form 
alignment with "gaps"
– Each a.a. or base can only be used once
• Can't trace vertically or horizontally
• Can't double back
– A gap is introduced by each vertical or horizontal 
skip
(Demonstration A6, Sequence 2 vs. 3)
abcdaefghbijklcmnopd
abcdefghijklmnopqrst
Uses for dot matrices
• Can use dot matrices to align two proteins or 
two nucleic acid sequences
• Can use to find amino acid repeats within a 
protein by comparing a protein sequence to 
itself.
Repeats appear as a set of diagonal runs stacked 
vertically
(Demonstration A6, Sequence 5 vs. 5)
abcdabcdabcdabcdabcd
Uses for dot matrices
• Can use to find self base‐pairing of an RNA 
(e.g., tRNA) by comparing a sequence to itself 
complemented and reversed
• Excellent approach for finding sequence 
transpositions
Filtering to remove “noise”
• A problem with dot matrices for long 
sequences is that they can be very noisy due 
to lots of insignificant matches (i.e., one A)
• Solution use a window and a threshold
– compare character by character within a window 
(have to choose window size)
– require certain fraction of matches within  
window in order to display it with a “dot”
Example spreadsheet with window
(Demonstration A7)
(Demonstration A7)
How do we choose a window size?
• Window size changes with goal of analysis
– size of average exon
– size of average protein structural element
– size of gene promoter
– size of enzyme active site
How do we choose a threshold value?
• Threshold based on statistics
– using shuffled actual sequence
• find average (m) and s.d. (σ) of match scores of shuffled 
sequence
• convert original (unshuffled) scores (x) to Z scores
– Z = (x ‐ m)/σ
• use threshold Z of of 3 to 6
– using analysis of other sets of sequences
• provides “objective” standard of significance
ADVANTAGES
• Fairly easy to Implement.
• Easy to understand visually.
• Good overview of places fot good alignment.
• It shows all possible alignment of pairs.
• It can be used in combination of other methods.
• Readily reveals the presence of 
insertions/deletions and direct and inverted 
repeats that are more difficult to find by the 
other, more automated methods
Disadvantages
Most dot matrix computer programs do not 
show an actual alignment. Does not return a 
score to indicate how ‘optimal’ a given 
alignment is (no statistical significance that 
could be tested).
Protein DataBank
• The Protein Data Bank (PDB) is a repository for the 3‐D 
structural data of large biological molecules, such 
as proteins and nucleic acids. The data, typically 
obtained by X‐ray crystallography or NMR 
spectroscopy and submitted 
by biologists andbiochemists from around the world, 
are freely accessible on the Internet via the websites of 
its member organisations (PDBe, PDBj, andRCSB). The 
PDB is overseen by an organization called 
the Worldwide Protein Data Bank, wwPDB.
• The PDB is a key resource in areas of structural biology, 
such as structural genomics
PDB ID
• A 4‐character PDB ID is assigned to each new 
structure at the time of deposition. The IDs 
are automatically assigned and do not have 
meaning. However, they serve as the unique, 
immutable identifier of each entry in the 
Protein Data Bank.
• Eg: 4HHB
Reference
• http://www.wepapers.com/Papers/79336/dot
plots.
• http://www.vivo.colostate.edu/molkit/dnadot
/
Dot matrix

Dot matrix