Download to read offline
![A large gene pool indicates extensive genetic
diversity, which is associated with robust
populations that can survive bouts of intense
selection. Meanwhile, low genetic diversity
(see inbreeding and population bottlenecks)
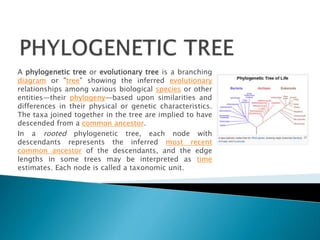
can caus Unrooted trees illustrate the
relatedness of the leaf nodes without making
assumptions about ancestry. They do not
require the ancestral root to be known or
inferred.[2] Unrooted trees can always be
generated from rooted ones by simply
omitting the root. By contrast, inferring the
root of an unrooted tree requires some
means of identifying ancestry.](https://image.slidesharecdn.com/3035-e12-141101121944-conversion-gate01/85/3035-e1-2-5-320.jpg)
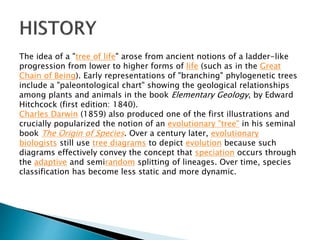
![Special tree types[edit]
This section does not cite any references or sources. Please help improve
this section by adding citations to reliable sources. Unsourced material may
be challenged and removed. (October 2012)
Fig. 3: A spindle diagram, showing the evolution of the vertebrates at class
level, width of spindles indicating number of families. Spindle diagrams are
often used in evolutionary taxonomy.
Fig. 4: A highly resolved, automatically generated tree of life, based on
completely sequenced genomes.[5][6]
A dendrogram is a broad term for the diagrammatic representation of a
phylogenetic tree.
A cladogram is a phylogenetic tree formed using cladistic methods. This
type of tree only represents a branching pattern; i.e., its branch spans do
not represent time or relative amount of character change.
A phylogram is a phylogenetic tree that has branch spans proportional to
the amount of character change.
A chronogram is a phylogenetic tree that explicitly represents evolutionary
time through its branch spans.](https://image.slidesharecdn.com/3035-e12-141101121944-conversion-gate01/85/3035-e1-2-6-320.jpg)
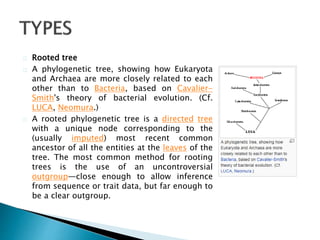
![3. Tertiary gene pool (GP-3): Members of this
gene pool are more distantly related to the
members of the primary gene pool. The
primary and tertiary gene pools can be
intermated, but gene transfer between them is
impossible without the use of "rather extreme
or radical measures" [1] such as:
◦ embryo rescue (or embryo culture, a form of plant
organ culture)
◦ induced polyploidy (chromosome doubling)
◦ bridging crosses (e.g., with members of the
secondary gene pool).](https://image.slidesharecdn.com/3035-e12-141101121944-conversion-gate01/85/3035-e1-2-7-320.jpg)
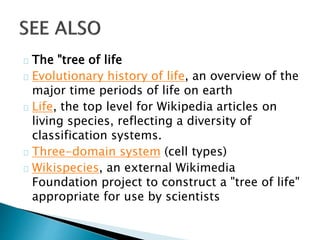
![Main article: Computational phylogenetics
Phylogenetic trees among a nontrivial number of input sequences are constructed
using computational phylogenetics methods. Distance-matrix methods such as
neighbor-joining or UPGMA, which calculate genetic distance from multiple
sequence alignments, are simplest to implement, but do not invoke an
evolutionary model. Many sequence alignment methods such as ClustalW also
create trees by using the simpler algorithms (i.e. those based on distance) of tree
construction. Maximum parsimony is another simple method of estimating
phylogenetic trees, but implies an implicit model of evolution (i.e. parsimony).
More advanced methods use the optimality criterion of maximum likelihood, often
within a Bayesian Framework, and apply an explicit model of evolution to
phylogenetic tree estimation.[4] Identifying the optimal tree using many of these
techniques is NP-hard,[4] so heuristic search and optimization methods are used in
combination with tree-scoring functions to identify a reasonably good tree that
fits the data.
Tree-building methods can be assessed on the basis of several criteria:[7]
efficiency (how long does it take to compute the answer, how much memory does
it need?)
power (does it make good use of the data, or is information being wasted?)](https://image.slidesharecdn.com/3035-e12-141101121944-conversion-gate01/85/3035-e1-2-8-320.jpg)
![Although phylogenetic trees produced on the basis of
sequenced genes or genomic data in different species can
provide evolutionary insight, they have important limitations.
They do not necessarily accurately represent the evolutionary
history of the included taxa. The data on which they are
based is noisy; the analysis can be confounded by genetic
recombination,[9] horizontal gene transfer,[10] hybridisation
between species that were not nearest neighbors on the tree
before hybridisation takes place, convergent evolution, and
conserved sequences.](https://image.slidesharecdn.com/3035-e12-141101121944-conversion-gate01/85/3035-e1-2-9-320.jpg)


Phylogenetic trees depict the evolutionary relationships among species and other taxa. They branch to show how taxa are related through inferred common ancestors. Charles Darwin popularized the concept of an evolutionary "tree" in his 1859 book On the Origin of Species. Today, phylogenetic trees effectively convey how speciation occurs through the splitting of lineages over time. Various types of phylogenetic trees exist, including rooted trees that show ancestry and unrooted trees that simply illustrate relatedness among taxa. Computational methods are used to build phylogenetic trees from genetic and genomic data, though trees have limitations and may not fully represent the evolutionary histories of included taxa.