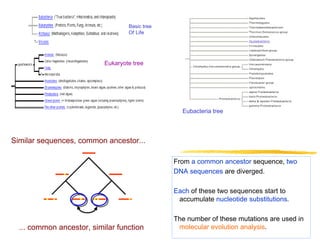
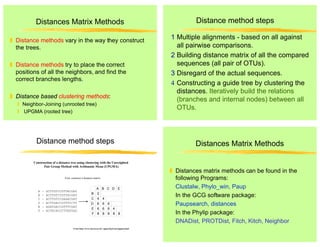
This document provides an introduction to phylogenetic analysis. It discusses key terminology like taxonomy, phylogeny, and phylogenetics. The document explains that phylogenetic analysis is used to study evolutionary relationships between organisms and sequences that are derived from a common ancestor. It also summarizes several commonly used methods for constructing phylogenetic trees from sequence data, including distance matrix methods, parsimony methods, and maximum likelihood. The document outlines factors to consider when selecting sequences for phylogenetic analysis and some known problems with multiple sequence alignments.
Transcriptomics is the study of RNA, single-stranded nucleic acid, which was not separated from the DNA world until the central dogma was formulated by Francis Crick in 1958, i.e., the idea that genetic information is transcribed from DNA to RNA and then translated from RNA into protein.
Open reading frame is part of reading frame that contains no stop codons or region of amino acids coding triple codons.
ORF starts with start codon and ends at stop codon.
Evolutionary tree or physlogenetic tree and it's types like rooted and unrooted labeled or unlabelled. How to construct physlogenetic tree and limitations of physlogenetic tree.
High throughput next generation sequencing and robust transcriptome analysis help with gene expression profiling, gene annotation or discovery of non-coding RNA.
Random amplified polymorphic DNA-RAPD.pptxNusrat Sheikh
Random Amplified Polymorphic DNA is a type of PCR in which the segments of DNA that are amplified are random.
Williams et al. (1990) developed this technique using very short primers to generate random fragments from template DNAs.
RAPD fragments can be separated and used as genetic markers or a kind of DNA fingerprinting.
Principle
The standard RAPD technology utilizes short synthetic oligonucleotides (10 bases long) of random sequences as primers to amplify nanogram amounts of total genomic DNA under low annealing temperatures by PCR. Amplification products are generally separated on agarose gels and stained with ethidium bromide.
At an appropriate annealing temperature during the thermal cycle, oligonucleotide primers of random sequence bind several priming sites on the complementary sequences in the template genomic DNA and produce discrete DNA products if these priming sites are within an amplifiable distance of each other.
The profile of amplified DNA primarily depends on nucleotide sequence homology between the template DNA and oligonucleotide primer at the end of each amplified product. Nucleotide variation between different sets of template DNAs will result in the presence or absence of bands because of changes in the priming sites.
Procedure
1. DNA is made single stranded by raising the temperature to 940C.
2. In second step, temperature is lowered to 40- 650C which results in annealing of the primer to their target sequences on the template DNA.
3. Temperature is chosen where the activity of the thermostable Taq DNA polymerase is optimal.
4. The polymerase now extends the 3’ ends of the DNA primer hybrids towards the outer primer binding site.
5. Repeating these three step cycles 40 to 50 times results in the exponential amplification of the target between the 5’ ends of the two primer binding sites.
6. Amplification products are separated by gel electrophoresis and visualized by ethidium bromide staining.
A phylogenetic tree is a model about the evolutionary relationship between operational taxonomic units(OTUs) based on homologous character.
Dandrogram: general term for a branching diagram
Cladogram: branching diagram without branch length estimates
Phylogram or phylogenetic tree: branching diagram with branch length estimates
A tree is composed of nodes and branches & one bracnch connects any two adjacent nodes. Nodes represent the taxonomic units.
E.G. Two very similar sequence will be neighbours on the outer branches and will be connected by a common internal branch.
Unit 2: Phylogeny
LECTURE LEARNING GOALS
1. Define phylogeny, and describe what a phylogenetic tree can reveal about the species it models.
2. Describe how to construct a phylogenetic tree, and the complexities that create mistakes.
3. Explain how to root a tree, and contrast how to root the tree of life.
A phylogenetic tree is a diagram that represents evolutionary relationships among organisms based on the similarities and differences in their genetic and evolutionary characteristics
The pattern of branching in a phylogenetic tree reflects how species or other groups evolved from a series of common ancestors.
The phylogenetic tree is also called the “Tree of Life” or “Dendrogram”
Ethanol (CH3CH2OH), or beverage alcohol, is a two-carbon alcohol
that is rapidly distributed in the body and brain. Ethanol alters many
neurochemical systems and has rewarding and addictive properties. It
is the oldest recreational drug and likely contributes to more morbidity,
mortality, and public health costs than all illicit drugs combined. The
5th edition of the Diagnostic and Statistical Manual of Mental Disorders
(DSM-5) integrates alcohol abuse and alcohol dependence into a single
disorder called alcohol use disorder (AUD), with mild, moderate,
and severe subclassifications (American Psychiatric Association, 2013).
In the DSM-5, all types of substance abuse and dependence have been
combined into a single substance use disorder (SUD) on a continuum
from mild to severe. A diagnosis of AUD requires that at least two of
the 11 DSM-5 behaviors be present within a 12-month period (mild
AUD: 2–3 criteria; moderate AUD: 4–5 criteria; severe AUD: 6–11 criteria).
The four main behavioral effects of AUD are impaired control over
drinking, negative social consequences, risky use, and altered physiological
effects (tolerance, withdrawal). This chapter presents an overview
of the prevalence and harmful consequences of AUD in the U.S.,
the systemic nature of the disease, neurocircuitry and stages of AUD,
comorbidities, fetal alcohol spectrum disorders, genetic risk factors, and
pharmacotherapies for AUD.
MANAGEMENT OF ATRIOVENTRICULAR CONDUCTION BLOCK.pdfJim Jacob Roy
Cardiac conduction defects can occur due to various causes.
Atrioventricular conduction blocks ( AV blocks ) are classified into 3 types.
This document describes the acute management of AV block.
- Video recording of this lecture in English language: https://youtu.be/lK81BzxMqdo
- Video recording of this lecture in Arabic language: https://youtu.be/Ve4P0COk9OI
- Link to download the book free: https://nephrotube.blogspot.com/p/nephrotube-nephrology-books.html
- Link to NephroTube website: www.NephroTube.com
- Link to NephroTube social media accounts: https://nephrotube.blogspot.com/p/join-nephrotube-on-social-media.html
TEST BANK for Operations Management, 14th Edition by William J. Stevenson, Ve...kevinkariuki227
TEST BANK for Operations Management, 14th Edition by William J. Stevenson, Verified Chapters 1 - 19, Complete Newest Version.pdf
These lecture slides, by Dr Sidra Arshad, offer a quick overview of physiological basis of a normal electrocardiogram.
Learning objectives:
1. Define an electrocardiogram (ECG) and electrocardiography
2. Describe how dipoles generated by the heart produce the waveforms of the ECG
3. Describe the components of a normal electrocardiogram of a typical bipolar leads (limb II)
4. Differentiate between intervals and segments
5. Enlist some common indications for obtaining an ECG
Study Resources:
1. Chapter 11, Guyton and Hall Textbook of Medical Physiology, 14th edition
2. Chapter 9, Human Physiology - From Cells to Systems, Lauralee Sherwood, 9th edition
3. Chapter 29, Ganong’s Review of Medical Physiology, 26th edition
4. Electrocardiogram, StatPearls - https://www.ncbi.nlm.nih.gov/books/NBK549803/
5. ECG in Medical Practice by ABM Abdullah, 4th edition
6. ECG Basics, http://www.nataliescasebook.com/tag/e-c-g-basics
Anti ulcer drugs and their Advance pharmacology ||
Anti-ulcer drugs are medications used to prevent and treat ulcers in the stomach and upper part of the small intestine (duodenal ulcers). These ulcers are often caused by an imbalance between stomach acid and the mucosal lining, which protects the stomach lining.
||Scope: Overview of various classes of anti-ulcer drugs, their mechanisms of action, indications, side effects, and clinical considerations.
Report Back from SGO 2024: What’s the Latest in Cervical Cancer?bkling
Are you curious about what’s new in cervical cancer research or unsure what the findings mean? Join Dr. Emily Ko, a gynecologic oncologist at Penn Medicine, to learn about the latest updates from the Society of Gynecologic Oncology (SGO) 2024 Annual Meeting on Women’s Cancer. Dr. Ko will discuss what the research presented at the conference means for you and answer your questions about the new developments.
Title: Sense of Taste
Presenter: Dr. Faiza, Assistant Professor of Physiology
Qualifications:
MBBS (Best Graduate, AIMC Lahore)
FCPS Physiology
ICMT, CHPE, DHPE (STMU)
MPH (GC University, Faisalabad)
MBA (Virtual University of Pakistan)
Learning Objectives:
Describe the structure and function of taste buds.
Describe the relationship between the taste threshold and taste index of common substances.
Explain the chemical basis and signal transduction of taste perception for each type of primary taste sensation.
Recognize different abnormalities of taste perception and their causes.
Key Topics:
Significance of Taste Sensation:
Differentiation between pleasant and harmful food
Influence on behavior
Selection of food based on metabolic needs
Receptors of Taste:
Taste buds on the tongue
Influence of sense of smell, texture of food, and pain stimulation (e.g., by pepper)
Primary and Secondary Taste Sensations:
Primary taste sensations: Sweet, Sour, Salty, Bitter, Umami
Chemical basis and signal transduction mechanisms for each taste
Taste Threshold and Index:
Taste threshold values for Sweet (sucrose), Salty (NaCl), Sour (HCl), and Bitter (Quinine)
Taste index relationship: Inversely proportional to taste threshold
Taste Blindness:
Inability to taste certain substances, particularly thiourea compounds
Example: Phenylthiocarbamide
Structure and Function of Taste Buds:
Composition: Epithelial cells, Sustentacular/Supporting cells, Taste cells, Basal cells
Features: Taste pores, Taste hairs/microvilli, and Taste nerve fibers
Location of Taste Buds:
Found in papillae of the tongue (Fungiform, Circumvallate, Foliate)
Also present on the palate, tonsillar pillars, epiglottis, and proximal esophagus
Mechanism of Taste Stimulation:
Interaction of taste substances with receptors on microvilli
Signal transduction pathways for Umami, Sweet, Bitter, Sour, and Salty tastes
Taste Sensitivity and Adaptation:
Decrease in sensitivity with age
Rapid adaptation of taste sensation
Role of Saliva in Taste:
Dissolution of tastants to reach receptors
Washing away the stimulus
Taste Preferences and Aversions:
Mechanisms behind taste preference and aversion
Influence of receptors and neural pathways
Impact of Sensory Nerve Damage:
Degeneration of taste buds if the sensory nerve fiber is cut
Abnormalities of Taste Detection:
Conditions: Ageusia, Hypogeusia, Dysgeusia (parageusia)
Causes: Nerve damage, neurological disorders, infections, poor oral hygiene, adverse drug effects, deficiencies, aging, tobacco use, altered neurotransmitter levels
Neurotransmitters and Taste Threshold:
Effects of serotonin (5-HT) and norepinephrine (NE) on taste sensitivity
Supertasters:
25% of the population with heightened sensitivity to taste, especially bitterness
Increased number of fungiform papillae
1. Introduction to
Phylogenetic Analysis
Irit Orr
Subjects of this lecture
1 Introducing some of the terminology of
phylogenetics.
2 Introducing some of the most commonly
used methods for phylogenetic analysis.
3 Explain how to construct phylogenetic
trees.
Taxonomy - is the science of
classification of organisms.
Phylogeny - is the evolution of a
genetically related group of organisms.
Or: a study of relationships between
collection of "things" (genes, proteins,
organs..) that are derived from a common
ancestor.
Phylogenetics - WHY?
¾ Find evolutionary ties between organisms.
(Analyze changes occuring in different organisms
during evolution).
¾ Find (understand) relationships between an
ancestral sequence and it descendants.
(Evolution of family of sequences)
¾ Estimate time of divergence between a group of
organisms that share a common ancestor.
2. Basic tree
Of Life
Eukaryote tree
Eubacteria tree
Similar sequences, common ancestor...
... common ancestor, similar function
From a common ancestor sequence, two
DNA sequences are diverged.
Each of these two sequences start to
accumulate nucleotide substitutions.
The number of these mutations are used in
molecular evolution analysis.
3. How we calculate the
Degree of Divergence
If two sequences of length N differ from
each other at n sites, then their degree of
divergence is:
n/N or n/N*100%.
Relationships of Phylogenetic
Analysis and Sequences Analysis
When 2 sequences found in 2 organisms are
very similar, we assume that they have derived
from one ancestor.
AAGAATC AAGAGTT
AAGA(A/G)T(C/ T)
The sequences alignment reveal which positions are
conserved from the ancestor sequence.
Relationships of Phylogenetic
Analysis and Sequences Analysis
The progressive multiple alignment of a group of
sequences, first aligns the most similar pair.
Then it adds the more distant pairs.
The alignment is influenced by the “most
similar” pairs and arranged accordingly, but….it
does not always correctly represent the
evolutionary history of the occured changes.
Not all phylogenetic methods work this way.
Relationships of Phylogenetic
Analysis and Sequences Analysis
Most phylogenetic methods assume that each
position in a sequence can change
independently from the other positions.
Gaps in alignments represent mutations in
sequences such as: insertion, deletion, genetic
rearrangments.
Gaps are treated in various ways by the
phylogenetic methods. Most of them ignore
gaps.
4. Relationships of Phylogenetic
Analysis and Sequences Analysis
Another approach to treat gaps is by using
sequences similarity scores as the base
for the phylogenetic analysis, instead of
using the alignment itself, and trying to
decide what happened at each position.
The similarity scores based on scoring
matrices (with gaps scores) are used by
the DISTANCE methods.
What is a phylogenetic tree?
An illustration of the evolutionary
relationships among a group of organisms.
Dendrogram is another name for a
phylogenetic tree.
A tree is composed of nodes and branches.
One branch connects any two adjacent
nodes. Nodes represent the taxonomic
units. (sequences)
What is a phylogenetic tree?
™ E.G: 2 very similar sequences will be
neighbors on the outer branches and will be
connected by a common internal branch.
Trees
Types of Trees
Networks
Only one path between
any pair of nodes
More than one path
between any pair of
nodes
seqA
seqB
seqC
seqD
Leaves = Outer branches
Represent the taxa (sequences)
1
2
3
Nodes = 1 2 3
Represent the relationships
Among the taxa (sequences)
e.g Node 1 represent the ancestor
seq from which seqA and seqB derived.
*
*
*
Branches *
The length of the branch represent
the # of changes that occurred in the
seqs prior to the next level of separation.
Rooted Phylogenetic Tree
5. E
D
C
B
A
F
H
I
G
External branches - are branches
that end with a tip.
(FA,FB,GC,GD,IE)
more recent diversions
Internal branches - are
branches that do not end
with a tip.
(IH,HF,HG)
more ancient diversions
In a phylogenetic tree...
9 Each NODE represents a speciation event in
evolution. Beyond this point any sequence
changes that occurred are specific for each
branch (specie).
9 The BRANCH connects 2 NODES of the tree.
The length of each BRANCH between one
NODE to the next, represents the # of changes
that occurred until the next separation
(speciation).
In a phylogenetic tree...
9 NOTE: The amount of evolutionary time that
passed from the separation of the 2 sequences
is not known. The phylogenetic analysis can only
estimate the # of changes that occurred from the
time of separation.
9 After the branching event, one taxon (sequence)
can undergo more mutations then the other
taxon.
9 Topology of a tree is the branching pattern of a
tree.
Tree structure
♠Terminal nodes - represent the data (e.g
sequences) under comparison
(A,B,C,D,E), also known as OTUs,
(Operational Taxonomic Units).
♠Internal nodes - represent inferred
ancestral units (usually without empirical
data), also known as HTUs, (Hypothetical
Taxonomic Units).
6. Slide taken from Dr. Itai Yanai
Different kinds of trees can be used to
depict different aspects of evolutionary history
1. Cladogram:
simply shows relative recency of common ancestry
2. Additive trees:
a cladogram with branch lengths,
also called phylograms and metric trees
3. Ultrametric trees:
(dendograms) special kind of additive tree in which the
tips of the trees are all equidistant from the root
5
4
3
1
3
7
3
2
1
1 1 1 1
2
3
1
1
1
3
The Molecular Clock Hypothesis
All the mutations occur in the same rate in all
the tree branches.
The rate of the mutations is the same for all
positions along the sequence.
The Molecular Clock Hypothesis is most suitable for
closely related species.
Rooted Tree = Cladogram
A phylogenetic tree that
all the "objects" on it
share a known common
ancestor (the root).
There exists a particular
root node.
The paths from the root
to the nodes
correspond to
evolutionary time.
A
B
C
Root
A phylogenetic tree where all
the "objects" on it are related
descendants - but there is
not enough information to
specify the common
ancestor (root).
The path between nodes of
the tree do not specify an
evolutionary time.
B
Unrooted Tree = Phenogram
7. Slide taken from Dr. Itai Yanai
Types of Trees
Rooted vs. Unrooted
2M – 3 2M – 2
2M – 1
2M – 2
Total
Unrooted
Total
Rooted
M – 2
M – 3
Interior
M – 1
M – 2
Interior
Nodes
Branches
M is the number of OTU’s
Rooted versus Unrooted
™The number of tree topologies of rooted
tree is much higher than that of the
unrooted tree for the same number of
OTUs.
™Therefore, the error of the unrooted tree
topology is smaller than that of the rooted
tree.
Possible Number of
Rooted trees Unrooted
trees
2 1 1
3 3 1
4 1 5 3
5 105 1 5
6 945 105
7 10395 945
8 135135 10395
9 2027025 135135
1 0 34459425 2027025
The number of rooted and unrooted trees:
Number
of OTU’s
OTU – Operational Taxonomical Unit
Slide taken from Dr. Itai Yanai
Orthologs - genes related by speciation
events. Meaning same genes in different
species.
Paralogs - genes related by duplication
events. Meaning duplicated genes in the
same species.
8. Selecting sequences for phylogenetic
analysis
What type of sequence to use, Protein or
DNA?
The rate of mutation is assumed to be the
same in both coding and non-coding
regions.
However, there is a difference in the
substitution rate.
Selecting sequences for phylogenetic
analysis
™Non-coding DNA regions have more
substitution than coding regions.
™Proteins are much more conserved since
they "need" to conserve their function.
So it is better to use sequences that
mutate slowly (proteins) than DNA.
However, if the genes are very small, or
they mutate slowly, we can use them for
building the trees.
Known Problems of Multiple Alignments
Important sites could be misaligned by the
software used for the sequence alignment.
That will effect the significance of the site -
and the tree.
For example: ATG as start codon, or specific
amino acids in functional domains.
Gaps - Are treated differently by different
alignment programs and should play no
part in building trees.
Alignment of a coding region should be compared with
the alignment of their protein sequences, to be sure about
the placement of gaps.
T Y R R S R ACA TAC AGG CGA
T Y R R
T Y R R S R ACA TAC AGG CGA
T Y R R
T Y R - S R ACA TAC AGG ---
T Y R -
T Y R - S R ACA TAC --- CGA
T Y - R
T Y R R S R ACA TAC AGG CGA
T Y R R
9. Known Problems of Multiple Alignments
♥ Low complexity regions - effect the multiple
alignment because they create random bias
for various regions of the alignment.
♥ Low complexity regions should be removed
from the alignment before building the tree.
If you delete these regions you need to
consider the affect of the deletions on the
branch lengths of the whole tree.
Selecting sequences for phylogenetic
analysis
‡ Sequences that are being compared belong
together (orthologs).
‡ If no ancestral sequence is available you may
use an "outgroup" as a reference to measure
distances. In such a case, for an outgroup you
need to choose a close relative to the group
being compared.
‡ For example: if the group is of mammalian
sequences then the outgroup should be a sequence
from birds and not plants.
How to choose a phylogenetic method?
Choose set of related seqs
(DNA or Proteins
Obtain MultipleAlignment
Is there a strong similarity?
Strong similarity
Maximum Parsimony
Distant (weak) similarity
Distance methods
Very weak similarity
Maximum Likelihood
Check validity of the
results
Taken from Dr.Itai Yanai
A - GCTTGTCCGTTACGAT
B – ACTTGTCTGTTACGAT
C – ACTTGTCCGAAACGAT
D - ACTTGACCGTTTCCTT
E – AGATGACCGTTTCGAT
F - ACTACACCCTTATGAG
Given a multiple alignment, how do we construct the tree?
?
10. Building Phylogenetic Trees
Main methods:
¾Distances matrix methods
Neighbour Joining, UPGMA
¾Character based methods:
Parsimony methods
Maximum Likelihood method
¾Validation method:
Bootstrapping
Jack Knife
Statistical Methods
9 Bootstrapping Analysis –
Is a method for testing how good a dataset fits a
evolutionary model.
This method can check the branch arrangement
(topology) of a phylogenetic tree.
In Bootstrapping, the program re-samples
columns in a multiple aligned group of
sequences, and creates many new alignments,
(with replacement the original dataset).
These new sets represent the population.
Statistical Methods
The process is done at least 100 times.
Phylogenetic trees are generated from all the
sets.
Part of the results will show the # of times a
particular branch point occurred out of all the
trees that were built.
The higher the # - the more valid the
branching point.
Taken from Dr. Itai Yanai
Chimpanzee
Gorilla
Human
Orang-utan
Gibbon
Given the following tree, estimate the confidence of
the two internal branches
11. Taken from Dr. Itai Yanai
Chimpanzee
Chimpanzee
Chimpanzee
Gorilla
Gorilla
Gorilla
Human
Human Human
Orang-utan
Orang-utan Orang-utan
Gibbon
Gibbon
Gibbon
41/100 28/100 31/100
Chimpanzee
Gorilla
Human
Orang-utan
Gibbon
100
41
Estimating Confidence from the Resamplings
1. Of the 100 trees:
In 100 of the 100 trees,
gibbon and orang-utan
are split from the rest.
In 41 of the 100 trees,
chimp and gorilla are
split from the rest.
2. Upon the original tree we superimpose bootstrap values:
Statistical Methods
Bootstrap values between 90-100 are
considered statistically significant
Character Based Methods
All Character Based Methods assume that
each character substitution is independent
of its neighbors.
ƒ Maximum Parsimony (minimum evolution)
- in this method one tree will be given
(built) with the fewest changes required to
explain (tree) the differences observed in
the data.
Character Based Methods
Q: How do you find the minimum # of changes
needed to explain the data in a given tree?
A: The answer will be to construct a set of possible
ways to get from one set to the other, and choose
the "best". (for example: Maximum Parsimony)
CCGCCACGA
P P R
CGGCCACGA
R P R
12. Character Based Methods - Maximum
Parsimony
∞Not all sites are informative in parsimony.
∞Informative site, is a site that has at least 2
characters, each appearing at least in 2 of
the sequences of the dataset.
123456789012345678901
Mouse CTTCGTTGGATCAGTTTGATA
Rat CCTCGTTGGATCATTTTGATA
Dog CTGCTTTGGATCAGTTTGAAC
Human CCGCCTTGGATCAGTTTGAAC
------------------------------------
Invariant * * ******** *****
Variant ** * * **
------------------------------------
Informative ** **
Non-inform. * *
Start by classifying the sites:
Maximum Parsimony
Taken from
Dr. Itai Yanai
123456789012345678901
Mouse CTTCGTTGGATCAGTTTGATA
Rat CCTCGTTGGATCATTTTGATA
Dog CTGCTTTGGATCAGTTTGAAC
Human CCGCCTTGGATCAGTTTGAAC
** *
Mouse
Rat
Dog
Human
Mouse
Rat
Dog
Human
Mouse Rat
Dog Human
Mouse
Rat
Dog
Human
Mouse
Rat
Dog
Human
Mouse Rat
Dog Human
Mouse
Rat
Dog
Human
Mouse
Rat
Dog
Human
Mouse Rat
Dog Human
Site 5:
G
G
T
C
T
T
T
C
T
C
G
G
T
G
T
C
G
T
G
C
T
C
T
G
G
T
T
T
T
G
G
C
C
C
T
G
G
G
C
C
G
G
G
G
C
T
G
G
T
G
C
C
G
T
Site 2:
Site 3:
Taken from
Dr. Itai Yanai
123456789012345678901
Mouse CTTCGTTGGATCAGTTTGATA
Rat CCTCGTTGGATCATTTTGATA
Dog CTGCTTTGGATCAGTTTGAAC
Human CCGCCTTGGATCAGTTTGAAC
Informative ** **
Mouse
Rat
Dog
Human
Mouse
Rat
Dog
Human
Mouse Rat
Dog Human
3 0 1
Maximum Parsimony
Taken from
Dr. Itai Yanai
13. Character Based Methods - Maximum
Parsimony
∞ The Maximum Parsimony method is good for
similar sequences, a sequences group with
small amount of variations
Maximum Parsimony methods do not give the
branch lengths only the branch order.
For larger set it is recommended to use
the “branch and bound” method instead
Of Maximum Parsimony.
Maximum Parsimony Methods are
Available…
¾For DNA in Programs:
paup, molphy,phylo_win
In the Phylip package:
DNAPars, DNAPenny, etc..
¾For Protein in Programs:
paup, molphy,phylo_win
In the Phylip package:
PROTPars
Character Based Methods -
Maximum Likelihood
Basic idea of Maximum Likelihood method is
building a tree based on mathemaical model.
This method find a tree based on probability
calculations that best accounts for the large
amount of variations of the data (sequences)
set.
Maximum Likelihood method (like the Maximum
Parsimony method) performs its analysis on
each position of the multiple alignment.
This is why this method is very heavy on CPU.
Character Based Methods -
Maximum Likelihood
Maximum Likelihood method – using a tree
model for nucleotide substitutions, it will try to
find the most likely tree (out of all the trees of
the given dataset).
The Maximum Likelihood methods are very slow
and cpu consuming.
Maximum Likelihood methods can be found in
phylip, paup or puzzle.
14. Maximum Likelihood method
Are available in the Programs:
paup or puzzle
In phylip package in programs:
DNAML and DNAMLK
Character Based Methods
The Maximum Likelihood methods are
very slow and cpu consuming (computer
expensive).
Maximum Likelihood methods can be
found in phylip, paup or puzzle.
Distances Matrix Methods
Distance methods assume a molecular clock,
meaning that all mutations are neutral and
therefore they happen at a random clocklike
rate.
This assumption is not true for several reasons:
Different environmental conditions affect mutation
rates.
This assumption ignores selection issues which are
different with different time periods.
Distances Matrix Methods
Distance - the number of substitutions per site per
time period.
Evolutionary distance are calculated based on one
of DNA evolutionary models.
Neighbors – pairs of sequences that have the
smallest number of substitutions between them.
On a phylogenetic tree, neighbors are joined by a
node (common ancestor).
15. Distances Matrix Methods
Distance methods vary in the way they construct
the trees.
Distance methods try to place the correct
positions of all the neighbors, and find the
correct branches lengths.
Distance based clustering methods:
Neighbor-Joining (unrooted tree)
UPGMA (rooted tree)
Distance method steps
1 Multiple alignments - based on all against
all pairwise comparisons.
2 Building distance matrix of all the compared
sequences (all pair of OTUs).
3 Disregard of the actual sequences.
4 Constructing a guide tree by clustering the
distances. Iteratively build the relations
(branches and internal nodes) between all
OTUs.
Distance method steps
Construction of a distance tree using clustering with the Unweighted
Pair Group Method with Arithmatic Mean (UPGMA)
A B C D E
B 2
C 4 4
D 6 6 6
E 6 6 6 4
F 8 8 8 8 8
From http://www.icp.ucl.ac.be/~opperd/private/upgma.html
A - GCTTGTCCGTTACGAT
B – ACTTGTCTGTTACGAT
C – ACTTGTCCGAAACGAT
D - ACTTGACCGTTTCCTT
E – AGATGACCGTTTCGAT
F - ACTACACCCTTATGAG
First, construct a distance matrix:
Distances Matrix Methods
Distances matrix methods can be found in the
following Programs:
Clustalw, Phylo_win, Paup
In the GCG software package:
Paupsearch, distances
In the Phylip package:
DNADist, PROTDist, Fitch, Kitch, Neighbor
16. Mutations as data source for
evolutionary analysis
Mutation - an error in DNA replication or
DNA repair.
Only mutations that occur in germline
cells play a rule in evolution. However, in
some organisms there is no distinction
between germline or somatic mutation.
Only mutations that were fixed in the
population are called substitutions.
Correction of Distances between
DNA sequences
In order to detect changes in DNA
sequences we compare them to each
other.
We assume that each observed change in
similar sequences, represent a “single
mutation event”.
The greater the number of changes, the
more possible types of mutations.
Original Sequence
A
C
T
G
A
A
C
G
T
A
A
C
T
G
A > C > T
A
C > G
G
T > A
A
C > A
T
G
A
A
C > A
G
T > A
Single Substitution
Parallel Substitution
Multiple
Substitution
coincidental Substitution
Mutations - Substitutions
Q: What do we measure by sequence alignment?
A: Substitutions in the aligned sequences.
The rate of substitution in regions that
evolve under no constraints are assumed
to be equal to the mutation rate.
17. Mutations - Substitutions
Point mutation - mutation in a single
nucleotide.
Segmental mutation - mutation in several
adjacent nucleotides.
Substitution mutation - replacement of one
nucleotide with another.
Recombination - exchange of a sequence
with another.
Mutations
♣Deletion - removal of one or more nucleotides
from the DNA.
♣Insertion - addition of one or more
nucleotides to the DNA.
♣Inversion - rotation by 180 of a double-
stranded DNA segment comprising 2 or more
base-pairs.
1 AGGCAAACCTACTGGTCTTAT Original Sequence
*
2 AGGCAAATCCTACTGGTCTTAT Transtion c-t
3 AGGCAAACCTACTGCTCTTAT transversion g-c
*
4 AGGCAAACCTACTGGTCTTAT recombination gtctt
5 AGGCAA CTGGTCTTAT deletion accta
6 AGGCAAACCTACTAAAGCGGTCTTAT insertion aagcg
ACCTA
7 AGGTTTGCCTACTGGTCTTAT inversion from 5' gcaaac3'
to 5' gtttgc 3'
Substitution Mutations
Transition - a change between purines
(A,G) or between pyrimidines (T,C).
Transversion - a change between purines
(A,G) to pyrimidines (T,C).
Substitution mutations usually arise from
mispairing of bases during replication.
18. Let's assume that..
A mutation of a sense codon to another
sense codon, occur in equal frequency for
all the codons.
If so we can now compute the expected
proportion of different types of substitution
mutations from the genetic code.
Where do the mutations occur?
Synonymous substitutions mostly occur at
the 3rd position of the codon.
Nonsynonymous substitutions mostly
occur at the 2nd position of the codon.
Any substitution in the 2nd position is
nonsynonymous
Correction of Distances between
DNA sequences
There are several evolutionary models
used to correct for the likelihood of
multiple mutations and reversions in DNA
sequences.
These evolutionary models use a
normalized distance measurement that is
the average degree of change per length
of aligned sequences.
Jukes & Cantor one-parameter model
This model assumes that substitutions
between the 4 bases occur with equal frequency.
Meaning no bias in the direction of the change.
G
T
C
A
α
α
Is the rate of substitutions
In each of the 3 directions
For one base.
α ( Is the one parameter).
19. Kimura two-parameter model
This model assumes that transitions
(A - G or T - C) occur more often than
transversions (purine -pyrimidine).
G
T
C
A
α
α
Is the rate of transitional
Substitutions.
α
β
β β Is the rate of transversional
substitutions.
These evolutionary models improve the
distance calculations between the
sequences.
These evolutionary models have less
effect in phylogenetic predictions of
closely related sequences.
These evolutionary models have better
effect with distant related sequences.
DNA Evolution Models
A basic process in DNA sequence
evolution is the substitution of one
nucleotide with another.
This process is slow and can not be
observed directly.
The study of DNA changes is used to
estimate the rate of evolution, and the
evolution history of organisms.
Xeno
zebrafish
goldfish
human
bovine
rat
How to read the tree?
Start at the base and follow
The progression of the branch
points (nodes)
20. How to draw Trees? (Building trees software)
* Unrooted trees should be plotted using
the DRAWGRAM program (phylip), or
similar.
* Rooted trees should be plotted using the
DRAWTREE program (phylip), or similar.
* On a PC use the TreeView program
A Tip...
For DNA sequences use the Kimura's
model in the building trees programs.
For PROTEINS the differences lie with
the scoring (substitution) matrices used.
For more distant sequences you should
use BLOSUM with lower # (i.e., for
distant proteins use blosum45 and for
similar proteins use blosum60).
Known problems of Phylogenetic Analysis
™ Order of the input data (sequences) -
The order of the input sequences effects the tree
construction. You can "correct" this effect in some
of the programs (like phylip), using the Jumble
option. (J in phylip set to 10).
™ The number of possible trees is huge for large
datasets. Often it is not possible to construct all
trees, but can guarantee only "a good" tree not
the "best tree".
Known problems of Phylogenetic Analysis
™ The definition of "best tree" is ambiguous.
It might mean the most likely tree, or a tree with
the fewest changes, or a tree best fit to a known
model, etc..
The trees that result from various methods differ
from each other. Never the less, in order to
compare trees, one need to assume some
evolutionary model so that the trees may be
tested.
21. Known problems of Phylogenetic Analysis
∆ The amount of data used for the tree construction is
not always "informative". For example, if we
compare proteins that are 100% similar in a site, we
do not have information to infer to phylogenetic
relationships between these proteins.
∆ Population effects are often to be considered,
especially if we have a lot of variety (large # of
alleles for one protein).
How many trees to build?
! For each dataset it is recommended to build
more than one tree. Build a tree using a
distance method and if possible also use a
character-based method, like maximum
parsimony.
! The core of the tree should be similar in
both methods, otherwise you may suspect
that your tree is incorrect.