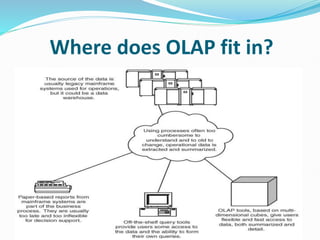
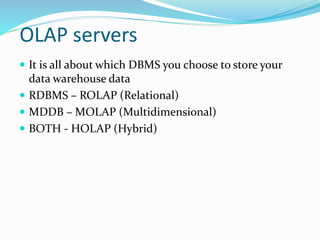
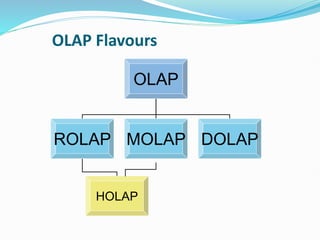
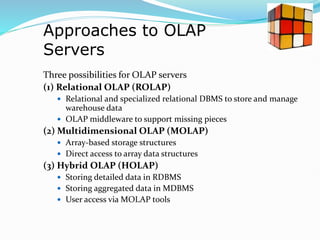
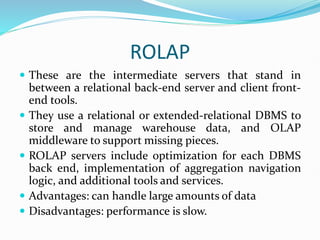
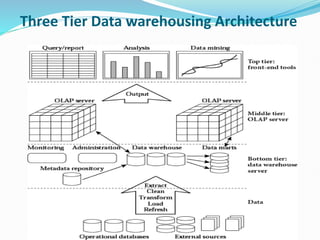
ISSUES IN DATA WAREHOUSE
1. IMPLEMENTING THE DATA WAREHOUSE
 Data Acquisition - is to identify the data sources and develop
a solution for extracting and delivering the data to the
warehouse in a timely, scheduled manner.
 Data Transformation - is the cleansing and validation of data
for accuracy, and ensuring that all values conform to a
standard definition.
 Data Presentation - involves taking the data from the data
warehouse and getting it into the hands of users in a usable,
easy-to-understand format.
2. DESIGN AND ARCHITECTURE OF THE DATA
WAREHOUSE
Data warehouses are targeted for decision making, in contrast with
Operational databases that are for On Line Transaction Processing (OLTP)
 Users need the ability to perform Multidimensional Analysis with complex
calculations, but we find that traditional tools of report writing, query
products, spread sheets, and language interfaces are distressfully
inadequate. Then what is the ANSWER??
 Clearly, the tools used in OLTP and basic data ware house environments do
not match up to the task. We need different set of tools and products that
are specifically meant for serious analysis.
That is we need OLAP in the data warehouse.
OLAP
 Data Warehouse is designed to provide statistical information
and OLAP is the tool and answer to the problem of issues in
designing the data warehouse.
 On Line Analytical Processing (OLAP) systems can respond
to changing business requirements as needed for effective
decision making. It:-
 Supports complex queries that access millions of records
 need historical data for trend analysis
 long scans would interfere with normal operations
 Synchronizing data-intensive queries among physically
separated databases would be a nightmare!
 metric: query response time
About OLAP
 Term coined in mid 1990s.
 As the name implies, OLAP has to do with the
processing of data as it is manipulated for analysis.
 The data warehouse provides the best opportunity
for analysis and OLAP is the vehicle for carrying out
involved analysis.
 Goal of OLAP is to support ad-hoc querying for the
business analyst
 Concept to analyze data by multiple dimension in a
structure called data cube
Demand for Online
Analytical Processing
 2 approaches to developing EDWs: top-
down/bottom-up
 In both approaches, Data Marts rest on
Dimensional Model.
 Data Marts are sufficient for basic data analysis
 Users need to go beyond such basic analysis
Demand for Online
Analytical Processing
 Need for Multidimensional Analysis
 Fast Access & Powerful Calculations
 Limitations of other analysis methods like:
 SQL
 Spreadsheets
 Report Writers
WHY OTHER POSSIBLE ALTERNATIVES COULD NOT
REPLACE OLAP?
 Spread sheets are an inadequate tool for managing and
storing multidimensional data because they tie data storage too
tightly to the presentation—they do not separate the structural
information from the desired views of the information.
 Using a Structured Query Language database management
system offers considerable flexibility in structuring data.
However, formulating many desirable computations such as
cumulative aggregates (sales in year to date), combining totals
and subtotals, or determining rankings such as the top 10
selling products is difficult if not impossible in standard SQL.
 3. Data explosion problem
 Automated data collection tools and mature database
technology lead to tremendous amounts of data stored in
databases, data warehouses and other information
repositories.
 We are drowning in data, but starving for knowledge!
Solution : Data Mining
Need for Multidimensional Analysis
 For effective analyses, users must have easy methods of
performing complex analysis along several business
dimensions.
 They need an environment that presents a
multidimensional view of data
 Decision makers must be able to analyze data
along any number of dimensions, at any level of
aggregation, with the capability of viewing
results in a variety of ways.
 They must have the ability to drill down and roll up
along the hierarchies of every dimension.
Fast Access and Powerful
Calculations
 Users must not be penalized for the complexity of
their analysis.
 Irrespective of the query type, time to retrieve results
or formulate the query should be consistent.
 The queries are interactive(the result set from one
query forms the basis for the next query),therefore
fast access required.
Limitations of Other Analysis
Methods
 Traditional tools of report writers, query products,
spreadsheets, & language interfaces do not match the
user expectations as far as performing
multidimensional analysis with complex calculations
is concerned.
 Written reports, spreadsheets do not support multi-
dimensionality.
 Spreadsheets though can be used to analyse, but
cumbersome.
 Thus, spreadsheets have limitations for
multidimensional analysis and complex calculations.
 Statements may invoke full table scans, multiple
joins, aggregations, groupings and sortings : SQL
weak in these areas.
Where does OLAP fit in?
OLAP is the Answer!
 OLAP software provides the ability to analyze large
volumes of information to improve decision making at
all levels of an organization.
 A wide spectrum of multidimensional analysis
involving intricate calculations and requiring fast
response times.
OLAP Overview
 Interactive, exploratory analysis of multidimensional
data to discover patterns
age accidents
gender
The basic virtues of OLAP
 Enables analysts, executives, and managers to gain
useful insights from the presentation of data.
 Supports multidimensional analysis.
 Is able to drill down or roll up within each dimension.
 Is capable of applying mathematical formulas and
calculations to measures.
 Can reorganize metrics along several dimensions.
 Provides fast response.
 Designed for highly interactive analysis.
Definition
On-Line Analytical Processing (OLAP) is a category of
software technology that enables analysts, managers
and executives to gain insight into data through fast,
consistent, interactive access in a wide variety of
possible views of information that has been
transformed from raw data to reflect the real
dimensionality of the enterprise as understood by the
user.
OLAP Characteristics
 Let business users have a multidimensional and logical
view of the data in the data warehouse.
 Facilitate interactive query and complex analysis for
the users.
 Allow users to drill down for greater details or roll up
for aggregations of metrics along a single business
dimension or across multiple dimensions.
 Provide ability to perform intricate calculations and
comparisons, and
 Present results in a number of meaningful ways,
including charts and graphs.
Data Cubes/Hypercubes
 A data cube allows data to be modelled and viewed in
multiple dimensions. `
 Defined by facts and dimensions.
 Hypercubes: general metaphor for representing
multidimensional data.
OLAP Operations
 Roll Up
 Drill Down
 Slice
 Dice
 Pivot
Roll Up
 Performs aggregation on a data cube, either by
climbing up a concept hierarchy for a dimension or by
dimension reduction.
 When roll-up is performed by dimension reduction,
one or more dimensions are removed from the given
cube.
Example:
Drill down
 Reverse of roll-up.
 It navigates from less detailed data to more detailed
data.
 Drill-down can be realized by either stepping down a
concept hierarchy for a dimension or introducing
additional dimensions.
 E.g. introducing an additional dimension, such as
customer group.
Example:
Slice
 The slice operation performs a selection on one
dimension of the given cube, resulting in a sub-cube.
Example:
Dice
 The dice operation defines a sub-cube by performing a
selection on two or more dimensions
Example:
Pivot
 Pivot (also called rotate) is a visualization operation that
rotates the data axes in view in order to provide an
alternative presentation of the data.
Example:
OLAP servers
 It is all about which DBMS you choose to store your
data warehouse data
 RDBMS – ROLAP (Relational)
 MDDB – MOLAP (Multidimensional)
 BOTH - HOLAP (Hybrid)
OLAP Flavours
OLAP
ROLAP MOLAP DOLAP
HOLAP
Approaches to OLAP
Servers
Three possibilities for OLAP servers
(1) Relational OLAP (ROLAP)
 Relational and specialized relational DBMS to store and manage
warehouse data
 OLAP middleware to support missing pieces
(2) Multidimensional OLAP (MOLAP)
 Array-based storage structures
 Direct access to array data structures
(3) Hybrid OLAP (HOLAP)
 Storing detailed data in RDBMS
 Storing aggregated data in MDBMS
 User access via MOLAP tools
ROLAP
 These are the intermediate servers that stand in
between a relational back-end server and client front-
end tools.
 They use a relational or extended-relational DBMS to
store and manage warehouse data, and OLAP
middleware to support missing pieces.
 ROLAP servers include optimization for each DBMS
back end, implementation of aggregation navigation
logic, and additional tools and services.
 Advantages: can handle large amounts of data
 Disadvantages: performance is slow.
MOLAP
 The database is stored in a special, usually
proprietary, structure that is optimized for
multidimensional analysis.
 They map multidimensional views directly to data
cube array structures.
 Advantage : very fast query response time because
data is mostly pre-calculated
 Disadvantage : practical limit on the size because
the time taken to calculate the database and the
space required to hold these pre-calculated values
HOLAP
 a hybrid of ROLAP and MOLAP
 The hybrid OLAP approach combines ROLAP and
MOLAP technology, benefiting from the greater
scalability of ROLAP and the faster computation of
MOLAP.
DOLAP
 DOLAP (Desktop OLAP)
 DOLAP enables users to quickly pull together small
cubes that run on their desktops or laptops
OLTP System
Online Transaction Processing
(Operational System)
OLAP System
Online Analytical Processing
(Data Warehouse)
Source of data
Operational data; OLTPs are the original
source of the data.
Consolidation data; OLAP data
comes from the various OLTP
Databases
Purpose of data
To control and run fundamental business
tasks
To help with planning, problem
solving, and decision support
What the data
Reveals a snapshot of ongoing business
processes
Multi-dimensional views of various
kinds of business activities
Inserts and Updates
Short and fast inserts and updates initiated
by end users
Periodic long-running batch jobs
refresh the data
Queries
Relatively standardized and simple queries
Returning relatively few records
Often complex queries involving
aggregations
Processing Speed Typically very fast
Depends on the amount of data
involved; batch data refreshes and
complex queries may take many
hours; query speed can be
improved by creating indexes
Space Requirements
Relatively small i.e Mb-Gb of data
Larger due to the existence of
history data i.e. Gb-Tb of data
Database Design Highly normalized with many tables
Typically de-normalized with fewer
tables; use of star and/or snowflake
schemas
Backup and Recovery
Operational data is
critical to run the business, data loss is
likely to entail significant monetary loss
and legal liability
Instead of regular backups, some
environments may consider simply
reloading the OLTP data as a
recovery method
Three Tier Data warehousing Architecture
Three-Tier Data Warehouse Architecture
 Generally a data warehouses adopts a three-tier
architecture. Following are the three tiers of the data
warehouse architecture.
 Bottom Tier − The bottom tier of the architecture is
the data warehouse database server. It is mostly the
relational database system. We use the back end tools
and utilities to feed data into the bottom tier. These
back end tools and utilities perform the Extract, Clean,
Transform, Load, and refresh functions.
 Middle Tier − In the middle tier, we have the OLAP
Server that can be implemented in either of the
following ways.
 By Relational OLAP (ROLAP), which is an extended
relational database management system. The ROLAP
maps the operations on multidimensional data to
standard relational operations.
 By Multidimensional OLAP (MOLAP) model, which
directly implements the multidimensional data and
operations.
 Top-Tier − This tier is the front-end client layer. This
layer holds the query tools and reporting tools,
analysis tools and data mining tools.

OLAP (Online Analytical Processing).pptx

  • 2.
    ISSUES IN DATAWAREHOUSE 1. IMPLEMENTING THE DATA WAREHOUSE  Data Acquisition - is to identify the data sources and develop a solution for extracting and delivering the data to the warehouse in a timely, scheduled manner.  Data Transformation - is the cleansing and validation of data for accuracy, and ensuring that all values conform to a standard definition.  Data Presentation - involves taking the data from the data warehouse and getting it into the hands of users in a usable, easy-to-understand format.
  • 3.
    2. DESIGN ANDARCHITECTURE OF THE DATA WAREHOUSE Data warehouses are targeted for decision making, in contrast with Operational databases that are for On Line Transaction Processing (OLTP)  Users need the ability to perform Multidimensional Analysis with complex calculations, but we find that traditional tools of report writing, query products, spread sheets, and language interfaces are distressfully inadequate. Then what is the ANSWER??  Clearly, the tools used in OLTP and basic data ware house environments do not match up to the task. We need different set of tools and products that are specifically meant for serious analysis. That is we need OLAP in the data warehouse.
  • 4.
    OLAP  Data Warehouseis designed to provide statistical information and OLAP is the tool and answer to the problem of issues in designing the data warehouse.  On Line Analytical Processing (OLAP) systems can respond to changing business requirements as needed for effective decision making. It:-  Supports complex queries that access millions of records  need historical data for trend analysis  long scans would interfere with normal operations  Synchronizing data-intensive queries among physically separated databases would be a nightmare!  metric: query response time
  • 5.
    About OLAP  Termcoined in mid 1990s.  As the name implies, OLAP has to do with the processing of data as it is manipulated for analysis.  The data warehouse provides the best opportunity for analysis and OLAP is the vehicle for carrying out involved analysis.  Goal of OLAP is to support ad-hoc querying for the business analyst  Concept to analyze data by multiple dimension in a structure called data cube
  • 6.
    Demand for Online AnalyticalProcessing  2 approaches to developing EDWs: top- down/bottom-up  In both approaches, Data Marts rest on Dimensional Model.  Data Marts are sufficient for basic data analysis  Users need to go beyond such basic analysis
  • 7.
    Demand for Online AnalyticalProcessing  Need for Multidimensional Analysis  Fast Access & Powerful Calculations  Limitations of other analysis methods like:  SQL  Spreadsheets  Report Writers
  • 8.
    WHY OTHER POSSIBLEALTERNATIVES COULD NOT REPLACE OLAP?  Spread sheets are an inadequate tool for managing and storing multidimensional data because they tie data storage too tightly to the presentation—they do not separate the structural information from the desired views of the information.  Using a Structured Query Language database management system offers considerable flexibility in structuring data. However, formulating many desirable computations such as cumulative aggregates (sales in year to date), combining totals and subtotals, or determining rankings such as the top 10 selling products is difficult if not impossible in standard SQL.
  • 9.
     3. Dataexplosion problem  Automated data collection tools and mature database technology lead to tremendous amounts of data stored in databases, data warehouses and other information repositories.  We are drowning in data, but starving for knowledge! Solution : Data Mining
  • 10.
    Need for MultidimensionalAnalysis  For effective analyses, users must have easy methods of performing complex analysis along several business dimensions.  They need an environment that presents a multidimensional view of data  Decision makers must be able to analyze data along any number of dimensions, at any level of aggregation, with the capability of viewing results in a variety of ways.  They must have the ability to drill down and roll up along the hierarchies of every dimension.
  • 11.
    Fast Access andPowerful Calculations  Users must not be penalized for the complexity of their analysis.  Irrespective of the query type, time to retrieve results or formulate the query should be consistent.  The queries are interactive(the result set from one query forms the basis for the next query),therefore fast access required.
  • 12.
    Limitations of OtherAnalysis Methods  Traditional tools of report writers, query products, spreadsheets, & language interfaces do not match the user expectations as far as performing multidimensional analysis with complex calculations is concerned.  Written reports, spreadsheets do not support multi- dimensionality.  Spreadsheets though can be used to analyse, but cumbersome.  Thus, spreadsheets have limitations for multidimensional analysis and complex calculations.  Statements may invoke full table scans, multiple joins, aggregations, groupings and sortings : SQL weak in these areas.
  • 13.
  • 14.
    OLAP is theAnswer!  OLAP software provides the ability to analyze large volumes of information to improve decision making at all levels of an organization.  A wide spectrum of multidimensional analysis involving intricate calculations and requiring fast response times.
  • 15.
    OLAP Overview  Interactive,exploratory analysis of multidimensional data to discover patterns age accidents gender
  • 16.
    The basic virtuesof OLAP  Enables analysts, executives, and managers to gain useful insights from the presentation of data.  Supports multidimensional analysis.  Is able to drill down or roll up within each dimension.  Is capable of applying mathematical formulas and calculations to measures.  Can reorganize metrics along several dimensions.  Provides fast response.  Designed for highly interactive analysis.
  • 17.
    Definition On-Line Analytical Processing(OLAP) is a category of software technology that enables analysts, managers and executives to gain insight into data through fast, consistent, interactive access in a wide variety of possible views of information that has been transformed from raw data to reflect the real dimensionality of the enterprise as understood by the user.
  • 18.
    OLAP Characteristics  Letbusiness users have a multidimensional and logical view of the data in the data warehouse.  Facilitate interactive query and complex analysis for the users.  Allow users to drill down for greater details or roll up for aggregations of metrics along a single business dimension or across multiple dimensions.  Provide ability to perform intricate calculations and comparisons, and  Present results in a number of meaningful ways, including charts and graphs.
  • 19.
    Data Cubes/Hypercubes  Adata cube allows data to be modelled and viewed in multiple dimensions. `  Defined by facts and dimensions.  Hypercubes: general metaphor for representing multidimensional data.
  • 21.
    OLAP Operations  RollUp  Drill Down  Slice  Dice  Pivot
  • 22.
    Roll Up  Performsaggregation on a data cube, either by climbing up a concept hierarchy for a dimension or by dimension reduction.  When roll-up is performed by dimension reduction, one or more dimensions are removed from the given cube.
  • 23.
  • 24.
    Drill down  Reverseof roll-up.  It navigates from less detailed data to more detailed data.  Drill-down can be realized by either stepping down a concept hierarchy for a dimension or introducing additional dimensions.  E.g. introducing an additional dimension, such as customer group.
  • 25.
  • 27.
    Slice  The sliceoperation performs a selection on one dimension of the given cube, resulting in a sub-cube.
  • 28.
  • 29.
    Dice  The diceoperation defines a sub-cube by performing a selection on two or more dimensions
  • 30.
  • 32.
    Pivot  Pivot (alsocalled rotate) is a visualization operation that rotates the data axes in view in order to provide an alternative presentation of the data.
  • 33.
  • 34.
    OLAP servers  Itis all about which DBMS you choose to store your data warehouse data  RDBMS – ROLAP (Relational)  MDDB – MOLAP (Multidimensional)  BOTH - HOLAP (Hybrid)
  • 35.
  • 36.
    Approaches to OLAP Servers Threepossibilities for OLAP servers (1) Relational OLAP (ROLAP)  Relational and specialized relational DBMS to store and manage warehouse data  OLAP middleware to support missing pieces (2) Multidimensional OLAP (MOLAP)  Array-based storage structures  Direct access to array data structures (3) Hybrid OLAP (HOLAP)  Storing detailed data in RDBMS  Storing aggregated data in MDBMS  User access via MOLAP tools
  • 37.
    ROLAP  These arethe intermediate servers that stand in between a relational back-end server and client front- end tools.  They use a relational or extended-relational DBMS to store and manage warehouse data, and OLAP middleware to support missing pieces.  ROLAP servers include optimization for each DBMS back end, implementation of aggregation navigation logic, and additional tools and services.  Advantages: can handle large amounts of data  Disadvantages: performance is slow.
  • 38.
    MOLAP  The databaseis stored in a special, usually proprietary, structure that is optimized for multidimensional analysis.  They map multidimensional views directly to data cube array structures.  Advantage : very fast query response time because data is mostly pre-calculated  Disadvantage : practical limit on the size because the time taken to calculate the database and the space required to hold these pre-calculated values
  • 41.
    HOLAP  a hybridof ROLAP and MOLAP  The hybrid OLAP approach combines ROLAP and MOLAP technology, benefiting from the greater scalability of ROLAP and the faster computation of MOLAP.
  • 42.
    DOLAP  DOLAP (DesktopOLAP)  DOLAP enables users to quickly pull together small cubes that run on their desktops or laptops
  • 43.
    OLTP System Online TransactionProcessing (Operational System) OLAP System Online Analytical Processing (Data Warehouse) Source of data Operational data; OLTPs are the original source of the data. Consolidation data; OLAP data comes from the various OLTP Databases Purpose of data To control and run fundamental business tasks To help with planning, problem solving, and decision support What the data Reveals a snapshot of ongoing business processes Multi-dimensional views of various kinds of business activities Inserts and Updates Short and fast inserts and updates initiated by end users Periodic long-running batch jobs refresh the data Queries Relatively standardized and simple queries Returning relatively few records Often complex queries involving aggregations Processing Speed Typically very fast Depends on the amount of data involved; batch data refreshes and complex queries may take many hours; query speed can be improved by creating indexes
  • 44.
    Space Requirements Relatively smalli.e Mb-Gb of data Larger due to the existence of history data i.e. Gb-Tb of data Database Design Highly normalized with many tables Typically de-normalized with fewer tables; use of star and/or snowflake schemas Backup and Recovery Operational data is critical to run the business, data loss is likely to entail significant monetary loss and legal liability Instead of regular backups, some environments may consider simply reloading the OLTP data as a recovery method
  • 45.
    Three Tier Datawarehousing Architecture
  • 46.
    Three-Tier Data WarehouseArchitecture  Generally a data warehouses adopts a three-tier architecture. Following are the three tiers of the data warehouse architecture.  Bottom Tier − The bottom tier of the architecture is the data warehouse database server. It is mostly the relational database system. We use the back end tools and utilities to feed data into the bottom tier. These back end tools and utilities perform the Extract, Clean, Transform, Load, and refresh functions.
  • 47.
     Middle Tier− In the middle tier, we have the OLAP Server that can be implemented in either of the following ways.  By Relational OLAP (ROLAP), which is an extended relational database management system. The ROLAP maps the operations on multidimensional data to standard relational operations.  By Multidimensional OLAP (MOLAP) model, which directly implements the multidimensional data and operations.  Top-Tier − This tier is the front-end client layer. This layer holds the query tools and reporting tools, analysis tools and data mining tools.