Download as PDF, PPTX

![OLTP vs. OLAP
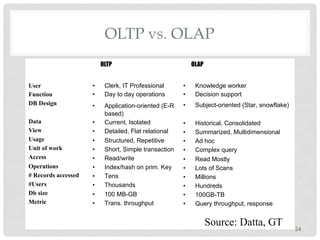
§ On-Line Transaction Processing (OLTP):
– technology used to perform updates on operational or
transactional systems (e.g., point of sale systems)
§ On-Line Analytical Processing (OLAP):
– technology used to perform complex analysis of the data
in a data warehouse
4
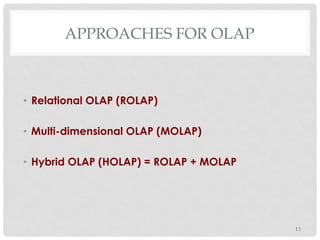
OLAP is a category of software technology that enables
analysts, managers, and executives to gain insight into data
through fast, consistent, interactive access to a wide variety
of possible views of information that has been transformed
from raw data to reflect the dimensionality of the enterprise
as understood by the user.
[source: OLAP Council: www.olapcouncil.org]](https://image.slidesharecdn.com/olapandmining-200324064025/85/OLAP-IN-DATA-MINING-4-320.jpg)
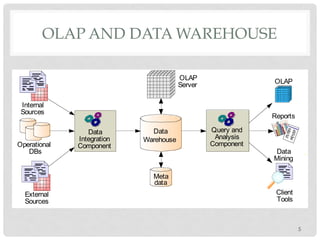
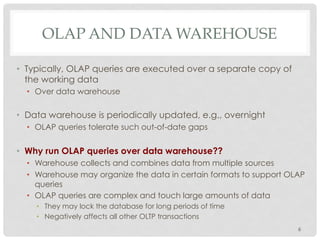


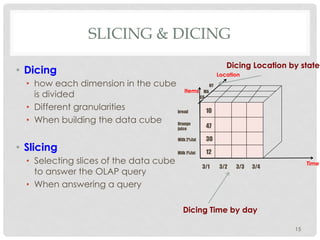
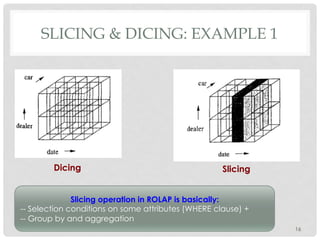
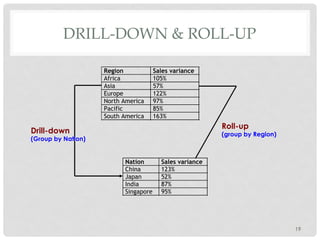
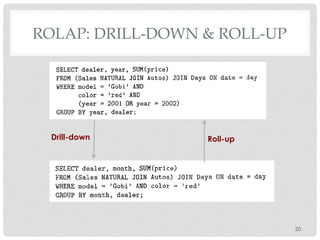
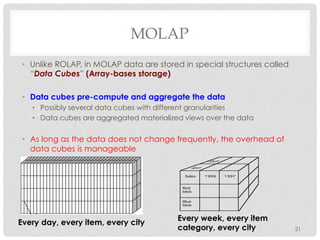
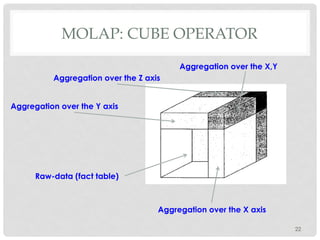
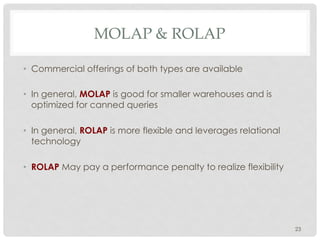
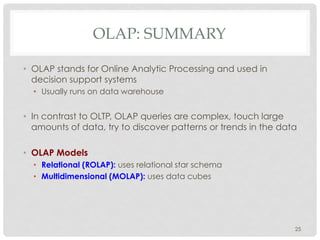
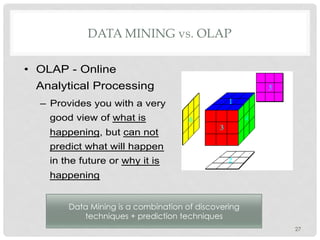
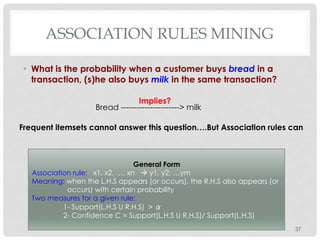

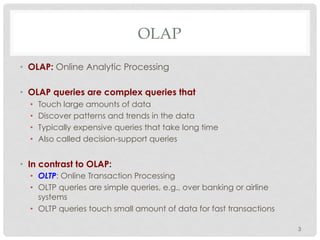
OLAP (Online Analytical Processing) is used for complex queries over large datasets to discover patterns and trends. OLAP queries are run over a data warehouse and use multidimensional models like MOLAP with pre-computed data cubes or ROLAP with a star schema. Key OLAP concepts include slicing and dicing the data cube and drill-down and roll-up operations. Data mining techniques like association rule mining can be used to discover relationships between items in transaction data beyond what is found with frequent itemset mining alone.


![Getting Started with Apache Spark: Big Data Made Simple [Free Meetup]](https://cdn.slidesharecdn.com/ss_thumbnails/apachesparkgettingstarted-260203175547-8361bcc3-thumbnail.jpg?width=640&height=640&fit=bounds)


