The document discusses OLAP (Online Analytical Processing) and summarizes key concepts. It describes different types of OLAP including MOLAP, ROLAP, and HOLAP and compares their functions and advantages/disadvantages. It also discusses OLAP operations like selection, roll-up, drill-down, and drill-across. The document concludes by discussing applications of OLAP and future directions such as integrating OLAP with data mining and improving security and user interaction.


![managers in extracting knowledge from the data warehouse by means of Drag&Drop,
instead of typing SQL queries by hand.
OLAP market is estimated around 6 billion US$ in 2006, which is mainly devoted to
decision making. However, this paradigm can also be used in any other field with non-
expert users, where schemas and queries are relatively complex. For example, its usage is
under investigation in bioinformatics [8], and the semantic web [9].
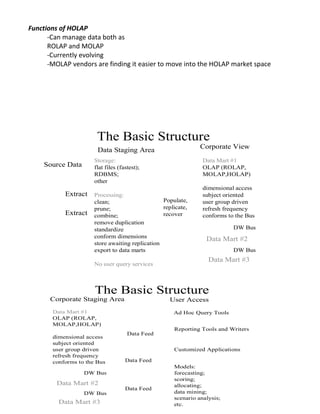
Declarative languages
There are some research proposals of declarative query languages for OLAP. [1]
proposes a graphical query language, while [3] proposes a calculus. From the industry point
of view, MDX (standing for Multidimensional Expressions [5]) is the de facto standard. It
was introduced in 1997, and in spite of the specification being owned by Microsoft it has
been widely adopted. Its syntax resembles that of SQL.
[ WITH <MeasureDefinition>+ ]
SELECT <DimensionSpecification>+
FROM <CubeName>
[WHERE <SlicerClause> ]
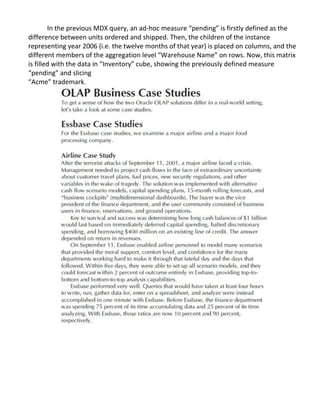
However, its semantics are completely different. Roughly speaking, an MDX query
gets the instances of a given Cube stated in the FROM clause and places them in the space
defined by the SELECT clause. Moreover, complex calculations can be defined in the WITH
clause, and the dimensions not used in the SELECT clause can be sliced in the WHERE clause
(if not explicitly sliced, it is assumed that dimensions that do not appear in the SELECT are
sliced at the higher aggregation level: All).
WITH MEMBER [Measures].[pending] AS ’[Measures].[Units Ordered]-[Measures].[Units
Shipped]’
SELECT
{[Time].[2006].children} ON COLUMNS,
{[Warehouse].[Warehouse Name].members} ON ROWS
FROM Inventory
WHERE ([Measures].[pending],[Trademark].[Acme]);](https://image.slidesharecdn.com/86921864-olap-case-study-vj-150908151418-lva1-app6891/85/86921864-olap-case-study-vj-12-320.jpg)
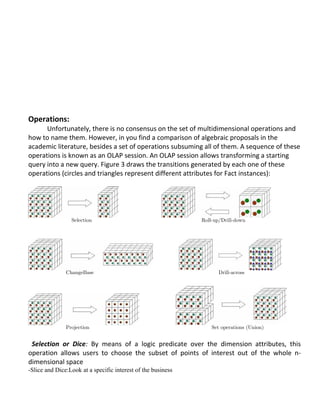
![FUTURE DIRECTIONS
OLAP is used to extract knowledge from the data warehouse. Another kind of tool
used with this purpose are data mining tools (see Data Mining definitional entry). Till now,
both research communities have been evolving separately. The former must be interactive,
while the latter presents computational complexity problems. However, it seems promising
to integrate both kinds of tools so that ones can benefit from the others. In fact, it was
already suggested in [4], and some tools like Microsoft Analysis Services already integrate
them in some way. Nevertheless, there is much work to do in this field, yet.
On the other hand, security is usually a flaw in data warehousing projects. [7]
contains a survey of OLAP security problems. In the past, OLAP tools used to have just a
few users and all of them had high responsibilities in the company, so this was not really a
concern in the sense of confidentiality. Nowadays, with the increase in potential
users of OLAP systems inside as well as outside the company, security has appeared as a
priority in these projects (see Security in DWs definitional entry). Moreover, personal data
(like those of customers) are usually analyzed in almost all companies. Thus, inference
control mechanisms need to be studied in data mining as well as OLAP tools.
Other research directions in OLAP can be the improvement of user interaction and
flexibility in the calculation of statistics (see Visual OLAP definitional entry), and the
integration of what-if analysis (see What-if Analysis definitional entry).
URL TO CODE
Some OLAP vendors:
•Microsoft Analysis Services:
http://www.microsoft.com/sql/technologies/analysis/default.mspx
•Hyperion Solutions:](https://image.slidesharecdn.com/86921864-olap-case-study-vj-150908151418-lva1-app6891/85/86921864-olap-case-study-vj-14-320.jpg)


![Data Models [DATABASE SYSTEMS: Design, Implementation, and Management]](https://cdn.slidesharecdn.com/ss_thumbnails/coronelpptch02-datamodels-190903105908-thumbnail.jpg?width=640&height=640&fit=bounds)