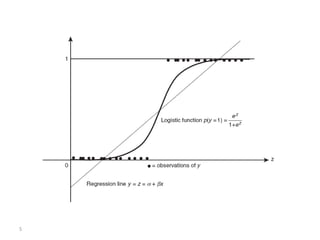
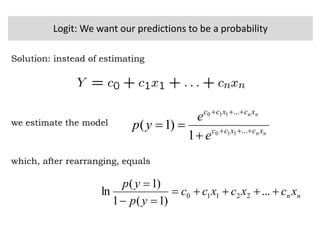
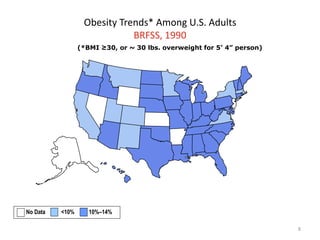
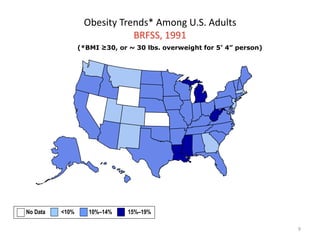
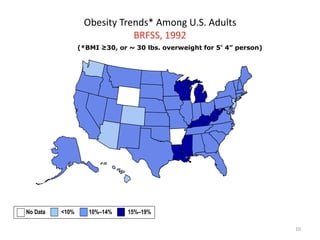
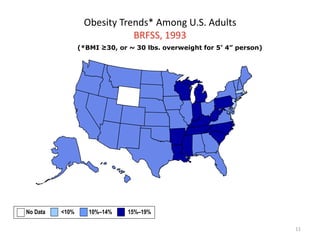
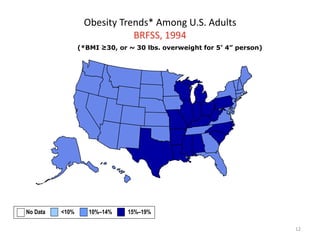
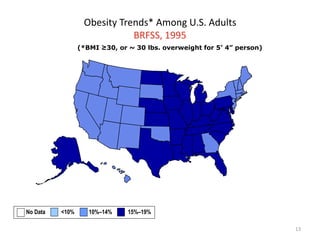
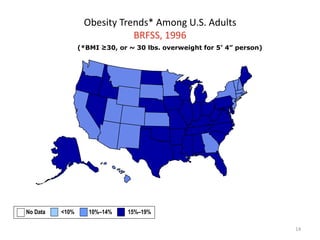
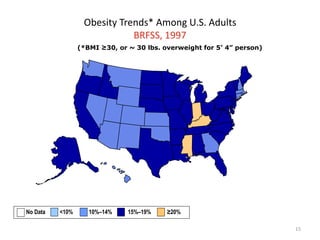
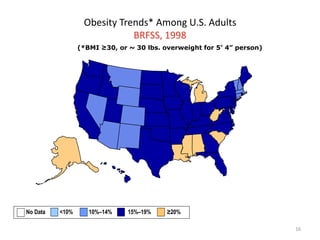
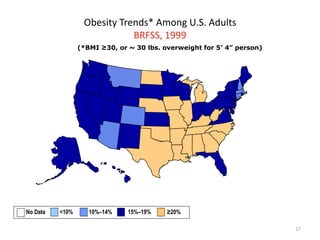
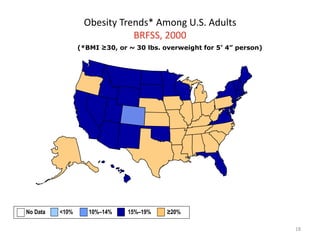
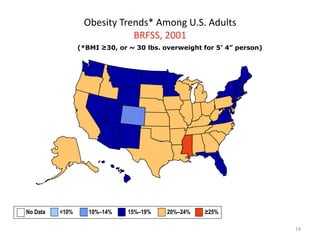
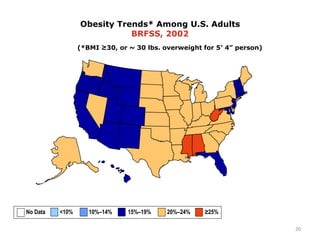
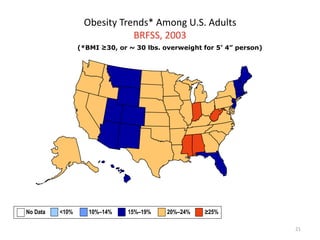
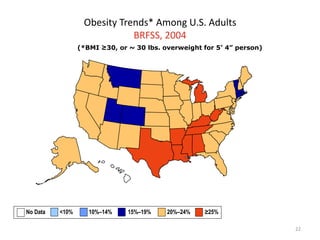
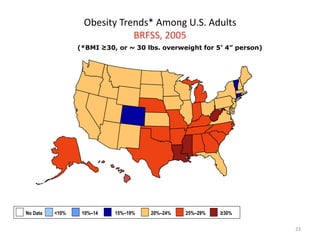
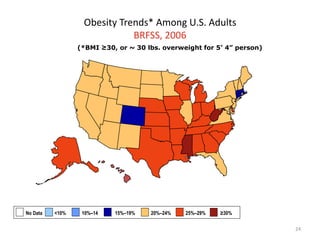
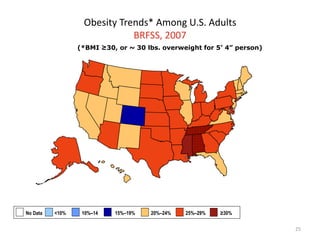
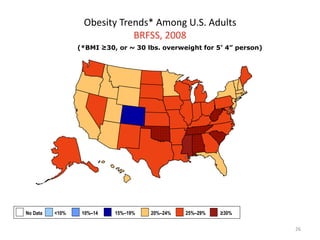
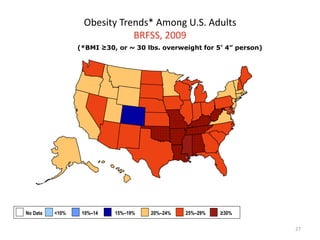
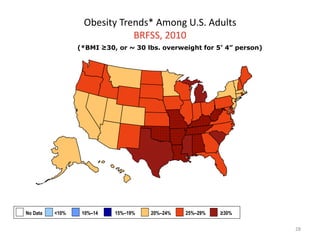
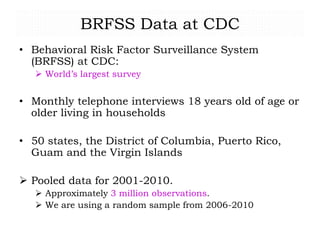
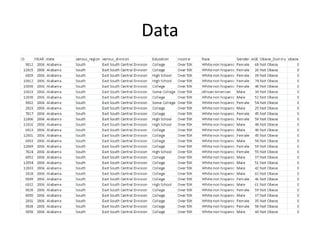
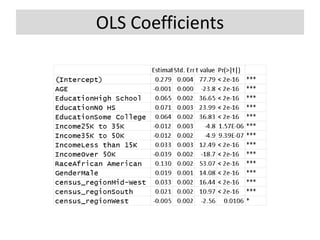
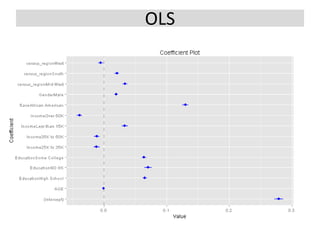
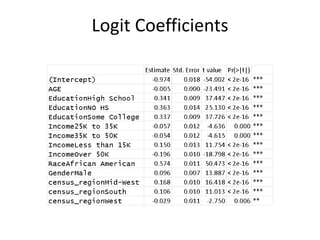
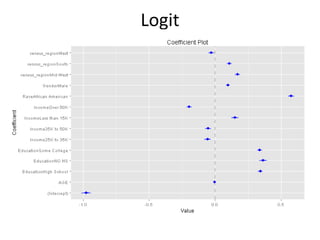
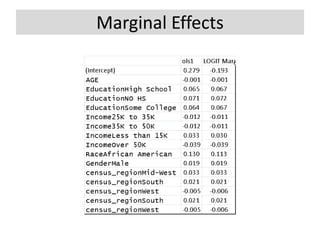
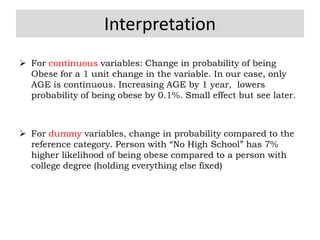
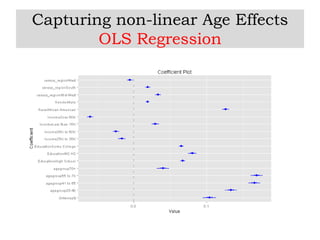
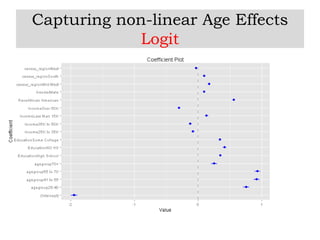
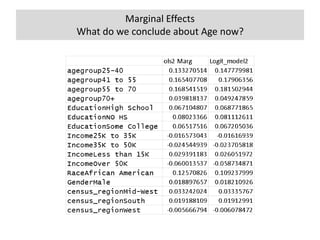
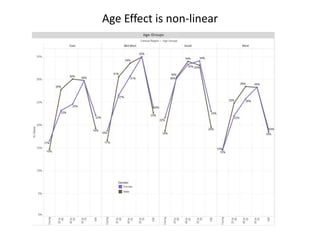
Predicting Obesity Rates in the US
D3M
Discrete Choice Models
 Regression models we were studying so far had a continuous
dependent variable (e.g. sales of a product, House prices etc.)
o Predictor variables could be continuous or discrete (dummy variables)
 Often the phenomenon of interest (i.e. our dependent
variable) is discrete
o Vote or not
o Customer acquisition/defection
o Buy/no-buy
o Click on a banner Ad
o Survive/Don’t survive
With discrete outcomes, we are predicting probabilities (of say
customer defection).
Properties of probabilities?
3
• With binary or categorical dependent variables
standard regression analysis is not appropriate
• Example
• binary dependent variable y coded to be zero for non-purchases and
one for purchases
• X is a continuous metric say price
• Problems
 The error terms are heteroskedastic (variance of the dependent
variable is different with different values of the independent variables
 Does not meet the assumptions of standard ols regression
 Prediction often below zero and values above one
Why Regression does not work
with
0 for non purchases
1 for purchases
y x
y
    

 

4
Discrete choice models
 Generalize the regression model for the situations
where y is a non-metric variable
o a binary (0-1) variable or
o an ordinal variable (like a questionnaire item assuming the
values completely disagree, disagree, neither, agree,
completely agree) or
o a categorical variable (for example a nominal variable
recording the preferred Brand).
 The right-hand side variables can be discrete or continuous
 Similar to linear regression but interpretations are different
i iy x    
5
Logit: We want our predictions to be a probability
Solution: instead of estimating
we estimate the model
which, after rearranging, equals
nn xcxcxcc
yp
yp



...
)1(1
)1(
ln 22110
nn
nn
xcxcc
xcxcc
e
e
yp 


 ...
...
110
110
1
)1(
Case Study: Predicting Obesity Rates
8
Obesity Trends* Among U.S. Adults
BRFSS, 1990
(*BMI ≥30, or ~ 30 lbs. overweight for 5’ 4” person)
No Data <10% 10%–14%
9
Obesity Trends* Among U.S. Adults
BRFSS, 1991
(*BMI ≥30, or ~ 30 lbs. overweight for 5’ 4” person)
No Data <10% 10%–14% 15%–19%
10
Obesity Trends* Among U.S. Adults
BRFSS, 1992
(*BMI ≥30, or ~ 30 lbs. overweight for 5’ 4” person)
No Data <10% 10%–14% 15%–19%
11
Obesity Trends* Among U.S. Adults
BRFSS, 1993
(*BMI ≥30, or ~ 30 lbs. overweight for 5’ 4” person)
No Data <10% 10%–14% 15%–19%
12
Obesity Trends* Among U.S. Adults
BRFSS, 1994
(*BMI ≥30, or ~ 30 lbs. overweight for 5’ 4” person)
No Data <10% 10%–14% 15%–19%
13
Obesity Trends* Among U.S. Adults
BRFSS, 1995
(*BMI ≥30, or ~ 30 lbs. overweight for 5’ 4” person)
No Data <10% 10%–14% 15%–19%
14
Obesity Trends* Among U.S. Adults
BRFSS, 1996
(*BMI ≥30, or ~ 30 lbs. overweight for 5’ 4” person)
No Data <10% 10%–14% 15%–19%
15
Obesity Trends* Among U.S. Adults
BRFSS, 1997
(*BMI ≥30, or ~ 30 lbs. overweight for 5’ 4” person)
No Data <10% 10%–14% 15%–19% ≥20%
16
Obesity Trends* Among U.S. Adults
BRFSS, 1998
(*BMI ≥30, or ~ 30 lbs. overweight for 5’ 4” person)
No Data <10% 10%–14% 15%–19% ≥20%
17
Obesity Trends* Among U.S. Adults
BRFSS, 1999
(*BMI ≥30, or ~ 30 lbs. overweight for 5’ 4” person)
No Data <10% 10%–14% 15%–19% ≥20%
18
Obesity Trends* Among U.S. Adults
BRFSS, 2000
(*BMI ≥30, or ~ 30 lbs. overweight for 5’ 4” person)
No Data <10% 10%–14% 15%–19% ≥20%
19
Obesity Trends* Among U.S. Adults
BRFSS, 2001
(*BMI ≥30, or ~ 30 lbs. overweight for 5’ 4” person)
No Data <10% 10%–14% 15%–19% 20%–24% ≥25%
(*BMI ≥30, or ~ 30 lbs. overweight for 5’ 4” person)
Obesity Trends* Among U.S. Adults
BRFSS, 2002
No Data <10% 10%–14% 15%–19% 20%–24% ≥25%
20
21
Obesity Trends* Among U.S. Adults
BRFSS, 2003
(*BMI ≥30, or ~ 30 lbs. overweight for 5’ 4” person)
No Data <10% 10%–14% 15%–19% 20%–24% ≥25%
Obesity Trends* Among U.S. Adults
BRFSS, 2004
22
(*BMI ≥30, or ~ 30 lbs. overweight for 5’ 4” person)
No Data <10% 10%–14% 15%–19% 20%–24% ≥25%
Obesity Trends* Among U.S. Adults
BRFSS, 2005
23
(*BMI ≥30, or ~ 30 lbs. overweight for 5’ 4” person)
No Data <10% 10%–14 15%–19% 20%–24% 25%–29% ≥30%
Obesity Trends* Among U.S. Adults
BRFSS, 2006
24
(*BMI ≥30, or ~ 30 lbs. overweight for 5’ 4” person)
No Data <10% 10%–14 15%–19% 20%–24% 25%–29% ≥30%
Obesity Trends* Among U.S. Adults
BRFSS, 2007
25
(*BMI ≥30, or ~ 30 lbs. overweight for 5’ 4” person)
No Data <10% 10%–14 15%–19% 20%–24% 25%–29% ≥30%
Obesity Trends* Among U.S. Adults
BRFSS, 2008
26
(*BMI ≥30, or ~ 30 lbs. overweight for 5’ 4” person)
No Data <10% 10%–14 15%–19% 20%–24% 25%–29% ≥30%
Obesity Trends* Among U.S. Adults
BRFSS, 2009
27
(*BMI ≥30, or ~ 30 lbs. overweight for 5’ 4” person)
No Data <10% 10%–14 15%–19% 20%–24% 25%–29% ≥30%
Obesity Trends* Among U.S. Adults
BRFSS, 2010
28
(*BMI ≥30, or ~ 30 lbs. overweight for 5’ 4” person)
No Data <10% 10%–14 15%–19% 20%–24% 25%–29% ≥30%
Data Source
BRFSS Survey by CDC
BRFSS Data at CDC
• Behavioral Risk Factor Surveillance System
(BRFSS) at CDC:
 World’s largest survey
• Monthly telephone interviews 18 years old of age or
older living in households
• 50 states, the District of Columbia, Puerto Rico,
Guam and the Virgin Islands
 Pooled data for 2001-2010.
 Approximately 3 million observations.
 We are using a random sample from 2006-2010
Data
Always start by summary statistics
OLS Coefficients
OLS
Logit Coefficients
Logit
Marginal Effects
Interpretation
 For continuous variables: Change in probability of being
Obese for a 1 unit change in the variable. In our case, only
AGE is continuous. Increasing AGE by 1 year, lowers
probability of being obese by 0.1%. Small effect but see later.
 For dummy variables, change in probability compared to the
reference category. Person with “No High School” has 7%
higher likelihood of being obese compared to a person with
college degree (holding everything else fixed)
Capturing non-linear Age Effects
OLS Regression
Capturing non-linear Age Effects
Logit
Marginal Effects
What do we conclude about Age now?
Age Effect is non-linear
Obesity

Obesity

  • 1.
  • 2.
    Discrete Choice Models Regression models we were studying so far had a continuous dependent variable (e.g. sales of a product, House prices etc.) o Predictor variables could be continuous or discrete (dummy variables)  Often the phenomenon of interest (i.e. our dependent variable) is discrete o Vote or not o Customer acquisition/defection o Buy/no-buy o Click on a banner Ad o Survive/Don’t survive With discrete outcomes, we are predicting probabilities (of say customer defection). Properties of probabilities?
  • 3.
    3 • With binaryor categorical dependent variables standard regression analysis is not appropriate • Example • binary dependent variable y coded to be zero for non-purchases and one for purchases • X is a continuous metric say price • Problems  The error terms are heteroskedastic (variance of the dependent variable is different with different values of the independent variables  Does not meet the assumptions of standard ols regression  Prediction often below zero and values above one Why Regression does not work with 0 for non purchases 1 for purchases y x y         
  • 4.
    4 Discrete choice models Generalize the regression model for the situations where y is a non-metric variable o a binary (0-1) variable or o an ordinal variable (like a questionnaire item assuming the values completely disagree, disagree, neither, agree, completely agree) or o a categorical variable (for example a nominal variable recording the preferred Brand).  The right-hand side variables can be discrete or continuous  Similar to linear regression but interpretations are different i iy x    
  • 5.
  • 6.
    Logit: We wantour predictions to be a probability Solution: instead of estimating we estimate the model which, after rearranging, equals nn xcxcxcc yp yp    ... )1(1 )1( ln 22110 nn nn xcxcc xcxcc e e yp     ... ... 110 110 1 )1(
  • 7.
  • 8.
    8 Obesity Trends* AmongU.S. Adults BRFSS, 1990 (*BMI ≥30, or ~ 30 lbs. overweight for 5’ 4” person) No Data <10% 10%–14%
  • 9.
    9 Obesity Trends* AmongU.S. Adults BRFSS, 1991 (*BMI ≥30, or ~ 30 lbs. overweight for 5’ 4” person) No Data <10% 10%–14% 15%–19%
  • 10.
    10 Obesity Trends* AmongU.S. Adults BRFSS, 1992 (*BMI ≥30, or ~ 30 lbs. overweight for 5’ 4” person) No Data <10% 10%–14% 15%–19%
  • 11.
    11 Obesity Trends* AmongU.S. Adults BRFSS, 1993 (*BMI ≥30, or ~ 30 lbs. overweight for 5’ 4” person) No Data <10% 10%–14% 15%–19%
  • 12.
    12 Obesity Trends* AmongU.S. Adults BRFSS, 1994 (*BMI ≥30, or ~ 30 lbs. overweight for 5’ 4” person) No Data <10% 10%–14% 15%–19%
  • 13.
    13 Obesity Trends* AmongU.S. Adults BRFSS, 1995 (*BMI ≥30, or ~ 30 lbs. overweight for 5’ 4” person) No Data <10% 10%–14% 15%–19%
  • 14.
    14 Obesity Trends* AmongU.S. Adults BRFSS, 1996 (*BMI ≥30, or ~ 30 lbs. overweight for 5’ 4” person) No Data <10% 10%–14% 15%–19%
  • 15.
    15 Obesity Trends* AmongU.S. Adults BRFSS, 1997 (*BMI ≥30, or ~ 30 lbs. overweight for 5’ 4” person) No Data <10% 10%–14% 15%–19% ≥20%
  • 16.
    16 Obesity Trends* AmongU.S. Adults BRFSS, 1998 (*BMI ≥30, or ~ 30 lbs. overweight for 5’ 4” person) No Data <10% 10%–14% 15%–19% ≥20%
  • 17.
    17 Obesity Trends* AmongU.S. Adults BRFSS, 1999 (*BMI ≥30, or ~ 30 lbs. overweight for 5’ 4” person) No Data <10% 10%–14% 15%–19% ≥20%
  • 18.
    18 Obesity Trends* AmongU.S. Adults BRFSS, 2000 (*BMI ≥30, or ~ 30 lbs. overweight for 5’ 4” person) No Data <10% 10%–14% 15%–19% ≥20%
  • 19.
    19 Obesity Trends* AmongU.S. Adults BRFSS, 2001 (*BMI ≥30, or ~ 30 lbs. overweight for 5’ 4” person) No Data <10% 10%–14% 15%–19% 20%–24% ≥25%
  • 20.
    (*BMI ≥30, or~ 30 lbs. overweight for 5’ 4” person) Obesity Trends* Among U.S. Adults BRFSS, 2002 No Data <10% 10%–14% 15%–19% 20%–24% ≥25% 20
  • 21.
    21 Obesity Trends* AmongU.S. Adults BRFSS, 2003 (*BMI ≥30, or ~ 30 lbs. overweight for 5’ 4” person) No Data <10% 10%–14% 15%–19% 20%–24% ≥25%
  • 22.
    Obesity Trends* AmongU.S. Adults BRFSS, 2004 22 (*BMI ≥30, or ~ 30 lbs. overweight for 5’ 4” person) No Data <10% 10%–14% 15%–19% 20%–24% ≥25%
  • 23.
    Obesity Trends* AmongU.S. Adults BRFSS, 2005 23 (*BMI ≥30, or ~ 30 lbs. overweight for 5’ 4” person) No Data <10% 10%–14 15%–19% 20%–24% 25%–29% ≥30%
  • 24.
    Obesity Trends* AmongU.S. Adults BRFSS, 2006 24 (*BMI ≥30, or ~ 30 lbs. overweight for 5’ 4” person) No Data <10% 10%–14 15%–19% 20%–24% 25%–29% ≥30%
  • 25.
    Obesity Trends* AmongU.S. Adults BRFSS, 2007 25 (*BMI ≥30, or ~ 30 lbs. overweight for 5’ 4” person) No Data <10% 10%–14 15%–19% 20%–24% 25%–29% ≥30%
  • 26.
    Obesity Trends* AmongU.S. Adults BRFSS, 2008 26 (*BMI ≥30, or ~ 30 lbs. overweight for 5’ 4” person) No Data <10% 10%–14 15%–19% 20%–24% 25%–29% ≥30%
  • 27.
    Obesity Trends* AmongU.S. Adults BRFSS, 2009 27 (*BMI ≥30, or ~ 30 lbs. overweight for 5’ 4” person) No Data <10% 10%–14 15%–19% 20%–24% 25%–29% ≥30%
  • 28.
    Obesity Trends* AmongU.S. Adults BRFSS, 2010 28 (*BMI ≥30, or ~ 30 lbs. overweight for 5’ 4” person) No Data <10% 10%–14 15%–19% 20%–24% 25%–29% ≥30%
  • 29.
  • 30.
    BRFSS Data atCDC • Behavioral Risk Factor Surveillance System (BRFSS) at CDC:  World’s largest survey • Monthly telephone interviews 18 years old of age or older living in households • 50 states, the District of Columbia, Puerto Rico, Guam and the Virgin Islands  Pooled data for 2001-2010.  Approximately 3 million observations.  We are using a random sample from 2006-2010
  • 31.
  • 32.
    Always start bysummary statistics
  • 33.
  • 34.
  • 35.
  • 36.
  • 37.
  • 38.
    Interpretation  For continuousvariables: Change in probability of being Obese for a 1 unit change in the variable. In our case, only AGE is continuous. Increasing AGE by 1 year, lowers probability of being obese by 0.1%. Small effect but see later.  For dummy variables, change in probability compared to the reference category. Person with “No High School” has 7% higher likelihood of being obese compared to a person with college degree (holding everything else fixed)
  • 39.
    Capturing non-linear AgeEffects OLS Regression
  • 40.
  • 41.
    Marginal Effects What dowe conclude about Age now?
  • 42.
    Age Effect isnon-linear