The document discusses various techniques for analyzing brands, including:
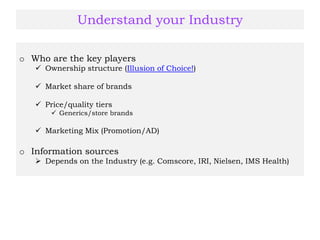
1) Understanding industries and competitors to analyze market share, price tiers, and marketing strategies.
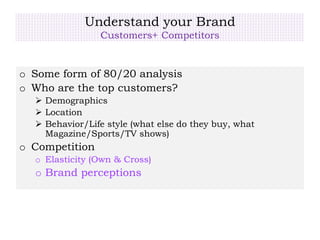
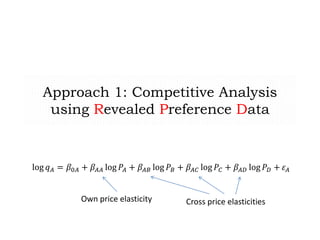
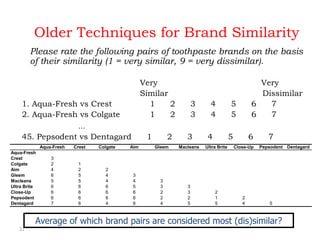
2) Using revealed and stated preference data to understand consumer decision-making and brand perceptions.
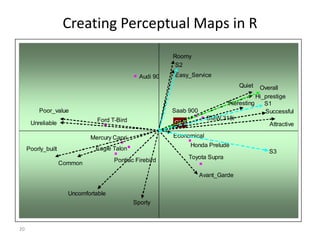
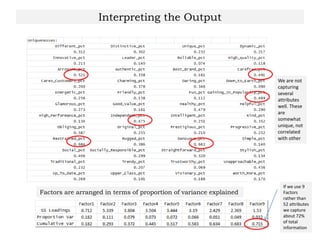
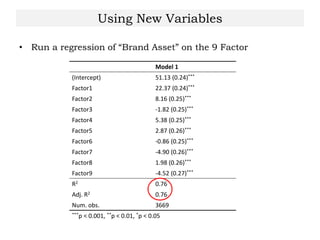
3) Conducting factor analysis to reduce many brand attributes to a few underlying factors that capture most of the information, which can then be used to position brands on perceptual maps.
This case study utilizes a large database (2000 stores, 6-years of scanner data) to study pricing strategies for brands. Methods include Advanced regression, PCA and Clustering algorithms.
Non-wage income is a big component of total income in America, yet is almost never analyzed in terms of inequality and discrimination. Here we use the Tobit method to determine the likelihood of a person earning Non-Wage income.
Learn all about conjoint analysis in this guide by Survey Analytics. While we focus on choice-based conjoint because it is the most common, you can also learn about what it can be used for and how to conduct it in your research.
Aujourd’hui s’est tenu le lancement de la plaquette de l’apprentissage élaborée en partenariat avec la DIRECCTE, la Chambre de Commerce et d’Industrie des Hautes-Alpes-service Point A, la Mission Jeunes, Cap Emploi, le Centre de Formation d’apprentis Régional Des Métiers et de l’Artisanat, le C.F.A Agricole, la Maison Familiale Rurale de Ventavon, le Lycée Professionnel Poutrain et les Compagnons du Devoir.
L’objectif de cette démarche est de valoriser collectivement l’apprentissage et l’offre de formation présentent dans les Hautes-Alpes auprès des jeunes et de leurs familles pour rompre avec les idées reçues. Cette initiative amorce une dynamique nouvelle de travail collaboratif au moment où l’Etat développe un plan de relance de l’apprentissage et en fait une priorité.
Les partenaires prévoient un déploiement supplémentaire : réalisation d’un programme annuel commun des événements portés par chacun, sensibilisation des contrats d’apprentissage auprès des chefs d’entreprise hauts-alpins, participation sous une identité unique aux différents forums et manifestations…
This analysis focuses on
NASA’s internal environment, including leadership, processes, structure, and culture.
Additionally, it explores the impact of this environment on its successful strategic plan. From the
findings on Impact of Internal Factors on Strategic Planning, the researcher will make
conclusions.
- See more at: http://www.customwritingservice.org/blog/impact-of-internal-factors-on-strategicplanning/
N4 Communication - Basic Communication Principles for N4 students at TVET Col...Varsity College
This module lays the foundation for all communication studies. The Basic Communication Principles is Module 1 for N4 students at TVET Colleges in South Africa. These notes can be used as background for students' studies.
Городская неделя профилактики употребления алкоголя «Будущее в моих руках!»Андрей Афанасьев
В рамках городской недели профилактики употребления алкоголя среди обучающихся образовательных организаций социально-психологическая служба ЦО№1953 « Москва-98» с 05.10 2015-09.10.2015 проводила профилактическую неделю «Будущее в моих руках!», целью которой являлось выяснить исходный уровень информированности подростков об опасности употребления алкогольных напитков, создать предпосылки для формирования у учащихся отрицательного отношения к употреблению алкогольных напитков, развить у них навыки проявления силы воли и принятия собственных решений, а также приобщить их к труду, творчеству и спорту
Deviprasad Goenka Management college of Media Studies
http://www.dgmcms.org.in/
Subject:BRAND BUILDING
Lesson 7 : BRAND EQUITY
Faculty Name: Vishal Desai
We coach Brand Leader on the principles of good analysis, how to assess health and wealth of the brand and turning your analytical thinking into strategic stories, projections and reports. We look at:
1. Principles of Good Analytics Gain more support for your analysis by telling analytical stories through data.
2. Health and Wealth of the Brand Assess brand situation looking category, consumer, channels, brand and competitors
3. Analytical stories get Decision Makers to “what do you think” stage Analysis turns fact into insight and data breaks form the story that sets up strategic choices.
4. Turn analytical thinking into projections Extrapolating data into the future, starts with what you are see in the current.
5. Monthly Brand Report Keep everyone on the team informed, engaged and aware of the strategic thinking
Internal And External Marketing Elements PowerPoint Presentation SlidesSlideTeam
Internal And External Marketing Elements PowerPoint Presentation Slides is a powerful virtual tool for marketers to share their market insights. The impressive data visualization tools included in this market intelligence PPT theme will pique the interest of your audience. Even the most boring data can be presented in a gripping manner by the means of market analysis PowerPoint slideshow. Our market composition PPT template offers a custom solution for all marketers to portray market environment analysis framework. Convey your audience the most appropriate strategic analysis tool for various areas of marketing environment through this market evaluation PowerPoint presentation. Demonstrate macro and micro-environment factors in the most eye-catching way, using our internal and external organizational environment PPT deck. This factors affecting business environment PowerPoint theme is loaded with graphs, charts, infographics, and diagrams to facilitate an easy explanation of marketing dynamics. So, download our professionally crafted marketing environment analysis PPT slideshow to illustrate the impact of external and internal marketing components. https://bit.ly/3lA8kon
Measuring Customer-Experience ROI with social mediaMichael Wolfe
Validates and describes a very innovative and powerful approach for measuring the customer-brand-experience using social media experiential commentary. Not only is this a brea-through, but demonstrates the importance and value of the CX for brands.
C o l o r a d o S t a t e U n i v e r s i t y - P u e b l o .docxclairbycraft
C o l o r a d o S t a t e U n i v e r s i t y - P u e b l o
Division of Continuing Education Page 12
Independent Study and External Degree Completion Program
Lesson 3
Section 3: Once again there are questions listed for each of the chapters in this section.
Respond to them fully after stating the questions.
Section 3: Chapter 7: Question 1
The five steps for classical decision making are found on page 169, and the definition is on
page 171. In a risk environment or an uncertain environment, it may be very difficult to follow
these steps. How can a risk environment or an uncertain environment affect this process?
What is the difference between a risk environment and an uncertain environment?
Section 3: Chapter 7: Question 2
In the text, there is a discussion of framing errors, confirmation errors, escalating
commitment, availability bias, representativeness bias, anchoring bias, and adjustment bias.
Briefly define each of these errors and biases and provide an example of each one (not the one
in the text). These are particularly important since they are found in all levels of an
organization.
Section 3: Chapter 7: Question 3
Managers are often confronted with structured problems which require programmed
decisions, and unstructured problems which require non-programmed decisions. Serious
problems may require a crisis decision which is the most serious type of non-programmed
decision.
Provide an example of a programmed and non-programmed decision which you have
encountered in your own experience. How do you determine whether a decision is really a
programmed decision, or whether it actually requires a unique solution? When should senior
management become involved?
(Many programmed decisions are just that today. In retail they may be built into the computer
system, and made at the cash register – such as returns, returns with or without receipts, or
information available regarding a customer’s past transactions!)
Section 3: Chapter 8: Question 1
Organizations should have a mission statement, a strategic plan, organizational plans,
tactical plans, goals and objectives. Which of these should primarily be developed by directors
and senior management, middle management, and supervisors and other first level
management personnel? How can these plans be best aligned in order to clearly involve all
levels of management in these goals?
C o l o r a d o S t a t e U n i v e r s i t y - P u e b l o
Division of Continuing Education Page 13
Independent Study and External Degree Completion Program
Section 3: Chapter 8: Question 2
Benchmarking is often used as a way to improve an organization. What is organizational
benchmarking and how is it developed?
Section 3: Chapter 8: Question 3
Planners often use forecasting, contingency planning, and scenario planning. Define and
provide an example of each. The example should d.
Importing, Exporting and SourcingWhat’s this chapter aboutMalikPinckney86
Importing, Exporting and Sourcing
What’s this chapter about?
Important aspects of importing, exporting and sourcing
Key influencers for import, export and sourcing decisions
Multinational vs. Global Strategy
Companies engaged in international business activities can approach the market using either a multinational or a global strategy.
Export selling vs. Export marketing
Multinational strategy
A strategy of adapting products and their marketing strategies in each national market to suit local preferences.
Global strategy
A strategy of offering the same products using the same marketing strategy in all national markets.
Benefits and Drawbacks
Multinational strategy
Benefits
Drawbacks
Global strategy
Benefits
Drawbacks
Monitor and respond quickly to changes in buyer preferences
Inability to exploit scale economies
Costs savings from scale economies
Knowledge sharing
Only simple modifications to product features can be implemented
The Exporter “Must Do” List
Gain in depth understanding of the target market.
Conduct marketing research and identify market potential.
Make strategic decisions concerning 4Ps (marketing mix).
Expanding the “Must Do” List
Logistics
Packaging, transportation, etc.
Legal Procedures
Contracts, customs procedures, tariffs, etc.
After-sales service
Product discontinuation, parts availability, product repair, etc.
Sales Promotions
Advertising
Foreign Market Intelligence
Competition
Government Influence on Trade
Governments have long intervened in the trade of goods and services for political, economic and cultural reasons.
Encouraging Exports
Subsidies, tax breaks, export financing, etc.
Discouraging Imports
Tariffs, quotas, embargo, local content requirements, etc.
Encouraging Exports (Example)
Discouraging Imports
Can you think of examples?
Sourcing
What is sourcing?
What makes it so important?
In class discussion!
Factors that Affect Sourcing
Factory costs and conditions (land, labor, etc.)
Logistics
Infrastructure
Political risk
Exchange rates / currency convertibility
On Wednesday
Licensing, Investment, and Strategic Alliances (Part 1)
Segmenting, Targeting and Positioning
What’s this chapter about?
Important aspects of STP marketing
STP Marketing
Segmenting
Dividing a market based on demographics, lifestyles, behavioral measures etc.
Targeting
Selecting the most appropriate market(s)
Positioning
Target marketing messages using the 4Ps
Market Segmentation
Market segmentation is the division of consumer markets into meaningful and distinct groups.
Why is Market Segmentation important?
Marketers can better define consumer needs.
Decision makers can define objectives and allocate resources accurately.
Competitive advantage.
Segmentation Base …
is a group of characteristics that is used to assign segment members.
Demographics
Psychographics
Needs
Behavioral
Demographic ...
This complete deck is oriented to make sure you do not lag in your presentations. Our creatively crafted slides come with apt research and planning. This exclusive deck with twenty five slides is here to help you to strategize, plan, analyse, or segment the topic with clear understanding and apprehension. Utilize ready to use presentation slides on Brand Positioning Framework Powerpoint Presentation Slides with all sorts of editable templates, charts and graphs, overviews, analysis templates. It is usable for marking important decisions and covering critical issues. Display and present all possible kinds of underlying nuances, progress factors for an all inclusive presentation for the teams. This presentation deck can be used by all professionals, managers, individuals, internal external teams involved in any company organization.
Cleveland Research Company 2016 Stock Pitch Competition- Tempur Selay Finalist Alexander Liscum
One of 5 finalists chosen out of 25 competitive teams to present to equity research professionals in the 2016 CRC Stock Pitch Competition at Miami University.
Market Research - Course Slides
CONTENTS
1. Introduction
-Marketing Research
-Types of Market Research
-Research Methods
2.Qualitative Research Methods
- Focus Groups
- Depth Interview
- Projective Techniques
- Comparison of Qualitative Techniques
3. Observation Methods
4. Survey: Measurement and Scaling
- Intorduction
- Comparative Scales
- Non-comparative Scales
- Multi-item Scales
- Reliability and Validity
5.Questionnaire
- Asking Questions
- Overcoming Inability to Answer
- Overcoming Unwillingness to Answer
- Increasing Willingness of Respondents
- Determining the Order of Questions
- What’s Next?
6.Sampling
- Non-probability Sampling
- Probability Sampling
- Choosing Non-Probability vs. Probability Sampling
- Sample Size
7. Data Analysis: A Concise Overview of Statistical Techniques
- Descriptive Statistics: Some Popular Displays of Data
- Organizing Qualitative Data
- Organizing Quantitative Data
- Summarizing Data Numerically
- Cross-Tabulations
- Inferential Statistics: Can the results be generalized to population?
- Hypothesis Testing
- Strength of a Relationship in Cross-Tabulation
- Describing the Relationship Between Two (Ratio Scaled) Variables
8. Advanced Techniques of Market Analysis: A Brief Overview of Some Useful Concepts
- Conjoint Analysis
- Market Simulations
- Market Segmentation
- Perceptual Positioning Maps
9. Reporting Results
Brand Development Strategies PowerPoint Presentation SlidesSlideTeam
This complete deck can be used to present to your team. It has PPT slides on various topics highlighting all the core areas of your business needs. This complete deck focuses on Brand Development Strategies PowerPoint Presentation Slides and has professionally designed templates with suitable visuals and appropriate content. This deck consists of total of sixty six slides. All the slides are completely customizable for your convenience. You can change the colour, text and font size of these templates. You can add or delete the content if needed. Get access to this professionally designed complete presentation by clicking the download button below. http://bit.ly/2Vmdzya
B2B payments are rapidly changing. Find out the 5 key questions you need to be asking yourself to be sure you are mastering B2B payments today. Learn more at www.BlueSnap.com.
Discover the innovative and creative projects that highlight my journey throu...dylandmeas
Discover the innovative and creative projects that highlight my journey through Full Sail University. Below, you’ll find a collection of my work showcasing my skills and expertise in digital marketing, event planning, and media production.
VAT Registration Outlined In UAE: Benefits and Requirementsuae taxgpt
Vat Registration is a legal obligation for businesses meeting the threshold requirement, helping companies avoid fines and ramifications. Contact now!
https://viralsocialtrends.com/vat-registration-outlined-in-uae/
Digital Transformation and IT Strategy Toolkit and TemplatesAurelien Domont, MBA
This Digital Transformation and IT Strategy Toolkit was created by ex-McKinsey, Deloitte and BCG Management Consultants, after more than 5,000 hours of work. It is considered the world's best & most comprehensive Digital Transformation and IT Strategy Toolkit. It includes all the Frameworks, Best Practices & Templates required to successfully undertake the Digital Transformation of your organization and define a robust IT Strategy.
Editable Toolkit to help you reuse our content: 700 Powerpoint slides | 35 Excel sheets | 84 minutes of Video training
This PowerPoint presentation is only a small preview of our Toolkits. For more details, visit www.domontconsulting.com
The world of search engine optimization (SEO) is buzzing with discussions after Google confirmed that around 2,500 leaked internal documents related to its Search feature are indeed authentic. The revelation has sparked significant concerns within the SEO community. The leaked documents were initially reported by SEO experts Rand Fishkin and Mike King, igniting widespread analysis and discourse. For More Info:- https://news.arihantwebtech.com/search-disrupted-googles-leaked-documents-rock-the-seo-world/
Personal Brand Statement:
As an Army veteran dedicated to lifelong learning, I bring a disciplined, strategic mindset to my pursuits. I am constantly expanding my knowledge to innovate and lead effectively. My journey is driven by a commitment to excellence, and to make a meaningful impact in the world.
Understanding User Needs and Satisfying ThemAggregage
https://www.productmanagementtoday.com/frs/26903918/understanding-user-needs-and-satisfying-them
We know we want to create products which our customers find to be valuable. Whether we label it as customer-centric or product-led depends on how long we've been doing product management. There are three challenges we face when doing this. The obvious challenge is figuring out what our users need; the non-obvious challenges are in creating a shared understanding of those needs and in sensing if what we're doing is meeting those needs.
In this webinar, we won't focus on the research methods for discovering user-needs. We will focus on synthesis of the needs we discover, communication and alignment tools, and how we operationalize addressing those needs.
Industry expert Scott Sehlhorst will:
• Introduce a taxonomy for user goals with real world examples
• Present the Onion Diagram, a tool for contextualizing task-level goals
• Illustrate how customer journey maps capture activity-level and task-level goals
• Demonstrate the best approach to selection and prioritization of user-goals to address
• Highlight the crucial benchmarks, observable changes, in ensuring fulfillment of customer needs
Kseniya Leshchenko: Shared development support service model as the way to ma...Lviv Startup Club
Kseniya Leshchenko: Shared development support service model as the way to make small projects with small budgets profitable for the company (UA)
Kyiv PMDay 2024 Summer
Website – www.pmday.org
Youtube – https://www.youtube.com/startuplviv
FB – https://www.facebook.com/pmdayconference
Event Report - SAP Sapphire 2024 Orlando - lots of innovation and old challengesHolger Mueller
Holger Mueller of Constellation Research shares his key takeaways from SAP's Sapphire confernece, held in Orlando, June 3rd till 5th 2024, in the Orange Convention Center.
2. Understand your Industry
o Who are the key players
Ownership structure (Illusion of Choice!)
Market share of brands
Price/quality tiers
Generics/store brands
Marketing Mix (Promotion/AD)
o Information sources
Depends on the Industry (e.g. Comscore, IRI, Nielsen, IMS Health)
3. What we want
Insights into consumer decision making
Example: Why do we form loyalties?
How do we decode the black box? Elicit
preferences/decision rules?
Simply ask people (Stated preferences)
Observe what people do and reverse engineer to derive
underlying preferences or mechanisms (Revealed
preference)
Experimentation
4. Understand your Brand
Customers+ Competitors
o Some form of 80/20 analysis
o Who are the top customers?
Demographics
Location
Behavior/Life style (what else do they buy, what
Magazine/Sports/TV shows)
o Competition
o Elasticity (Own & Cross)
o Brand perceptions
11. 11
Differentiation and Positioning
• Differentiation: “The creation of tangible or
intangible differences on one or two key
dimensions between a focal product and its
main competitors”
– How do retailers differentiate?
– How do airlines differentiate?
• Positioning: “The set of strategies that
firms develop and implement to ensure
that the differences occupy a distinct and
important position in the minds of
consumers”
– Example: Auto Rentals
– Positioning an issue:
CO2http://www.youtube.com/watch?v=7sGKvDNdJNA
18. 18
Other Issues in Positioning
Me Too Positioning
Strong Positioning: Activity
Managing Your Image
19. 19
A good positioning strategy requires …
An understanding of the
dimensions along which the
consumer perceives the
product
Knowing how
competitors’ products are
perceived along these
dimensions
Identifying the gaps that
your product can fill
20. 20
Creating Perceptual Maps in R
Overall
S3
S2
S1
Poor_value
Avant_Garde
Successful
Economical
Common
Hi_prestige
Easy_Service
Roomy
Uncomfortable
Sporty
Interesting
Poorly_built
Unreliable
Quiet
Attractive
Mercury Capri
BMW 318i
Pontiac Firebird
Saab 900
Honda Prelude
Eagle Talon
Toyota Supra
Audi 90
Ford T-Bird G20
22. 22
Older Techniques for Brand Similarity
Please rate the following pairs of toothpaste brands on the basis
of their similarity (1 = very similar, 9 = very dissimilar).
Very Very
Similar Dissimilar
1. Aqua-Fresh vs Crest 1 2 3 4 5 6 7
2. Aqua-Fresh vs Colgate 1 2 3 4 5 6 7
…
45. Pepsodent vs Dentagard 1 2 3 4 5 6 7
Aqua-Fresh Crest Colgate Aim Gleem Macleans Ultra Brite Close-Up Pepsodent Dentagard
Aqua-Fresh
Crest 3
Colgate 2 1
Aim 4 2 2
Gleem 6 5 4 3
Macleans 5 5 4 4 3
Ultra Brite 6 6 6 5 3 3
Close-Up 6 6 6 6 2 3 2
Pepsodent 6 6 6 6 2 2 1 2
Dentagard 7 6 4 6 4 5 5 4 5
Average of which brand pairs are considered most (dis)similar?
23. 23
Data on Attributes & Preference
Popular
with men
Popular
with
women
Good
Value
Heavy
Full
Bodied
Special
Occasion
On a
Budget
Bud 4 6 7 2 2 3 7
Beck’s 7 3 4 3 5 5 3
. . . . . . . .
. . . . . . . .
. . . . . . . .
Stroh’s 3 2 3 6 5 5 2
Respondent 1
Overall Rating
Bud 6
Beck’s 9
.
.
.
Stroh’s 3
Your overall rating for
each Beer:
1 2 3 4 5 6 7 8 9
Rating of
Brands on
different
attributes
24. 24
Input to Factor Analysis
Vectors of attributes can be plotted based on factor loadings.
Individual brand’s location on the perceptual map is based on
factor scores.
Heavy Pop/Men Pop/Women Full Bodied Blue Collar Good Value Spec Occ
Beck's
Budweiser
Coors
Ratings of the brands on each attributes averaged
across All Respondents
Coors light
Heineken
Meister Brau
Michelob
Miller
Miller Lite
Stroh's
30. Interpreting the Output
We are not
capturing
several
attributes
well. These
are
somewhat
unique, not
correlated
with other
If we use 9
Factors
rather than
52 attributes
we capture
about 72%
of total
information
Factors are arranged in terms of proportion of variance explained
31. Factor Analyze the Data to Understand the Correlation Structure
Notice that some of the
variables that had high
“uniqueness” are not correlated
with the Factors. If these were
important in our context, we
will keep them as individual
variables.
Labels of Factors is Subjective
Factor 1: “Best Brand”
Factor 2: Innovative/Visionary
Factor 3: Prestigious
Factor 4: Fun/Friendly
Factor 5: Caring
Factor 6: Stylish
Factor 7: Different
Factor 8: Energetic
Factor 9: ??
32. Interpret The factors
It is our job to interpret what these underlying
“factors/themes” are
Go down each column and look for large positive or
negative numbers
These are correlations between original variables and the
“Factors”
Large numbers help us interpret what these underlying
Factors are
Note that R has created 9 new variables “Scores”
33.
34. The new Variables (Scores) are
(1) Standardized: They have mean of 0 and std. deviation of 1
(2) Uncorrelated with each other
35. Using New Variables
• Run a regression of “Brand Asset” on the 9 Factor
Model 1
(Intercept) 51.13 (0.24)***
Factor1 22.37 (0.24)***
Factor2 8.16 (0.25)***
Factor3 -1.82 (0.25)***
Factor4 5.38 (0.25)***
Factor5 2.87 (0.26)***
Factor6 -0.86 (0.25)***
Factor7 -4.90 (0.26)***
Factor8 1.98 (0.26)***
Factor9 -4.52 (0.27)***
R2 0.76
Adj. R2 0.76
Num. obs. 3669
***p < 0.001, **p < 0.01, *p < 0.05