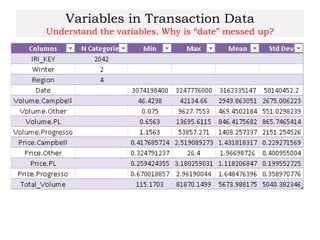
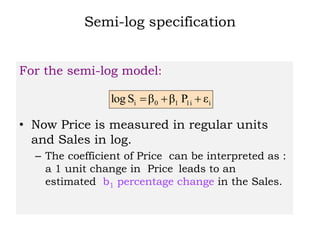
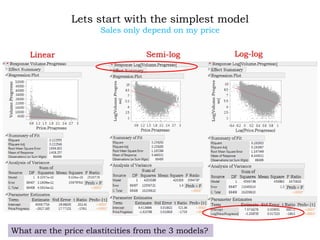
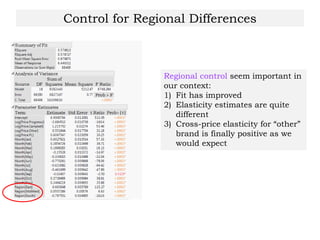
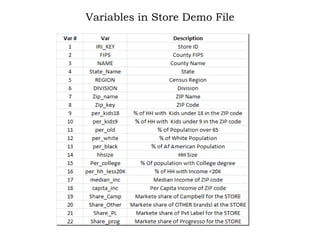
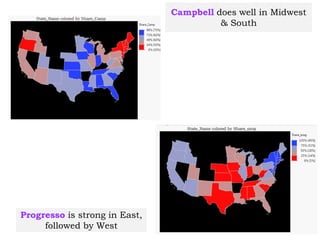
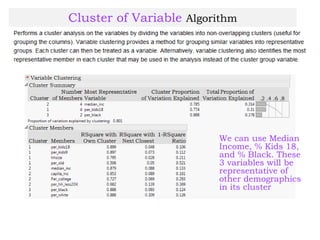
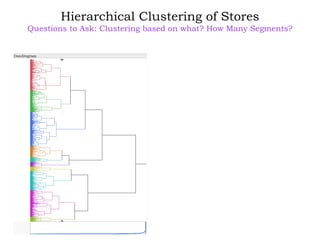
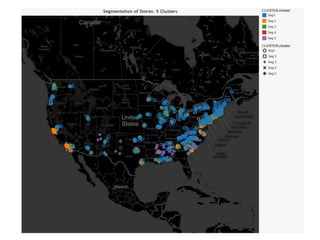
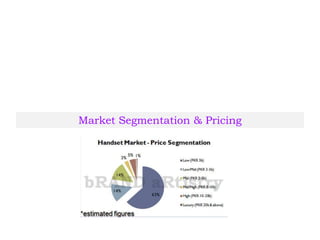
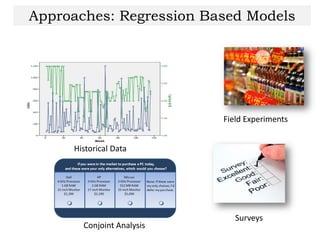
This case study examines the pricing strategy for Progresso soup using data from over 1900 supermarkets across the U.S. It focuses on evaluating the effectiveness of countercyclical pricing, analyzing price elasticity, and segmenting the market based on demographics. The study also explores regression modeling and clustering techniques to inform better pricing strategies for maximum profitability.
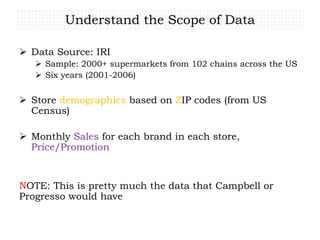


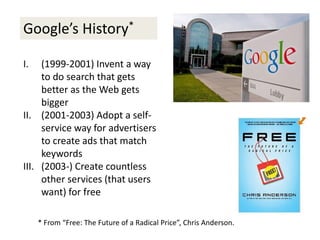
![Competition Manufacturer Distributor Retailer
Channel Pricing
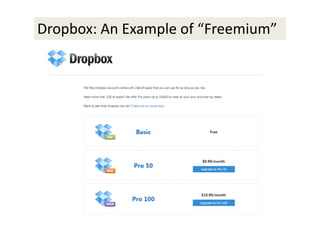
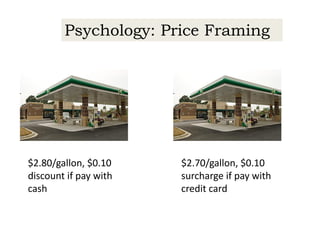
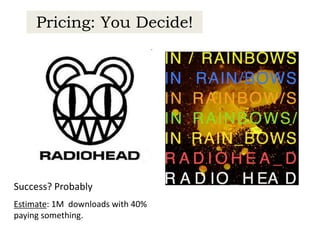
Psychology and Pricing
Demand Measurement
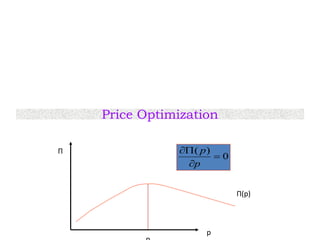
Π(p) = p*q(p) – [FC + c*q(p)]](https://image.slidesharecdn.com/progressocase1-151019220841-lva1-app6891/85/Pricing-Strategies-for-Brands-67-320.jpg)


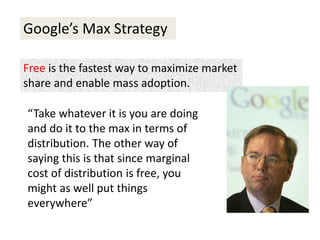
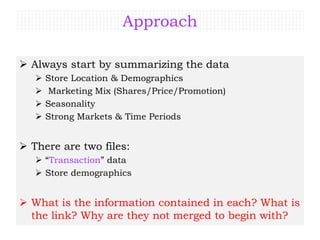
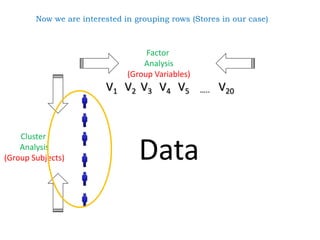
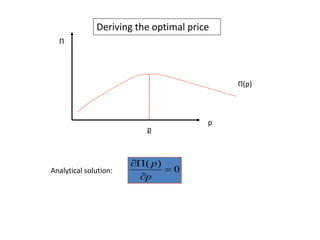
![Simple case
• Given knowledge of my sales’ sensitivity to
price and cost structure, how should I
price?
• Let q(p) be my sales at price p. Total profit
at p is then
• To make things easy assume that you are
the market leader (ignore competition)
Π(p) = p*q(p) – [FC + c*q(p)]
Total cost at the price p](https://image.slidesharecdn.com/progressocase1-151019220841-lva1-app6891/85/Pricing-Strategies-for-Brands-86-320.jpg)


![1999 marketing models of consumer jrnl of econ[1]](https://cdn.slidesharecdn.com/ss_thumbnails/1999marketingmodelsofconsumerjrnlofecon1-100928122033-phpapp01-thumbnail.jpg?width=640&height=640&fit=bounds)


