This document discusses big data in psychology and summarizes an expert's work analyzing large datasets. It contains the following key points:
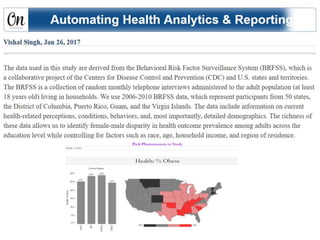
1. The expert develops automated analytics workflows to dynamically update analyses and summaries as new data becomes available, allowing for fully reproducible research.
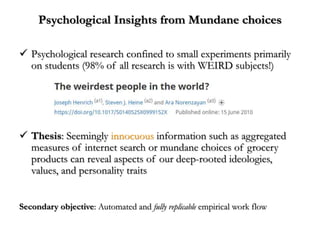
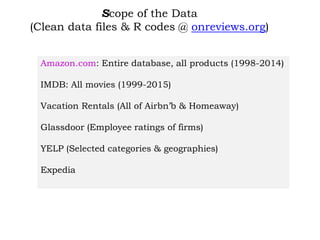
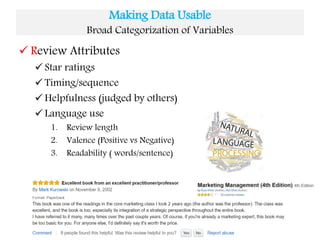
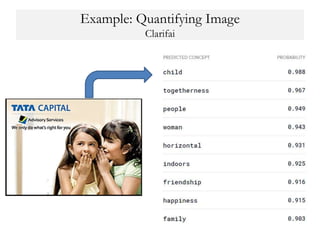
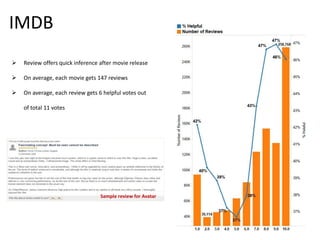
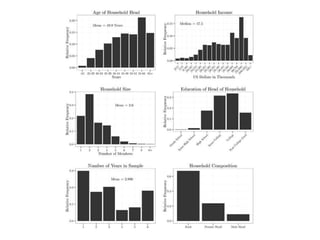
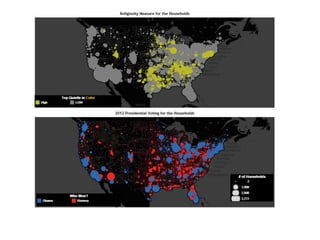
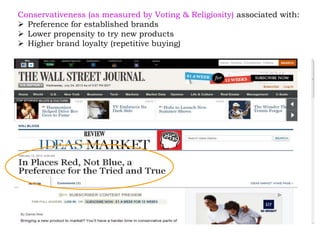
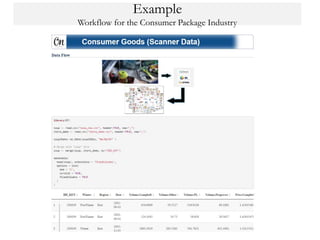
2. Analyzing diverse datasets like online reviews and consumer transaction records provides insights into human values, personality, and decision-making from mundane choices.
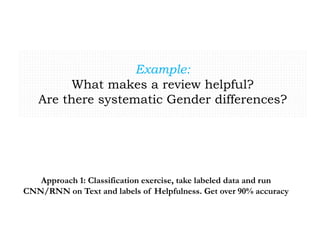
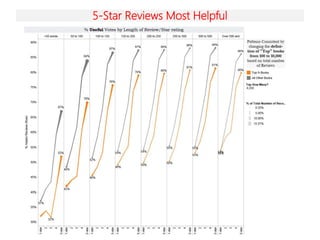
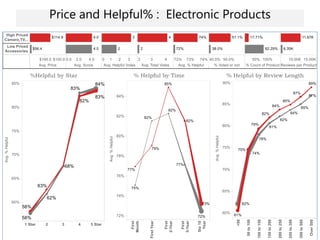
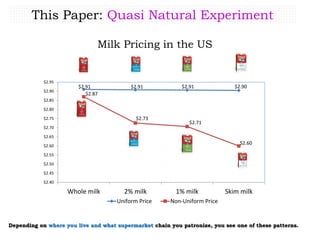
3. Examples show reviews with negative ratings or elaborated reasoning tend to be judged more helpful, and price sensitivity can be detected from habitual purchasing patterns in transaction data.