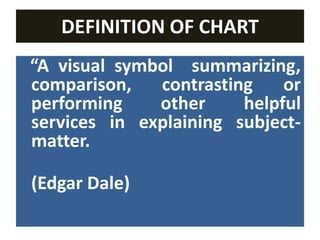
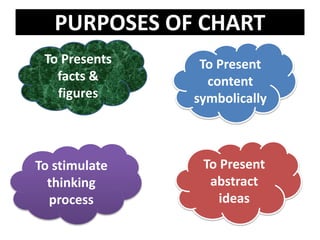
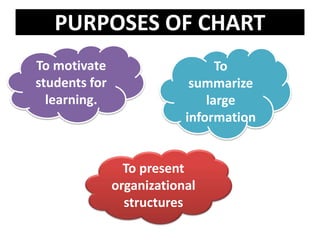
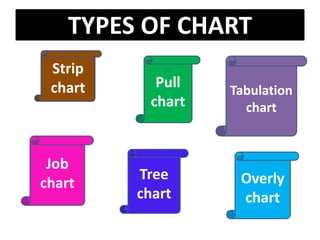
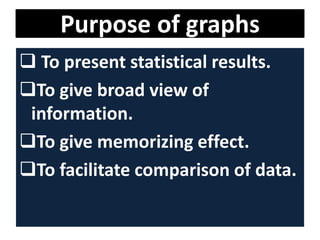
DEFINITION OF CHART
A chart is visual aid
representing the data in form
of symbols, diagrams, flow
chart etc. by using specific
guidelines.
DEFINITION OF CHART
“A visual symbol summarizing,
comparison, contrasting or
performing other helpful
services in explaining subject-
matter.
(Edgar Dale)
PURPOSES OF CHART
To Presents
facts &
figures
To Present
content
symbolically
To Present
abstract
ideas
To stimulate
thinking
process
PURPOSES OF CHART
To motivate
students for
learning.
To
summarize
large
information
To present
organizational
structures
CHARACTERISTICS OF A CHART
Give
Specific
information
Can
Carefully
stored
Easy to
carry
Educational
value
90x 60 cm
70 x 50 cm
TYPES OF CHART
Flow
chart
Cause
and
effect
chart
Chain
chart
Flip
chart
Time
table
chart
Evolution
chart
TYPES OF CHART
Strip
chart
Job
chart
Tree
chart
Pull
chart
Tabulation
chart
Overly
chart
TYPES OF CHART
 Flow chart
Diagrams are used to show organizational
relationship boxes connected with lines
to show the levels of lines of authority. In
this lines, rectangles, circles or other
graphic presentation are connected by
lines showing the direction of flow.
TYPES OF CHART
Flip chart
A set of charts related to specific
topics that have been tagged
together and hung on a supporting
stand. The individual charts carry a
series of related material or
messages in a sequence.
Timetable chart
These are used to show the schedule of an
activity or schedule of an individual. For eg.
Timetable of a class , tour chart.
Cause and effect chart
This kind of chart shows the arrangement
of facts and ideas for expressing the
relationship between rights and
responsibilities or between a complex of
conditions and change or conflict.
Chain chart
the arrangement of facts and ideas for
expressing transitions or cycles.
Evolution chart
Facts and ideas for expressing changes in
specific items from the starting data and its
projections in the future.
Striptease chart
Strip chart has some peculiar characteristics such as
 it enables speakers to present the information step by
step.
 it increases the interest and imagination of the audience.
 the information on the chart is covered with thin paper
strips applied either by wax.
 as the speaker wishes to visually reinforce a point with
words, he removes the appropriate strip or paper.
 it produces interest and it increases learning.
 Pull chart
It consists of written message hidden by strips of
thick paper. The message can be shown to the
viewer, one after another by pulling out the
concealing strips.
 Tabulation chart
It shows the schedule of an activity of or of an
individual. For e.g – Timetable of a class. The chart
should be 50 x 75 cm or more in size and captioned
in bold letters.
 Job chart
A job chart includes the major responsibilities of
the category of personnel for ready references.
 Tree chart
Tree charts include the growth and development of
specific phenomenons or organizations in a continous
growing process depicted in the form of a tree.
 Overly chart
These charts consist of illustrated sheets that can be
placed one over another conveniently and in succession.
It enable the viewers to see not only the different parts
but also see them against the total perspective when
one is placed over the other.
GUIDELINES FOR PREPARING AN
USING CHARTS
Size -90x60 cm (or) 70 x 50 cm
Size of letters 2-3 cm & visible
Line thickness 2-3 cm
Content contrasted with background
Concise, neat and tidy with one area
Place enlarged pictures on chart
Advantages
Of
chart
Quick
learning
LIMITATIONS OF A CHART
 If the selection of material for
preparing charts is not good, they will
not last long.
 Takes up a teacher’s time if she has to
prepare the chart.
 charts only emphasis on the key
points.
Poor use of color combination,
improper spacing and margins create
confusion in the minds of students.
Flip chart
Illustration made on paper that is
usually larger than 21 cm or 27 cm ,
bounded together with rings or
strings. They flip over in sequences.
 size of audience should be 15-30
people.
Preparation of Flip chart
 First card should give brief
information about topic.
 8-10 cards can be used in bunch.
Each card should show picture
illustration at front side, conveying one
idea at a time.
Leave enough border so that it does
not cover the matter with hand while
holding.
Advantages of flip chart
It is good way to present information.
Disadvantages of flip chart
Artistic ability is required to make it.
Graphs
Definition of Graphs
Graphs are numerical and
illustrations to present numerical
and statistical data using dots,
lines, shapes, colours and pictures.
Graphical presentation is visual art
based on use of visual symbolic
and visual abstract forms.
Characteristics of graphs
 Title
Index
Balanced width and height
Footnotes
Simplicity
Neat & clean
Purpose of graphs
 To present statistical results.
To give broad view of
information.
To give memorizing effect.
To facilitate comparison of data.
Types of graphs
1.Bar graph
2.Pie graph
3.Line graph
4.Pictorial graph
1. Bar graph
2. Line graph
The concepts are represented with the help of
lines drawn either horizontallly and vertically.
3. Pie graph
The whole area of circle represents the entire
data under consideration.
4. Pictorial graph
This method is useful to impress the frequency
of occurance of events.
Limitations of graph
 Sometimes may be quite confusing to a
lay man.
Generally presents only quantitative
aspects of data.
Can be used for presenting only one
thing or smaller information at one
time.
 They can present only appropriate
values.
Recaptulization
 size of chart is……………………..
 size of letter on chart should be…………..
 Data is presented in ……………form in pie
chart.
…………………cards are used in bunch of flip
chart.
Answer key
 90x 60 cm or 70 x 50 cm
2-3 cm
 circle
8-10
Bibliography
 Patidar B,Anurag. Communication and
nursing education, edition 1st ,pearson
publication. Pg no. 172-75.
 sharma K. Suresh, Nursing education, edition
1st, elsevier publication.pg no. 102-105
www.scribd.com
Powerpoint presentation on chart, graph.pptx

Powerpoint presentation on chart, graph.pptx

  • 1.
    DEFINITION OF CHART Achart is visual aid representing the data in form of symbols, diagrams, flow chart etc. by using specific guidelines.
  • 2.
    DEFINITION OF CHART “Avisual symbol summarizing, comparison, contrasting or performing other helpful services in explaining subject- matter. (Edgar Dale)
  • 3.
    PURPOSES OF CHART ToPresents facts & figures To Present content symbolically To Present abstract ideas To stimulate thinking process
  • 4.
    PURPOSES OF CHART Tomotivate students for learning. To summarize large information To present organizational structures
  • 5.
    CHARACTERISTICS OF ACHART Give Specific information Can Carefully stored Easy to carry Educational value 90x 60 cm 70 x 50 cm
  • 6.
  • 7.
  • 8.
    TYPES OF CHART Flow chart Diagrams are used to show organizational relationship boxes connected with lines to show the levels of lines of authority. In this lines, rectangles, circles or other graphic presentation are connected by lines showing the direction of flow.
  • 9.
    TYPES OF CHART Flipchart A set of charts related to specific topics that have been tagged together and hung on a supporting stand. The individual charts carry a series of related material or messages in a sequence.
  • 10.
    Timetable chart These areused to show the schedule of an activity or schedule of an individual. For eg. Timetable of a class , tour chart. Cause and effect chart This kind of chart shows the arrangement of facts and ideas for expressing the relationship between rights and responsibilities or between a complex of conditions and change or conflict.
  • 11.
    Chain chart the arrangementof facts and ideas for expressing transitions or cycles. Evolution chart Facts and ideas for expressing changes in specific items from the starting data and its projections in the future.
  • 12.
    Striptease chart Strip charthas some peculiar characteristics such as  it enables speakers to present the information step by step.  it increases the interest and imagination of the audience.  the information on the chart is covered with thin paper strips applied either by wax.  as the speaker wishes to visually reinforce a point with words, he removes the appropriate strip or paper.  it produces interest and it increases learning.
  • 13.
     Pull chart Itconsists of written message hidden by strips of thick paper. The message can be shown to the viewer, one after another by pulling out the concealing strips.  Tabulation chart It shows the schedule of an activity of or of an individual. For e.g – Timetable of a class. The chart should be 50 x 75 cm or more in size and captioned in bold letters.  Job chart A job chart includes the major responsibilities of the category of personnel for ready references.
  • 14.
     Tree chart Treecharts include the growth and development of specific phenomenons or organizations in a continous growing process depicted in the form of a tree.  Overly chart These charts consist of illustrated sheets that can be placed one over another conveniently and in succession. It enable the viewers to see not only the different parts but also see them against the total perspective when one is placed over the other.
  • 15.
    GUIDELINES FOR PREPARINGAN USING CHARTS Size -90x60 cm (or) 70 x 50 cm Size of letters 2-3 cm & visible Line thickness 2-3 cm Content contrasted with background Concise, neat and tidy with one area Place enlarged pictures on chart
  • 16.
  • 17.
    LIMITATIONS OF ACHART  If the selection of material for preparing charts is not good, they will not last long.  Takes up a teacher’s time if she has to prepare the chart.  charts only emphasis on the key points. Poor use of color combination, improper spacing and margins create confusion in the minds of students.
  • 18.
    Flip chart Illustration madeon paper that is usually larger than 21 cm or 27 cm , bounded together with rings or strings. They flip over in sequences.  size of audience should be 15-30 people.
  • 19.
    Preparation of Flipchart  First card should give brief information about topic.  8-10 cards can be used in bunch. Each card should show picture illustration at front side, conveying one idea at a time. Leave enough border so that it does not cover the matter with hand while holding.
  • 20.
    Advantages of flipchart It is good way to present information.
  • 21.
    Disadvantages of flipchart Artistic ability is required to make it.
  • 22.
  • 23.
    Definition of Graphs Graphsare numerical and illustrations to present numerical and statistical data using dots, lines, shapes, colours and pictures. Graphical presentation is visual art based on use of visual symbolic and visual abstract forms.
  • 24.
    Characteristics of graphs Title Index Balanced width and height Footnotes Simplicity Neat & clean
  • 25.
    Purpose of graphs To present statistical results. To give broad view of information. To give memorizing effect. To facilitate comparison of data.
  • 26.
    Types of graphs 1.Bargraph 2.Pie graph 3.Line graph 4.Pictorial graph
  • 27.
  • 28.
    2. Line graph Theconcepts are represented with the help of lines drawn either horizontallly and vertically.
  • 29.
    3. Pie graph Thewhole area of circle represents the entire data under consideration.
  • 30.
    4. Pictorial graph Thismethod is useful to impress the frequency of occurance of events.
  • 31.
    Limitations of graph Sometimes may be quite confusing to a lay man. Generally presents only quantitative aspects of data. Can be used for presenting only one thing or smaller information at one time.  They can present only appropriate values.
  • 32.
    Recaptulization  size ofchart is……………………..  size of letter on chart should be…………..  Data is presented in ……………form in pie chart. …………………cards are used in bunch of flip chart.
  • 33.
    Answer key  90x60 cm or 70 x 50 cm 2-3 cm  circle 8-10
  • 34.
    Bibliography  Patidar B,Anurag.Communication and nursing education, edition 1st ,pearson publication. Pg no. 172-75.  sharma K. Suresh, Nursing education, edition 1st, elsevier publication.pg no. 102-105 www.scribd.com