SlideShare a Scribd company logo
1 of 4
VISUAL INFORMATION
Researchers across academic disciplines are well trained in using writing to develop and convey their insights, but
only some learn how visuals can help them organize and communicate their ideas.
Academic Writing is the formal tone and attitude of writing in which visual information is one of its element.
Meaning: The use of visuals (rather than words) to communicate an idea or support an argument.
Use of one or more of the various visual media with or without sound. Generally, visual information includes still
photography, motion picture photography, video or audio recording, graphic arts, visual aids, models, display,
visual presentation services, and the support processes.
Research suggests that information displayed visually is well remembered: "retention of information three days after a
meeting or other event is six times greater when information is presented by visual and oral means than when the
information is presented by the spokenword alone." (U.S. Department of Labor OSHA Office of Training and
Education, 1996)
Although visuals do largely speak for themselves, it is usual to help the reader interpret them by briefly
commenting on their main features when referring to visual information in the text, the word figure is used for
everything (such as maps, charts and graphs) except tables.
Figures and tables should be numbered and given a title.
Titles of tables are written above, while titles of figures are written below the data.
As with other data, sources must be given for all visual information.
If you are writing a lengthy work, such as a dissertation, you will need to provide lists of tables and figures,
showing numbers, titles and page numbers, after the contents page.
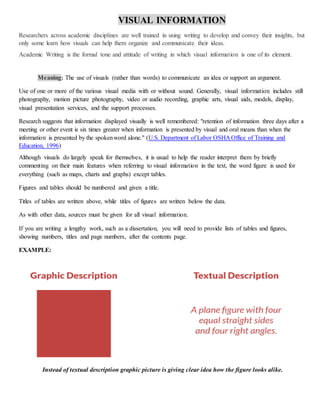
EXAMPLE:
Instead of textual description graphic picture is giving clear idea how the figure looks alike.
TYPES OF VISUAL INFORMATION
 Tablesandfiguresmaybe usedas evidence tosupportacademicargument.
 They are mostly used in report writing.
 It is important that tables and figures are used purposefully (i.e. with good reason) and referenced
correctly.
 Tables are used in academic text to display
 Statistical data
 Comparison of information
 Illustrate the functions
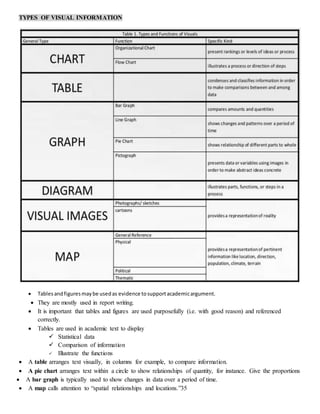
 A table arranges text visually, in columns for example, to compare information.
 A pie chart arranges text within a circle to show relationships of quantity, for instance. Give the proportions
 A bar graph is typically used to show changes in data over a period of time.
 A map calls attention to “spatial relationships and locations.”35
TABLES:
BAR GRAPHA:
PIE CHART:
EDUCATIONAL IMPLICATION:
It’s well worth learning what you can, because visuals have the unique ability to help us:
 Develop ideas and understand experiences that language cannot yet describe
 Gather and analyze complex and/or abstract ideas in simple, immediate ways
 Communicate across language, knowledge, ideological, and other barriers
 Impact decision-making, which largely happens in our pre-lingual, pre-rational brains
 Visual aids are worth including in your presentations because they can help you explain information more
coherently which makes presenting easier for you and learning easier for the audience.
 They also help add variety to your presentation thus making it more interesting for the audience. If the
audience understands what you're saying and they are more engaged, they're more likely to be persuaded by
you.
 On other hand, well-selected images can improve comprehension and insight when developers
strategically place such graphics within a course. Unlike text, pictures have the power to enrich
communication and stimulate emotional response. In order to utilize visuals in a way that will
reinforce course material and facilitate learning, it is necessary to use images that:
 Represent actual objects, people, or places.
 Simplify complex or abstract ideas.
 Bridge already learned materials with the unfamiliar.
SELF RELECTION:
 If you are writing a lengthy work, such as a dissertation, you will need to provide lists of tables and
figures, showing numbers, titles and page numbers, after the content page that could be easily farmed by
using visual information element.
 Visual information make the textual content interesting.
 Visual adhere the interest of readers and it gives clear picture
REFERENCES:
http://www.conradiator.com/resources/pdf/literacies4eigvil_ct2003.pdf
https://pdfs.semanticscholar.org/8f6c/36d260763dd3dd33c53b5b1edc21a8755a28.pdf
https://www.kau.edu.sa/Files/0013287/Subjects/academic-writing-handbook-international-students-3rd-ed%20(2).pdf
https://www.researchgate.net/publication/286909809_Visual_Literacy_in_Educational_Practice

More Related Content

What's hot

Translation and politics 1
Translation and politics 1Translation and politics 1
Translation and politics 1Susan Erdmann
 
What is it european day of languages
What is it european day of languagesWhat is it european day of languages
What is it european day of languagesivid1990
 
Approaching Language Analysis
Approaching Language AnalysisApproaching Language Analysis
Approaching Language Analysismmcdonald2
 
Discourse Analysis for Social Research
Discourse Analysis for Social ResearchDiscourse Analysis for Social Research
Discourse Analysis for Social ResearchDominik Lukes
 
Equivalencein translation
Equivalencein translationEquivalencein translation
Equivalencein translationDorina Moisa
 
Economy of Australia
Economy of AustraliaEconomy of Australia
Economy of Australiabert_j
 

What's hot (6)

Translation and politics 1
Translation and politics 1Translation and politics 1
Translation and politics 1
 
What is it european day of languages
What is it european day of languagesWhat is it european day of languages
What is it european day of languages
 
Approaching Language Analysis
Approaching Language AnalysisApproaching Language Analysis
Approaching Language Analysis
 
Discourse Analysis for Social Research
Discourse Analysis for Social ResearchDiscourse Analysis for Social Research
Discourse Analysis for Social Research
 
Equivalencein translation
Equivalencein translationEquivalencein translation
Equivalencein translation
 
Economy of Australia
Economy of AustraliaEconomy of Australia
Economy of Australia
 

Similar to Visual Information writeup

Educational Technology Graphic/Audio Visual Materials
Educational Technology Graphic/Audio Visual MaterialsEducational Technology Graphic/Audio Visual Materials
Educational Technology Graphic/Audio Visual MaterialsAvigail Gabaleo Maximo
 
Concept mapping, mind mapping and argumentmapping what are .docx
Concept mapping, mind mapping and argumentmapping what are .docxConcept mapping, mind mapping and argumentmapping what are .docx
Concept mapping, mind mapping and argumentmapping what are .docxpatricke8
 
Graphic inquiry
Graphic inquiryGraphic inquiry
Graphic inquiryJenn Alevy
 
Graphic organiser
Graphic organiserGraphic organiser
Graphic organiserSARATH K C
 
GRAPHIC ORGANISER
GRAPHIC ORGANISERGRAPHIC ORGANISER
GRAPHIC ORGANISERSARATH K C
 
Grup 3 graphic organizer pak deden
Grup 3 graphic organizer pak dedenGrup 3 graphic organizer pak deden
Grup 3 graphic organizer pak dedenfirdaputri841
 
Visual Aids in Communication
Visual Aids in CommunicationVisual Aids in Communication
Visual Aids in CommunicationNEETHU S JAYAN
 
Getting graphic About Infographics: Design Lessons Learned From Popular Infog...
Getting graphic About Infographics: Design Lessons Learned From Popular Infog...Getting graphic About Infographics: Design Lessons Learned From Popular Infog...
Getting graphic About Infographics: Design Lessons Learned From Popular Infog...Patrick Lowenthal
 
20080626012119_727.ppt
20080626012119_727.ppt20080626012119_727.ppt
20080626012119_727.pptIANROLDAN1
 
Introduction to Infographic Design
Introduction to Infographic DesignIntroduction to Infographic Design
Introduction to Infographic DesignAmanda Makulec
 
Research Chapter 4:Presentation, Analysis, and Interpretation of data
Research Chapter 4:Presentation, Analysis, and Interpretation of dataResearch Chapter 4:Presentation, Analysis, and Interpretation of data
Research Chapter 4:Presentation, Analysis, and Interpretation of dataRoxanneMayGallardo
 
W2L1-Textual-Aids-Inferno-Canto.pptx
W2L1-Textual-Aids-Inferno-Canto.pptxW2L1-Textual-Aids-Inferno-Canto.pptx
W2L1-Textual-Aids-Inferno-Canto.pptxCrisDelaRosa6
 
Extension presentation
Extension presentationExtension presentation
Extension presentationalkapant123
 

Similar to Visual Information writeup (20)

Educational Technology Graphic/Audio Visual Materials
Educational Technology Graphic/Audio Visual MaterialsEducational Technology Graphic/Audio Visual Materials
Educational Technology Graphic/Audio Visual Materials
 
Penilaian kendiri
Penilaian kendiri Penilaian kendiri
Penilaian kendiri
 
Penilaian kendiri buku
Penilaian kendiri bukuPenilaian kendiri buku
Penilaian kendiri buku
 
Penilaian kendiri
Penilaian kendiri Penilaian kendiri
Penilaian kendiri
 
Concept mapping, mind mapping and argumentmapping what are .docx
Concept mapping, mind mapping and argumentmapping what are .docxConcept mapping, mind mapping and argumentmapping what are .docx
Concept mapping, mind mapping and argumentmapping what are .docx
 
Graphic inquiry
Graphic inquiryGraphic inquiry
Graphic inquiry
 
Graphic organiser
Graphic organiserGraphic organiser
Graphic organiser
 
GRAPHIC ORGANISER
GRAPHIC ORGANISERGRAPHIC ORGANISER
GRAPHIC ORGANISER
 
Grup 3 graphic organizer pak deden
Grup 3 graphic organizer pak dedenGrup 3 graphic organizer pak deden
Grup 3 graphic organizer pak deden
 
Visual Aids in Communication
Visual Aids in CommunicationVisual Aids in Communication
Visual Aids in Communication
 
Getting graphic About Infographics: Design Lessons Learned From Popular Infog...
Getting graphic About Infographics: Design Lessons Learned From Popular Infog...Getting graphic About Infographics: Design Lessons Learned From Popular Infog...
Getting graphic About Infographics: Design Lessons Learned From Popular Infog...
 
Pedagogy
PedagogyPedagogy
Pedagogy
 
20080626012119_727.ppt
20080626012119_727.ppt20080626012119_727.ppt
20080626012119_727.ppt
 
ONLINE ASSIGNMENT
ONLINE ASSIGNMENT ONLINE ASSIGNMENT
ONLINE ASSIGNMENT
 
Diagram
DiagramDiagram
Diagram
 
Introduction to Infographic Design
Introduction to Infographic DesignIntroduction to Infographic Design
Introduction to Infographic Design
 
Research Chapter 4:Presentation, Analysis, and Interpretation of data
Research Chapter 4:Presentation, Analysis, and Interpretation of dataResearch Chapter 4:Presentation, Analysis, and Interpretation of data
Research Chapter 4:Presentation, Analysis, and Interpretation of data
 
W2L1-Textual-Aids-Inferno-Canto.pptx
W2L1-Textual-Aids-Inferno-Canto.pptxW2L1-Textual-Aids-Inferno-Canto.pptx
W2L1-Textual-Aids-Inferno-Canto.pptx
 
Infograph Power!
Infograph Power!Infograph Power!
Infograph Power!
 
Extension presentation
Extension presentationExtension presentation
Extension presentation
 

More from Nafisa Khan

Play based method writeup
Play based method writeupPlay based method writeup
Play based method writeupNafisa Khan
 
Experiential learning by david Kolb writeup
Experiential learning by david Kolb writeupExperiential learning by david Kolb writeup
Experiential learning by david Kolb writeupNafisa Khan
 
J. Krishnamurthy writeup
J. Krishnamurthy writeupJ. Krishnamurthy writeup
J. Krishnamurthy writeupNafisa Khan
 
Journal Study writeup
Journal Study writeupJournal Study writeup
Journal Study writeupNafisa Khan
 
Visual Information
Visual Information Visual Information
Visual Information Nafisa Khan
 
Experiential Learning by David Kolb
Experiential Learning by David KolbExperiential Learning by David Kolb
Experiential Learning by David KolbNafisa Khan
 
J.Krishnamurthy
J.Krishnamurthy J.Krishnamurthy
J.Krishnamurthy Nafisa Khan
 
Educational Administration and Management
Educational Administration and ManagementEducational Administration and Management
Educational Administration and ManagementNafisa Khan
 

More from Nafisa Khan (9)

Play based method writeup
Play based method writeupPlay based method writeup
Play based method writeup
 
Experiential learning by david Kolb writeup
Experiential learning by david Kolb writeupExperiential learning by david Kolb writeup
Experiential learning by david Kolb writeup
 
J. Krishnamurthy writeup
J. Krishnamurthy writeupJ. Krishnamurthy writeup
J. Krishnamurthy writeup
 
Journal Study writeup
Journal Study writeupJournal Study writeup
Journal Study writeup
 
Visual Information
Visual Information Visual Information
Visual Information
 
Experiential Learning by David Kolb
Experiential Learning by David KolbExperiential Learning by David Kolb
Experiential Learning by David Kolb
 
J.Krishnamurthy
J.Krishnamurthy J.Krishnamurthy
J.Krishnamurthy
 
Journal Study
Journal StudyJournal Study
Journal Study
 
Educational Administration and Management
Educational Administration and ManagementEducational Administration and Management
Educational Administration and Management
 

Recently uploaded

Science 7 - LAND and SEA BREEZE and its Characteristics
Science 7 - LAND and SEA BREEZE and its CharacteristicsScience 7 - LAND and SEA BREEZE and its Characteristics
Science 7 - LAND and SEA BREEZE and its CharacteristicsKarinaGenton
 
Blooming Together_ Growing a Community Garden Worksheet.docx
Blooming Together_ Growing a Community Garden Worksheet.docxBlooming Together_ Growing a Community Garden Worksheet.docx
Blooming Together_ Growing a Community Garden Worksheet.docxUnboundStockton
 
Final demo Grade 9 for demo Plan dessert.pptx
Final demo Grade 9 for demo Plan dessert.pptxFinal demo Grade 9 for demo Plan dessert.pptx
Final demo Grade 9 for demo Plan dessert.pptxAvyJaneVismanos
 
How to Make a Pirate ship Primary Education.pptx
How to Make a Pirate ship Primary Education.pptxHow to Make a Pirate ship Primary Education.pptx
How to Make a Pirate ship Primary Education.pptxmanuelaromero2013
 
SOCIAL AND HISTORICAL CONTEXT - LFTVD.pptx
SOCIAL AND HISTORICAL CONTEXT - LFTVD.pptxSOCIAL AND HISTORICAL CONTEXT - LFTVD.pptx
SOCIAL AND HISTORICAL CONTEXT - LFTVD.pptxiammrhaywood
 
A Critique of the Proposed National Education Policy Reform
A Critique of the Proposed National Education Policy ReformA Critique of the Proposed National Education Policy Reform
A Critique of the Proposed National Education Policy ReformChameera Dedduwage
 
Employee wellbeing at the workplace.pptx
Employee wellbeing at the workplace.pptxEmployee wellbeing at the workplace.pptx
Employee wellbeing at the workplace.pptxNirmalaLoungPoorunde1
 
Enzyme, Pharmaceutical Aids, Miscellaneous Last Part of Chapter no 5th.pdf
Enzyme, Pharmaceutical Aids, Miscellaneous Last Part of Chapter no 5th.pdfEnzyme, Pharmaceutical Aids, Miscellaneous Last Part of Chapter no 5th.pdf
Enzyme, Pharmaceutical Aids, Miscellaneous Last Part of Chapter no 5th.pdfSumit Tiwari
 
Painted Grey Ware.pptx, PGW Culture of India
Painted Grey Ware.pptx, PGW Culture of IndiaPainted Grey Ware.pptx, PGW Culture of India
Painted Grey Ware.pptx, PGW Culture of IndiaVirag Sontakke
 
History Class XII Ch. 3 Kinship, Caste and Class (1).pptx
History Class XII Ch. 3 Kinship, Caste and Class (1).pptxHistory Class XII Ch. 3 Kinship, Caste and Class (1).pptx
History Class XII Ch. 3 Kinship, Caste and Class (1).pptxsocialsciencegdgrohi
 
_Math 4-Q4 Week 5.pptx Steps in Collecting Data
_Math 4-Q4 Week 5.pptx Steps in Collecting Data_Math 4-Q4 Week 5.pptx Steps in Collecting Data
_Math 4-Q4 Week 5.pptx Steps in Collecting DataJhengPantaleon
 
Crayon Activity Handout For the Crayon A
Crayon Activity Handout For the Crayon ACrayon Activity Handout For the Crayon A
Crayon Activity Handout For the Crayon AUnboundStockton
 
Biting mechanism of poisonous snakes.pdf
Biting mechanism of poisonous snakes.pdfBiting mechanism of poisonous snakes.pdf
Biting mechanism of poisonous snakes.pdfadityarao40181
 
Class 11 Legal Studies Ch-1 Concept of State .pdf
Class 11 Legal Studies Ch-1 Concept of State .pdfClass 11 Legal Studies Ch-1 Concept of State .pdf
Class 11 Legal Studies Ch-1 Concept of State .pdfakmcokerachita
 
ENGLISH5 QUARTER4 MODULE1 WEEK1-3 How Visual and Multimedia Elements.pptx
ENGLISH5 QUARTER4 MODULE1 WEEK1-3 How Visual and Multimedia Elements.pptxENGLISH5 QUARTER4 MODULE1 WEEK1-3 How Visual and Multimedia Elements.pptx
ENGLISH5 QUARTER4 MODULE1 WEEK1-3 How Visual and Multimedia Elements.pptxAnaBeatriceAblay2
 

Recently uploaded (20)

Science 7 - LAND and SEA BREEZE and its Characteristics
Science 7 - LAND and SEA BREEZE and its CharacteristicsScience 7 - LAND and SEA BREEZE and its Characteristics
Science 7 - LAND and SEA BREEZE and its Characteristics
 
Blooming Together_ Growing a Community Garden Worksheet.docx
Blooming Together_ Growing a Community Garden Worksheet.docxBlooming Together_ Growing a Community Garden Worksheet.docx
Blooming Together_ Growing a Community Garden Worksheet.docx
 
9953330565 Low Rate Call Girls In Rohini Delhi NCR
9953330565 Low Rate Call Girls In Rohini  Delhi NCR9953330565 Low Rate Call Girls In Rohini  Delhi NCR
9953330565 Low Rate Call Girls In Rohini Delhi NCR
 
TataKelola dan KamSiber Kecerdasan Buatan v022.pdf
TataKelola dan KamSiber Kecerdasan Buatan v022.pdfTataKelola dan KamSiber Kecerdasan Buatan v022.pdf
TataKelola dan KamSiber Kecerdasan Buatan v022.pdf
 
Final demo Grade 9 for demo Plan dessert.pptx
Final demo Grade 9 for demo Plan dessert.pptxFinal demo Grade 9 for demo Plan dessert.pptx
Final demo Grade 9 for demo Plan dessert.pptx
 
How to Make a Pirate ship Primary Education.pptx
How to Make a Pirate ship Primary Education.pptxHow to Make a Pirate ship Primary Education.pptx
How to Make a Pirate ship Primary Education.pptx
 
SOCIAL AND HISTORICAL CONTEXT - LFTVD.pptx
SOCIAL AND HISTORICAL CONTEXT - LFTVD.pptxSOCIAL AND HISTORICAL CONTEXT - LFTVD.pptx
SOCIAL AND HISTORICAL CONTEXT - LFTVD.pptx
 
A Critique of the Proposed National Education Policy Reform
A Critique of the Proposed National Education Policy ReformA Critique of the Proposed National Education Policy Reform
A Critique of the Proposed National Education Policy Reform
 
Employee wellbeing at the workplace.pptx
Employee wellbeing at the workplace.pptxEmployee wellbeing at the workplace.pptx
Employee wellbeing at the workplace.pptx
 
Enzyme, Pharmaceutical Aids, Miscellaneous Last Part of Chapter no 5th.pdf
Enzyme, Pharmaceutical Aids, Miscellaneous Last Part of Chapter no 5th.pdfEnzyme, Pharmaceutical Aids, Miscellaneous Last Part of Chapter no 5th.pdf
Enzyme, Pharmaceutical Aids, Miscellaneous Last Part of Chapter no 5th.pdf
 
Painted Grey Ware.pptx, PGW Culture of India
Painted Grey Ware.pptx, PGW Culture of IndiaPainted Grey Ware.pptx, PGW Culture of India
Painted Grey Ware.pptx, PGW Culture of India
 
History Class XII Ch. 3 Kinship, Caste and Class (1).pptx
History Class XII Ch. 3 Kinship, Caste and Class (1).pptxHistory Class XII Ch. 3 Kinship, Caste and Class (1).pptx
History Class XII Ch. 3 Kinship, Caste and Class (1).pptx
 
Staff of Color (SOC) Retention Efforts DDSD
Staff of Color (SOC) Retention Efforts DDSDStaff of Color (SOC) Retention Efforts DDSD
Staff of Color (SOC) Retention Efforts DDSD
 
Model Call Girl in Tilak Nagar Delhi reach out to us at 🔝9953056974🔝
Model Call Girl in Tilak Nagar Delhi reach out to us at 🔝9953056974🔝Model Call Girl in Tilak Nagar Delhi reach out to us at 🔝9953056974🔝
Model Call Girl in Tilak Nagar Delhi reach out to us at 🔝9953056974🔝
 
Model Call Girl in Bikash Puri Delhi reach out to us at 🔝9953056974🔝
Model Call Girl in Bikash Puri  Delhi reach out to us at 🔝9953056974🔝Model Call Girl in Bikash Puri  Delhi reach out to us at 🔝9953056974🔝
Model Call Girl in Bikash Puri Delhi reach out to us at 🔝9953056974🔝
 
_Math 4-Q4 Week 5.pptx Steps in Collecting Data
_Math 4-Q4 Week 5.pptx Steps in Collecting Data_Math 4-Q4 Week 5.pptx Steps in Collecting Data
_Math 4-Q4 Week 5.pptx Steps in Collecting Data
 
Crayon Activity Handout For the Crayon A
Crayon Activity Handout For the Crayon ACrayon Activity Handout For the Crayon A
Crayon Activity Handout For the Crayon A
 
Biting mechanism of poisonous snakes.pdf
Biting mechanism of poisonous snakes.pdfBiting mechanism of poisonous snakes.pdf
Biting mechanism of poisonous snakes.pdf
 
Class 11 Legal Studies Ch-1 Concept of State .pdf
Class 11 Legal Studies Ch-1 Concept of State .pdfClass 11 Legal Studies Ch-1 Concept of State .pdf
Class 11 Legal Studies Ch-1 Concept of State .pdf
 
ENGLISH5 QUARTER4 MODULE1 WEEK1-3 How Visual and Multimedia Elements.pptx
ENGLISH5 QUARTER4 MODULE1 WEEK1-3 How Visual and Multimedia Elements.pptxENGLISH5 QUARTER4 MODULE1 WEEK1-3 How Visual and Multimedia Elements.pptx
ENGLISH5 QUARTER4 MODULE1 WEEK1-3 How Visual and Multimedia Elements.pptx
 

Visual Information writeup

  • 1. VISUAL INFORMATION Researchers across academic disciplines are well trained in using writing to develop and convey their insights, but only some learn how visuals can help them organize and communicate their ideas. Academic Writing is the formal tone and attitude of writing in which visual information is one of its element. Meaning: The use of visuals (rather than words) to communicate an idea or support an argument. Use of one or more of the various visual media with or without sound. Generally, visual information includes still photography, motion picture photography, video or audio recording, graphic arts, visual aids, models, display, visual presentation services, and the support processes. Research suggests that information displayed visually is well remembered: "retention of information three days after a meeting or other event is six times greater when information is presented by visual and oral means than when the information is presented by the spokenword alone." (U.S. Department of Labor OSHA Office of Training and Education, 1996) Although visuals do largely speak for themselves, it is usual to help the reader interpret them by briefly commenting on their main features when referring to visual information in the text, the word figure is used for everything (such as maps, charts and graphs) except tables. Figures and tables should be numbered and given a title. Titles of tables are written above, while titles of figures are written below the data. As with other data, sources must be given for all visual information. If you are writing a lengthy work, such as a dissertation, you will need to provide lists of tables and figures, showing numbers, titles and page numbers, after the contents page. EXAMPLE: Instead of textual description graphic picture is giving clear idea how the figure looks alike.
  • 2. TYPES OF VISUAL INFORMATION  Tablesandfiguresmaybe usedas evidence tosupportacademicargument.  They are mostly used in report writing.  It is important that tables and figures are used purposefully (i.e. with good reason) and referenced correctly.  Tables are used in academic text to display  Statistical data  Comparison of information  Illustrate the functions  A table arranges text visually, in columns for example, to compare information.  A pie chart arranges text within a circle to show relationships of quantity, for instance. Give the proportions  A bar graph is typically used to show changes in data over a period of time.  A map calls attention to “spatial relationships and locations.”35
  • 4. EDUCATIONAL IMPLICATION: It’s well worth learning what you can, because visuals have the unique ability to help us:  Develop ideas and understand experiences that language cannot yet describe  Gather and analyze complex and/or abstract ideas in simple, immediate ways  Communicate across language, knowledge, ideological, and other barriers  Impact decision-making, which largely happens in our pre-lingual, pre-rational brains  Visual aids are worth including in your presentations because they can help you explain information more coherently which makes presenting easier for you and learning easier for the audience.  They also help add variety to your presentation thus making it more interesting for the audience. If the audience understands what you're saying and they are more engaged, they're more likely to be persuaded by you.  On other hand, well-selected images can improve comprehension and insight when developers strategically place such graphics within a course. Unlike text, pictures have the power to enrich communication and stimulate emotional response. In order to utilize visuals in a way that will reinforce course material and facilitate learning, it is necessary to use images that:  Represent actual objects, people, or places.  Simplify complex or abstract ideas.  Bridge already learned materials with the unfamiliar. SELF RELECTION:  If you are writing a lengthy work, such as a dissertation, you will need to provide lists of tables and figures, showing numbers, titles and page numbers, after the content page that could be easily farmed by using visual information element.  Visual information make the textual content interesting.  Visual adhere the interest of readers and it gives clear picture REFERENCES: http://www.conradiator.com/resources/pdf/literacies4eigvil_ct2003.pdf https://pdfs.semanticscholar.org/8f6c/36d260763dd3dd33c53b5b1edc21a8755a28.pdf https://www.kau.edu.sa/Files/0013287/Subjects/academic-writing-handbook-international-students-3rd-ed%20(2).pdf https://www.researchgate.net/publication/286909809_Visual_Literacy_in_Educational_Practice