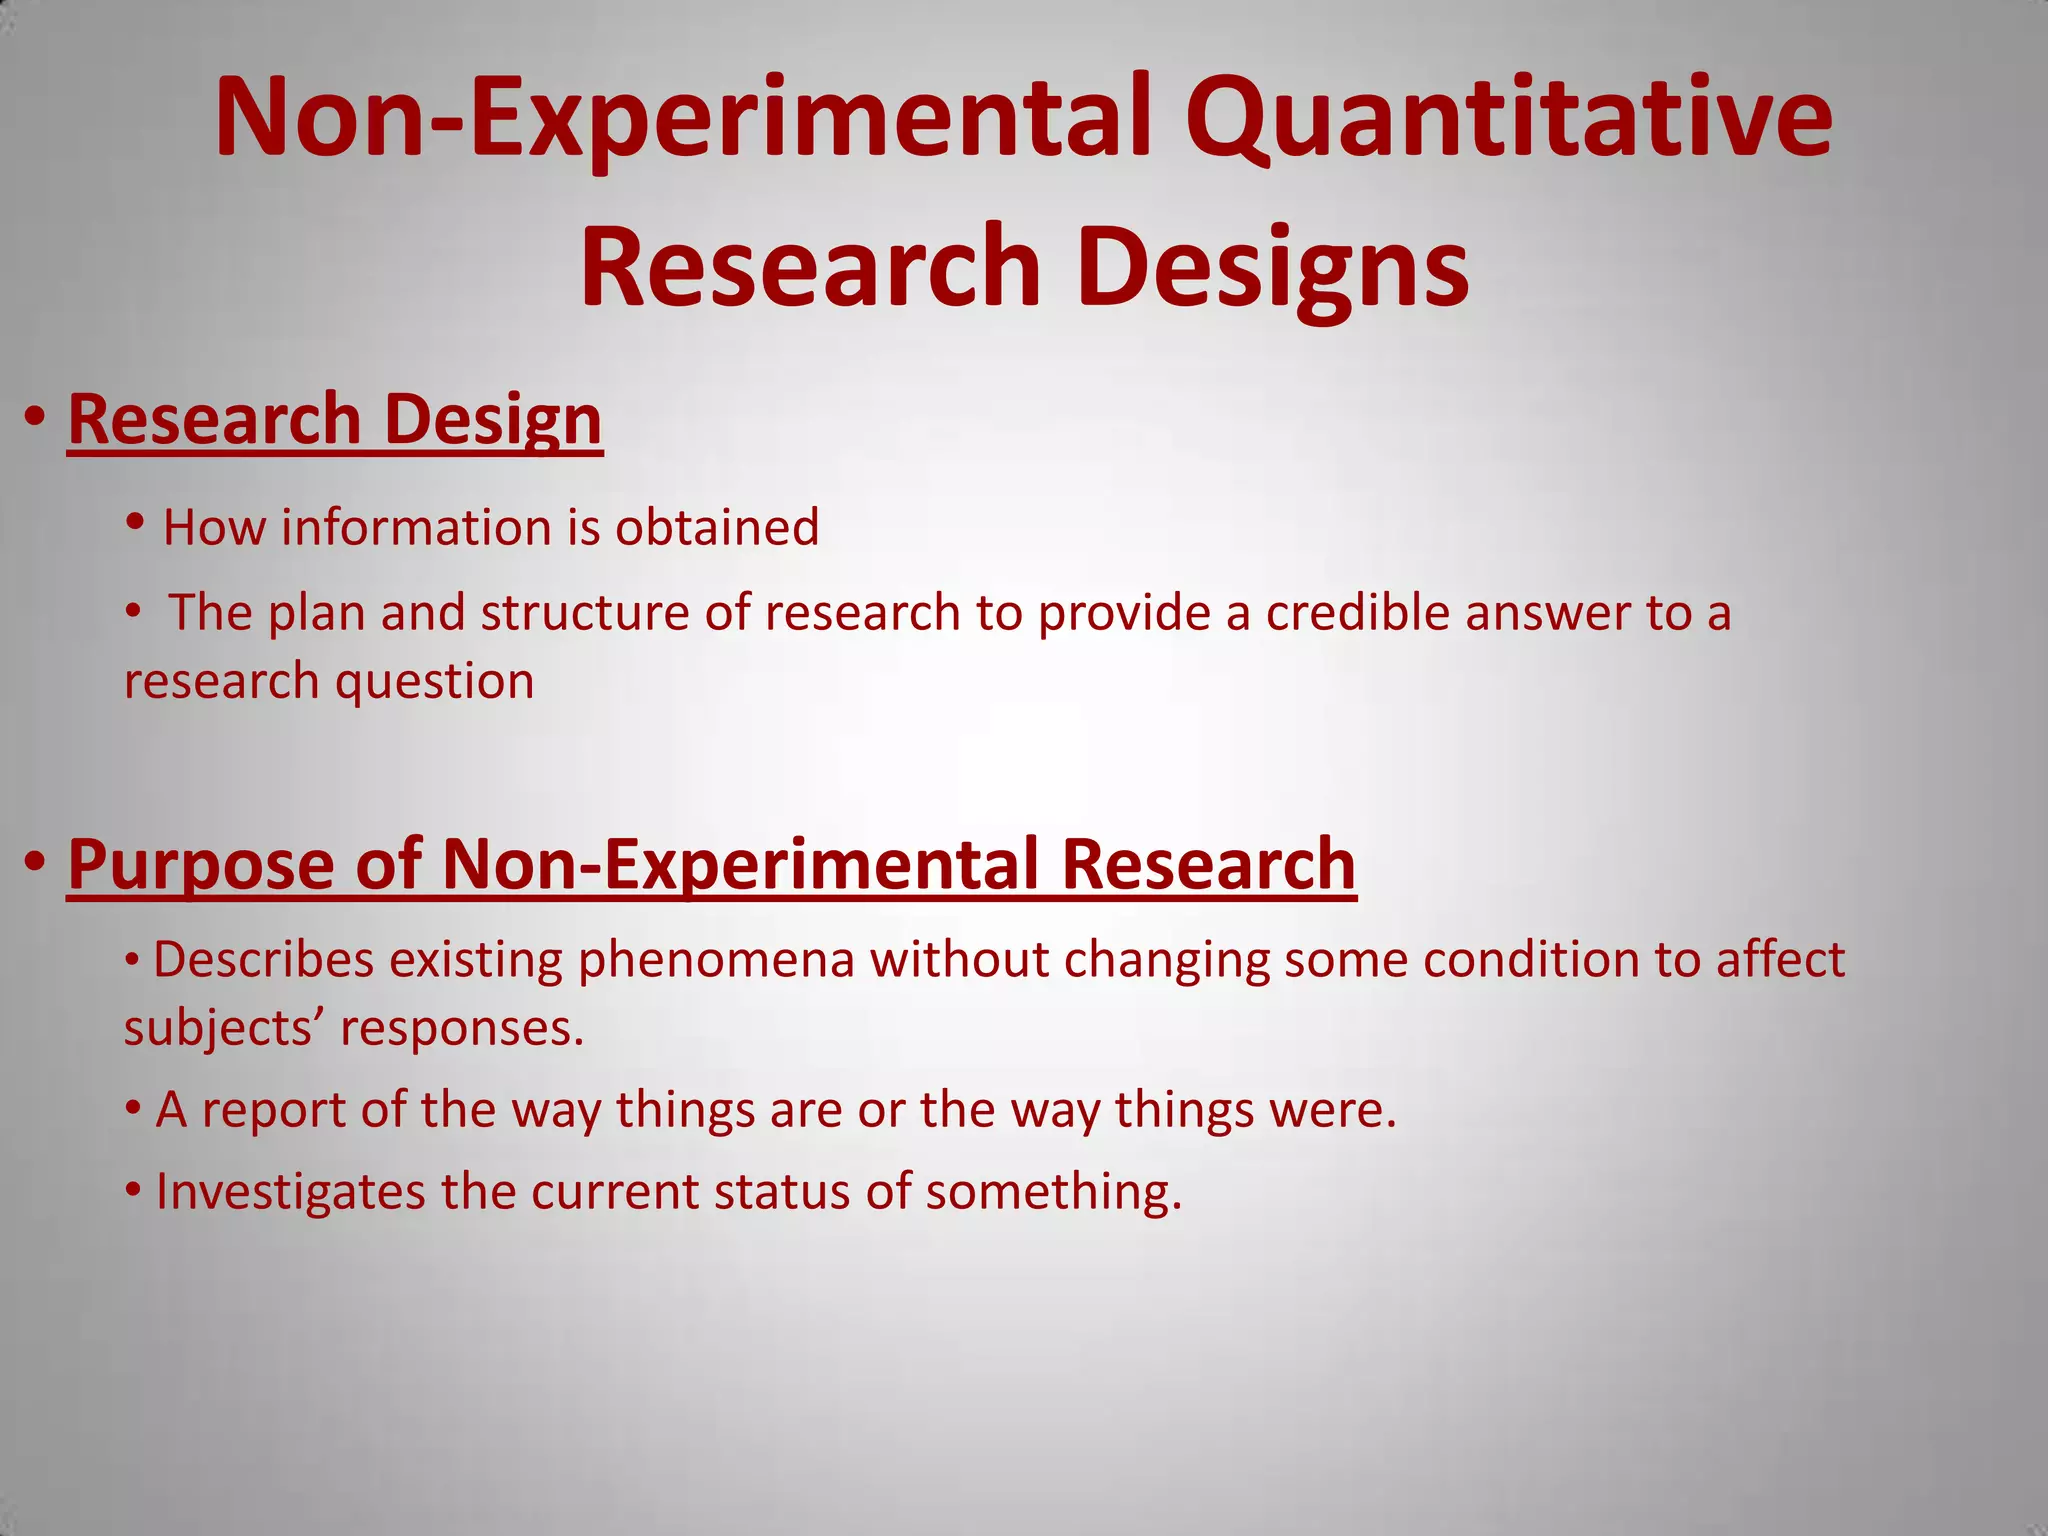
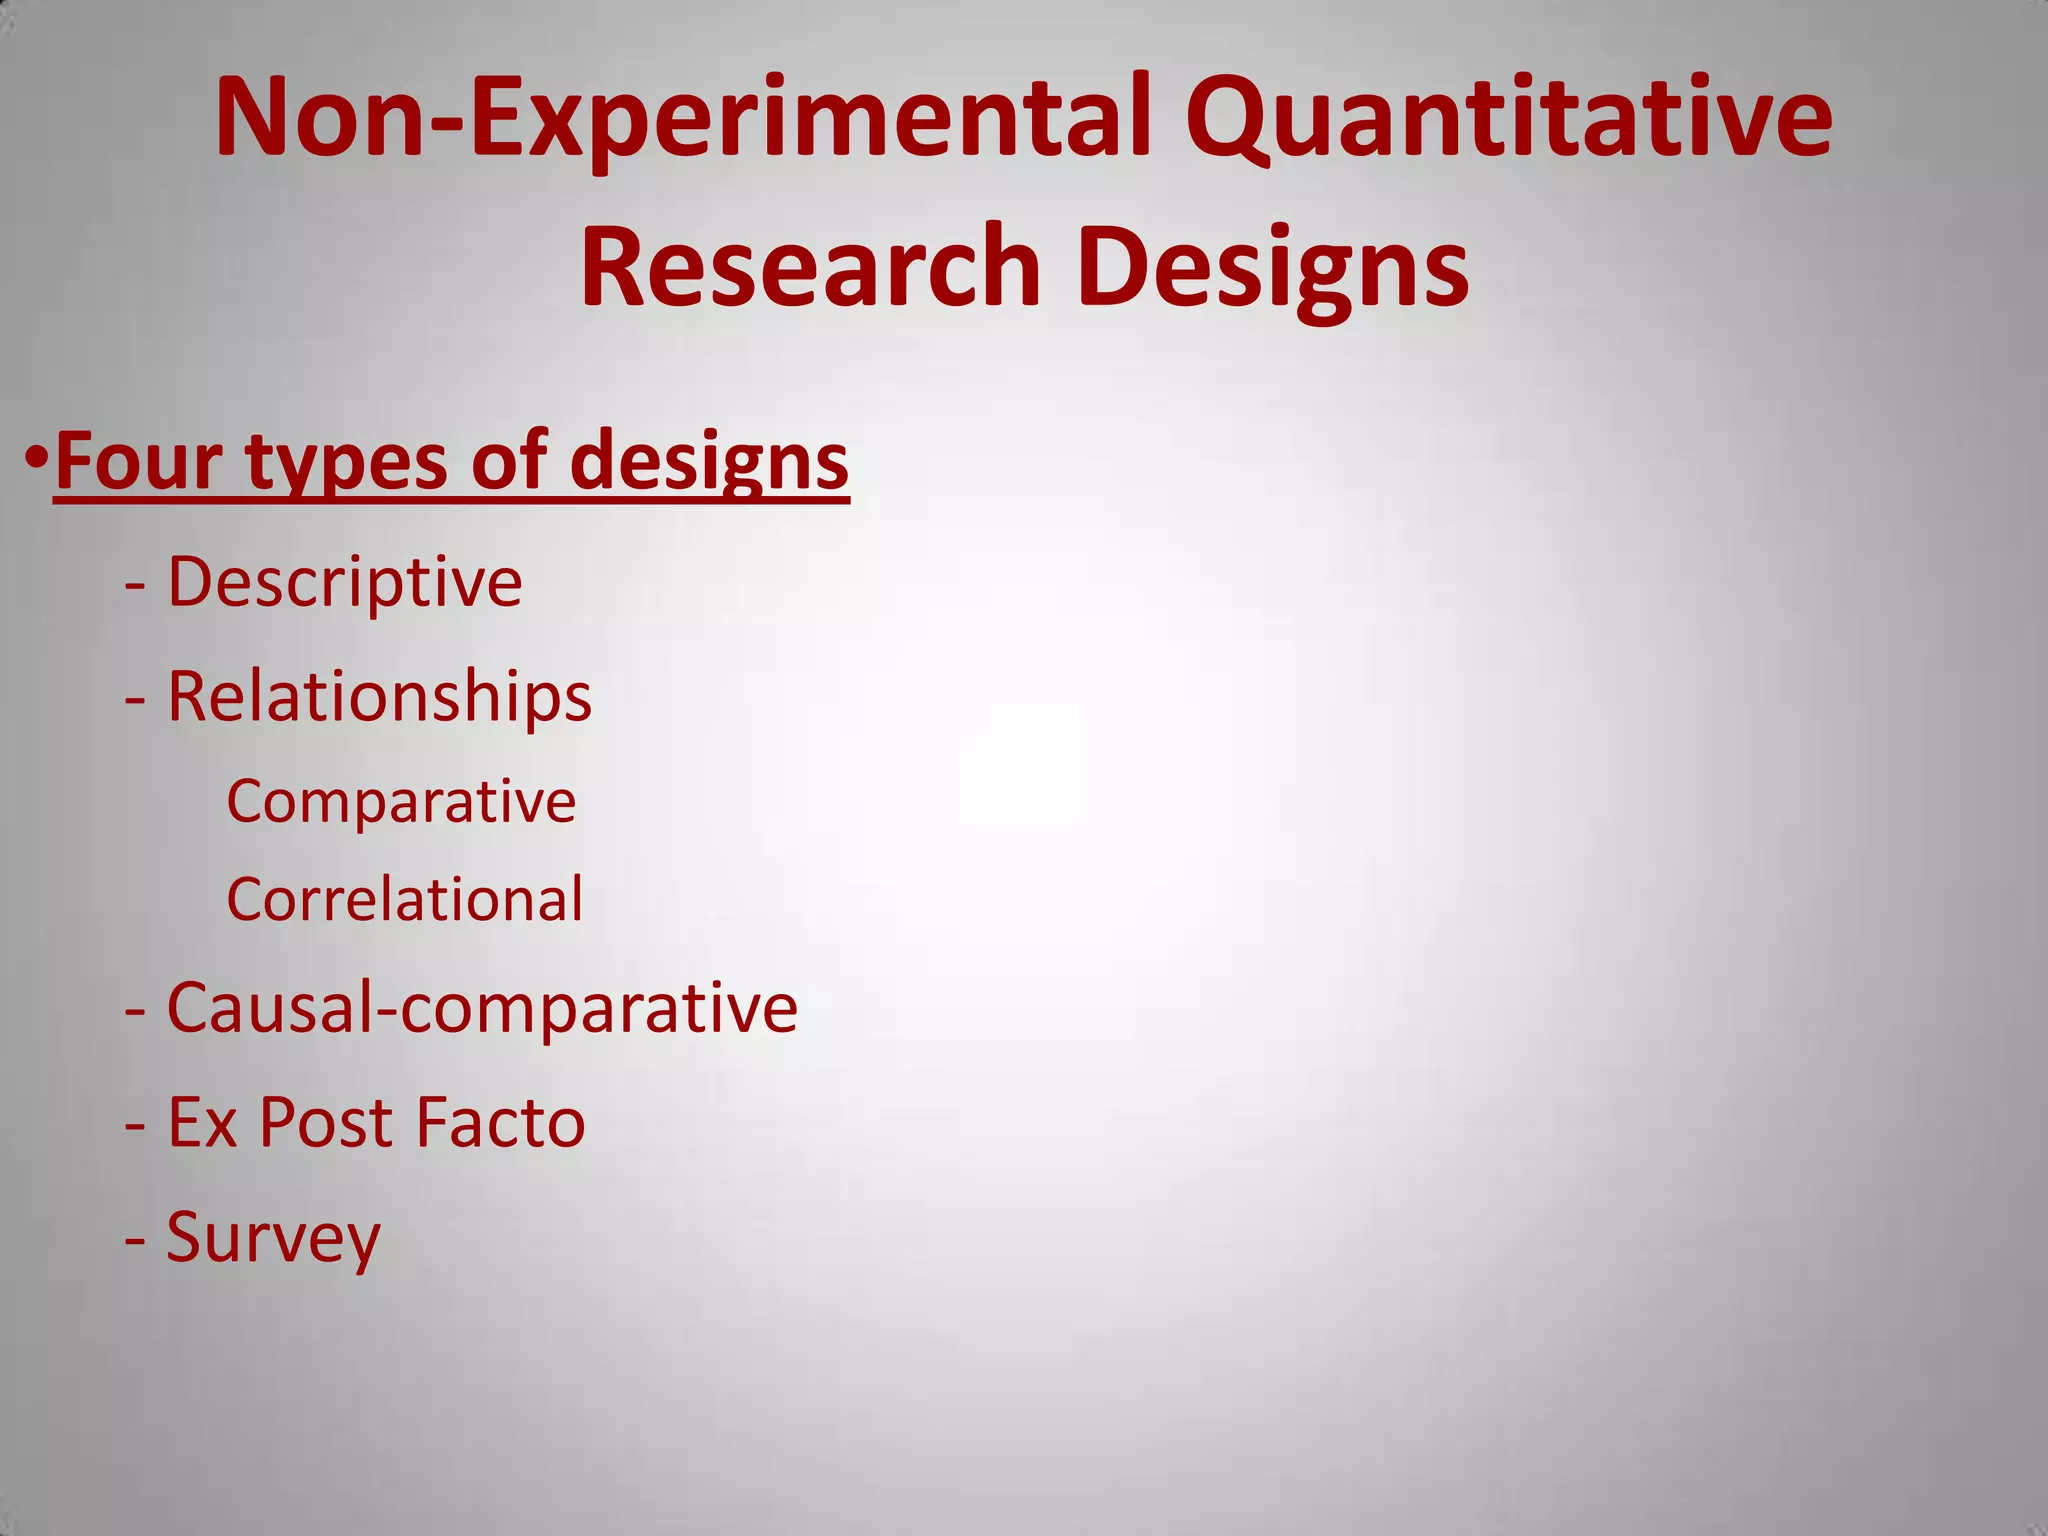
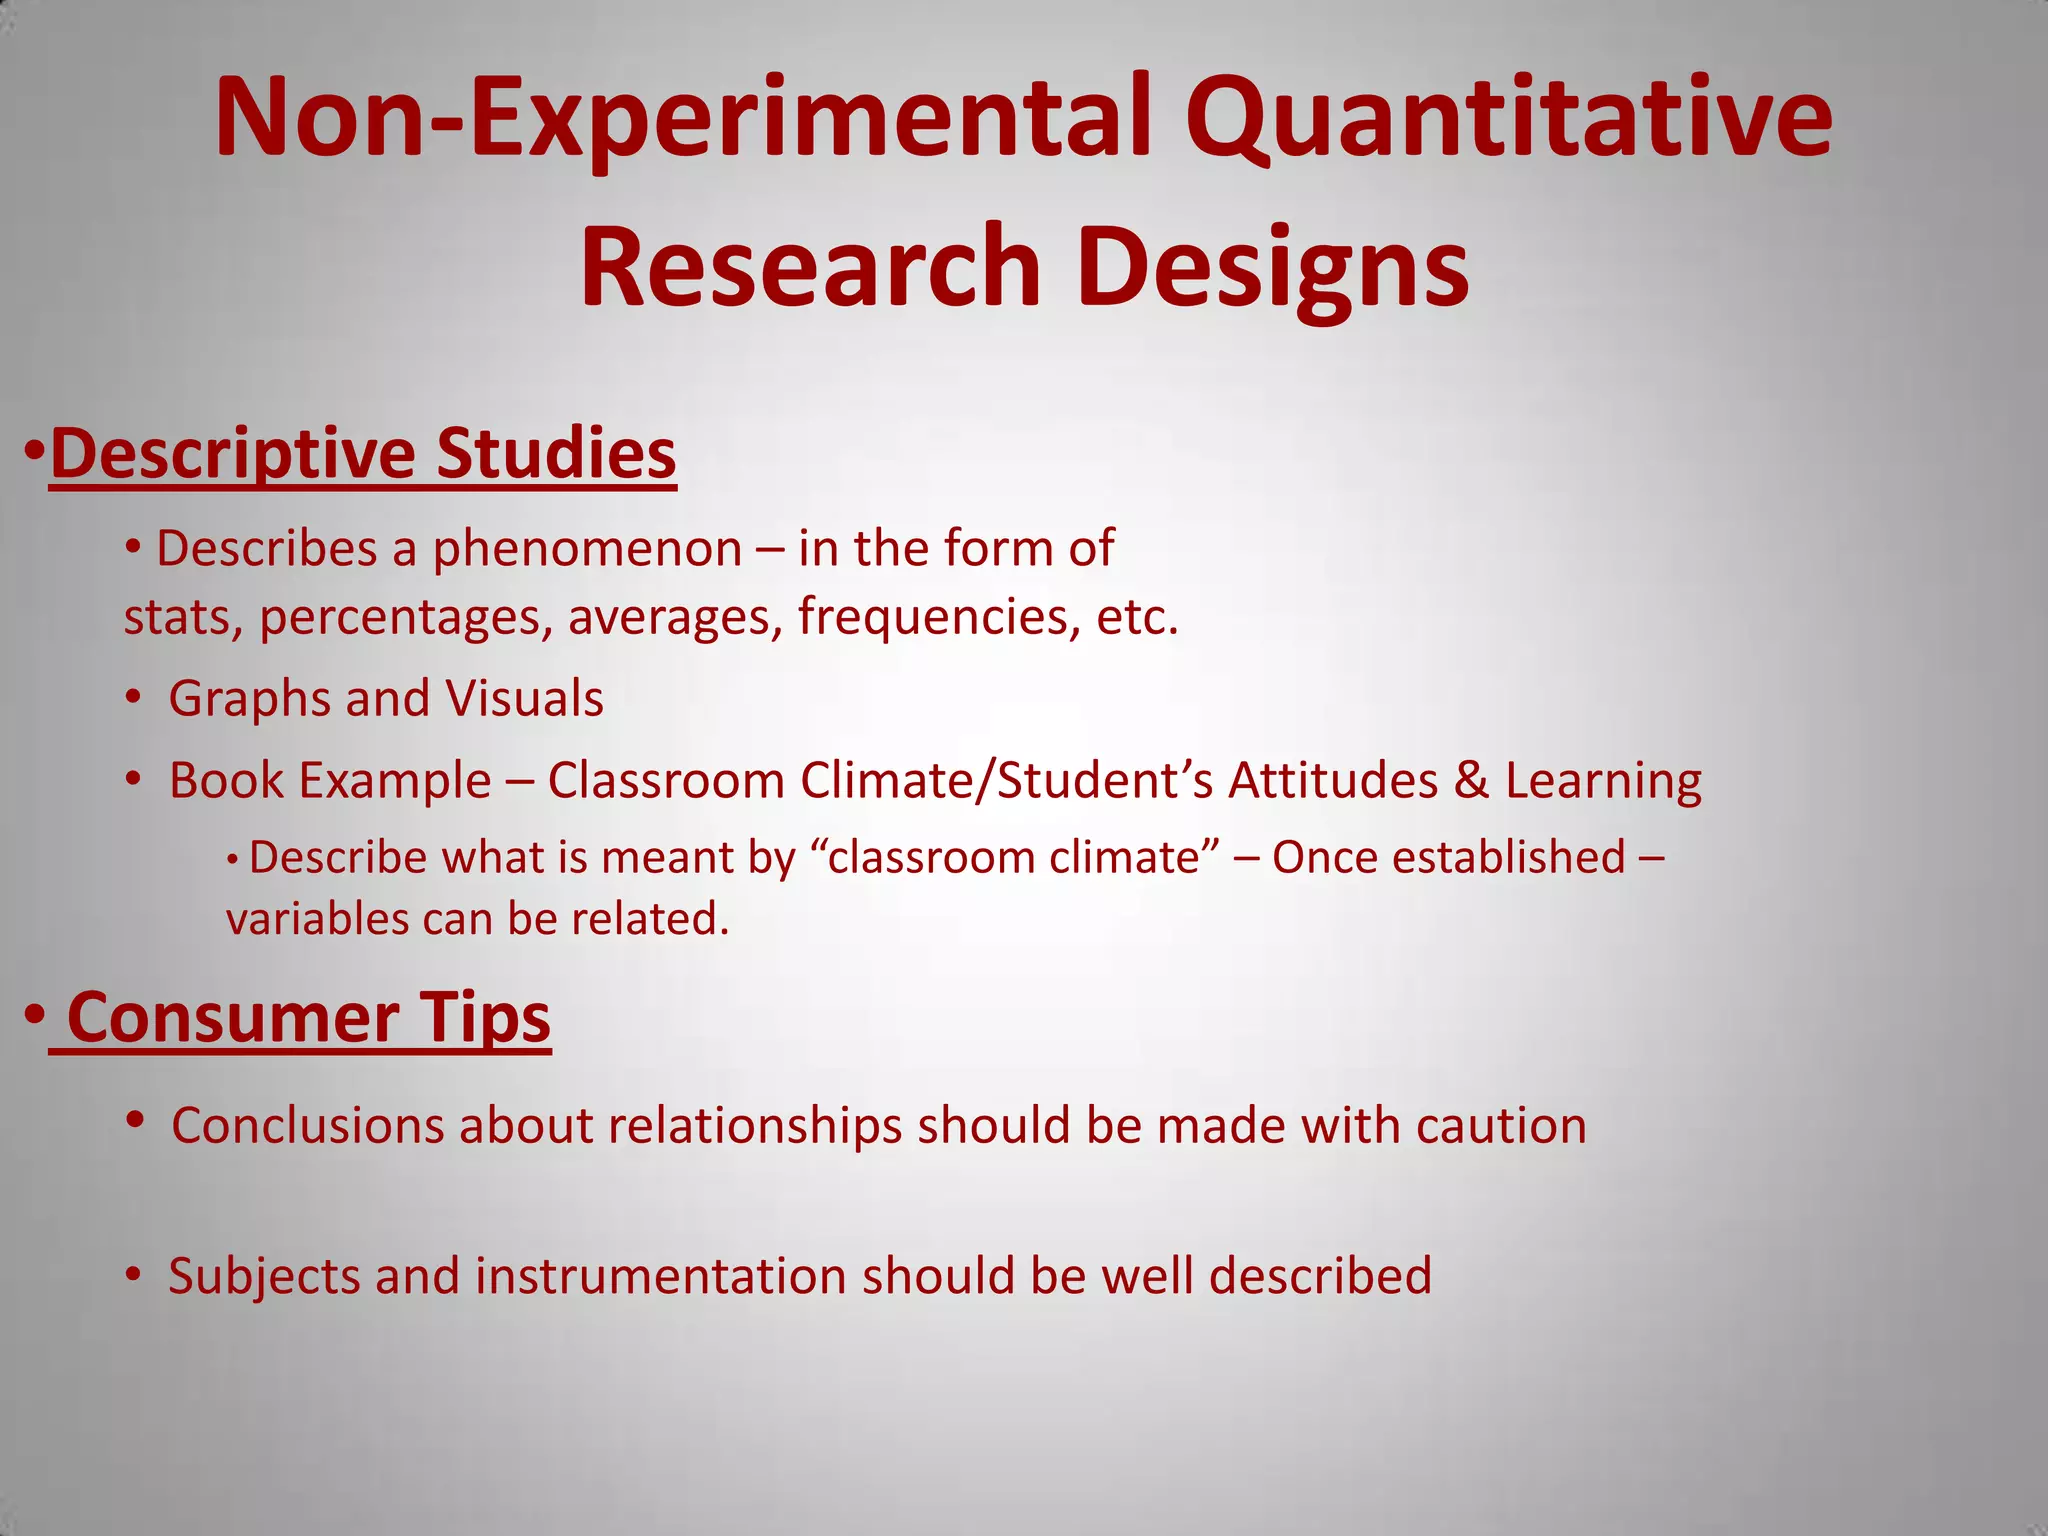
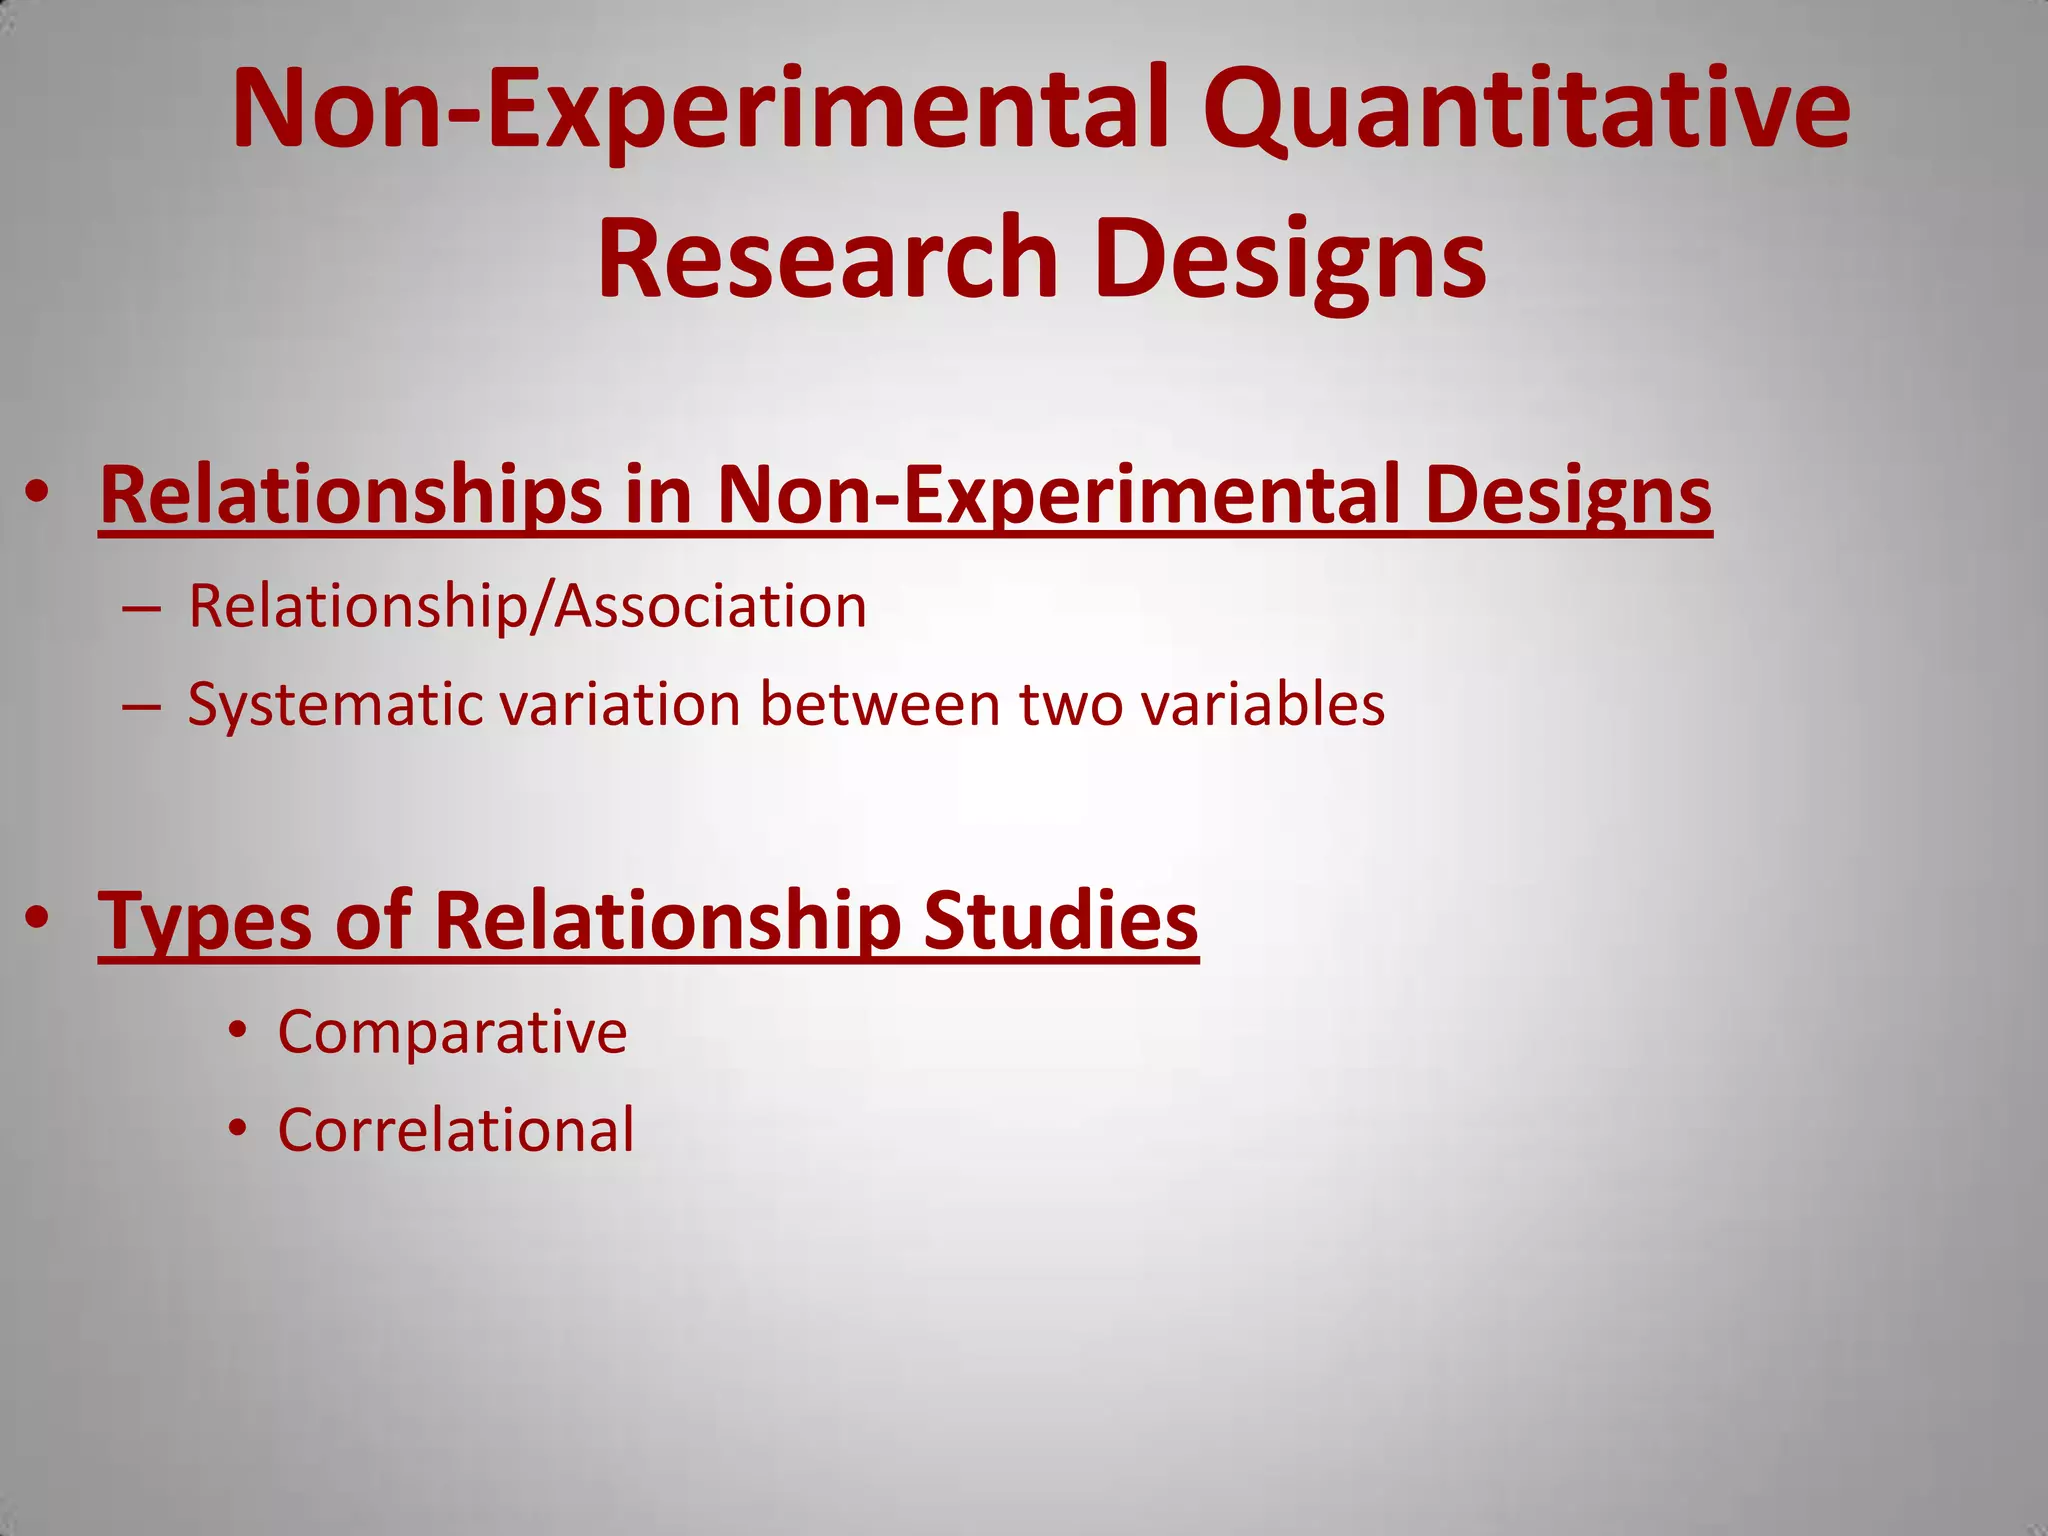
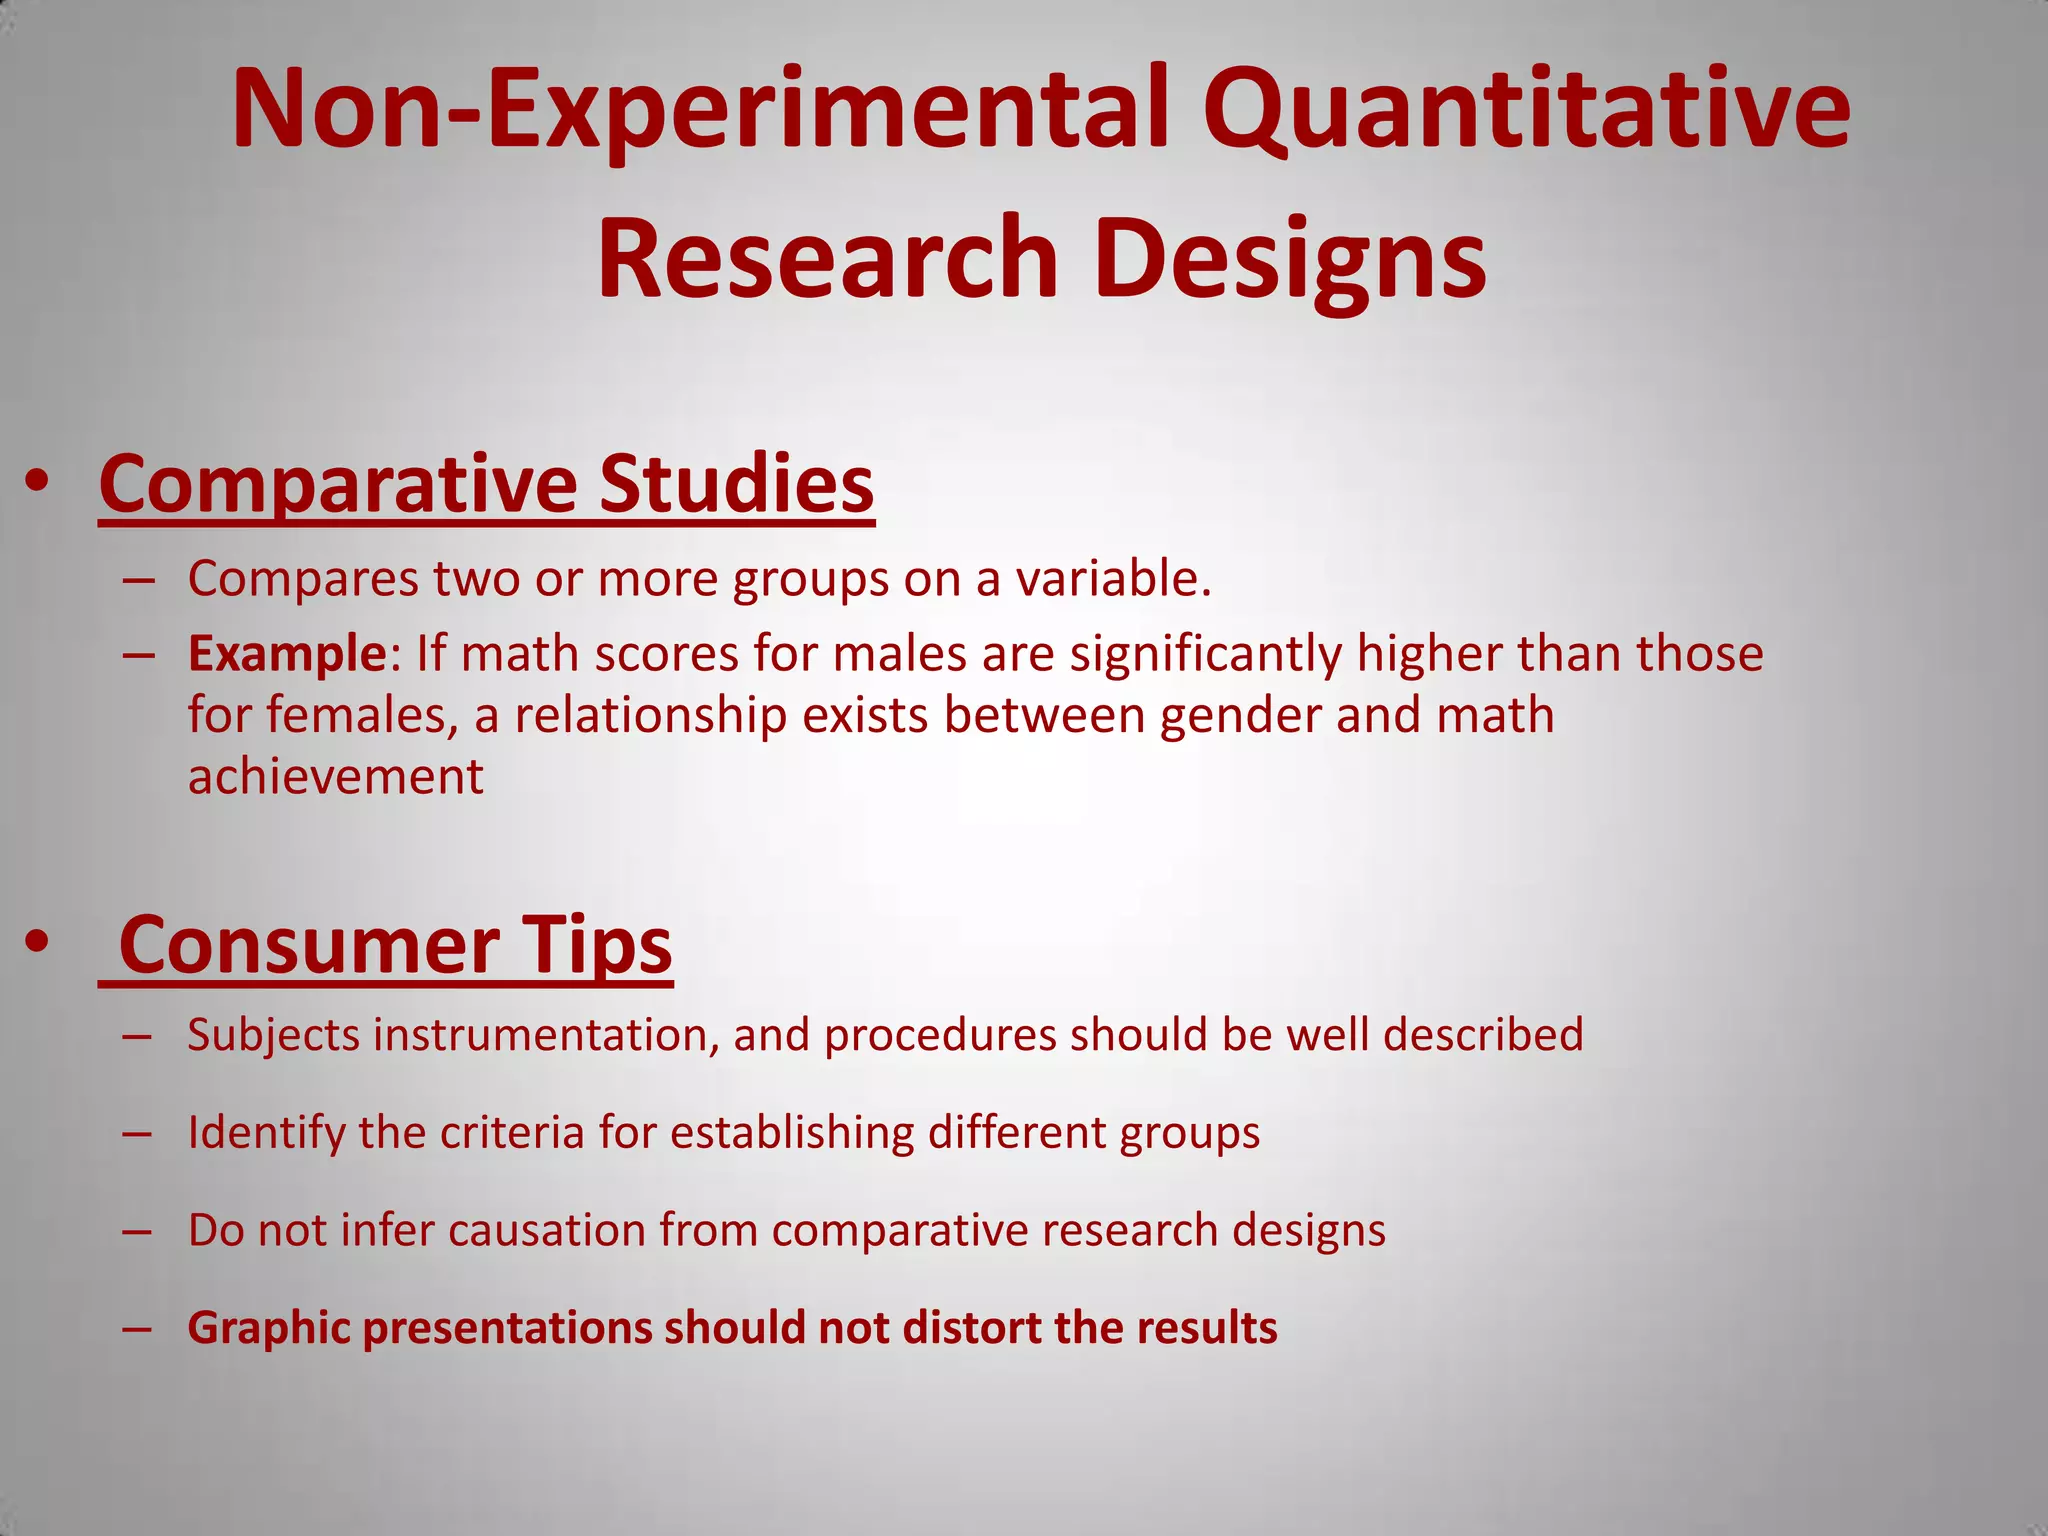
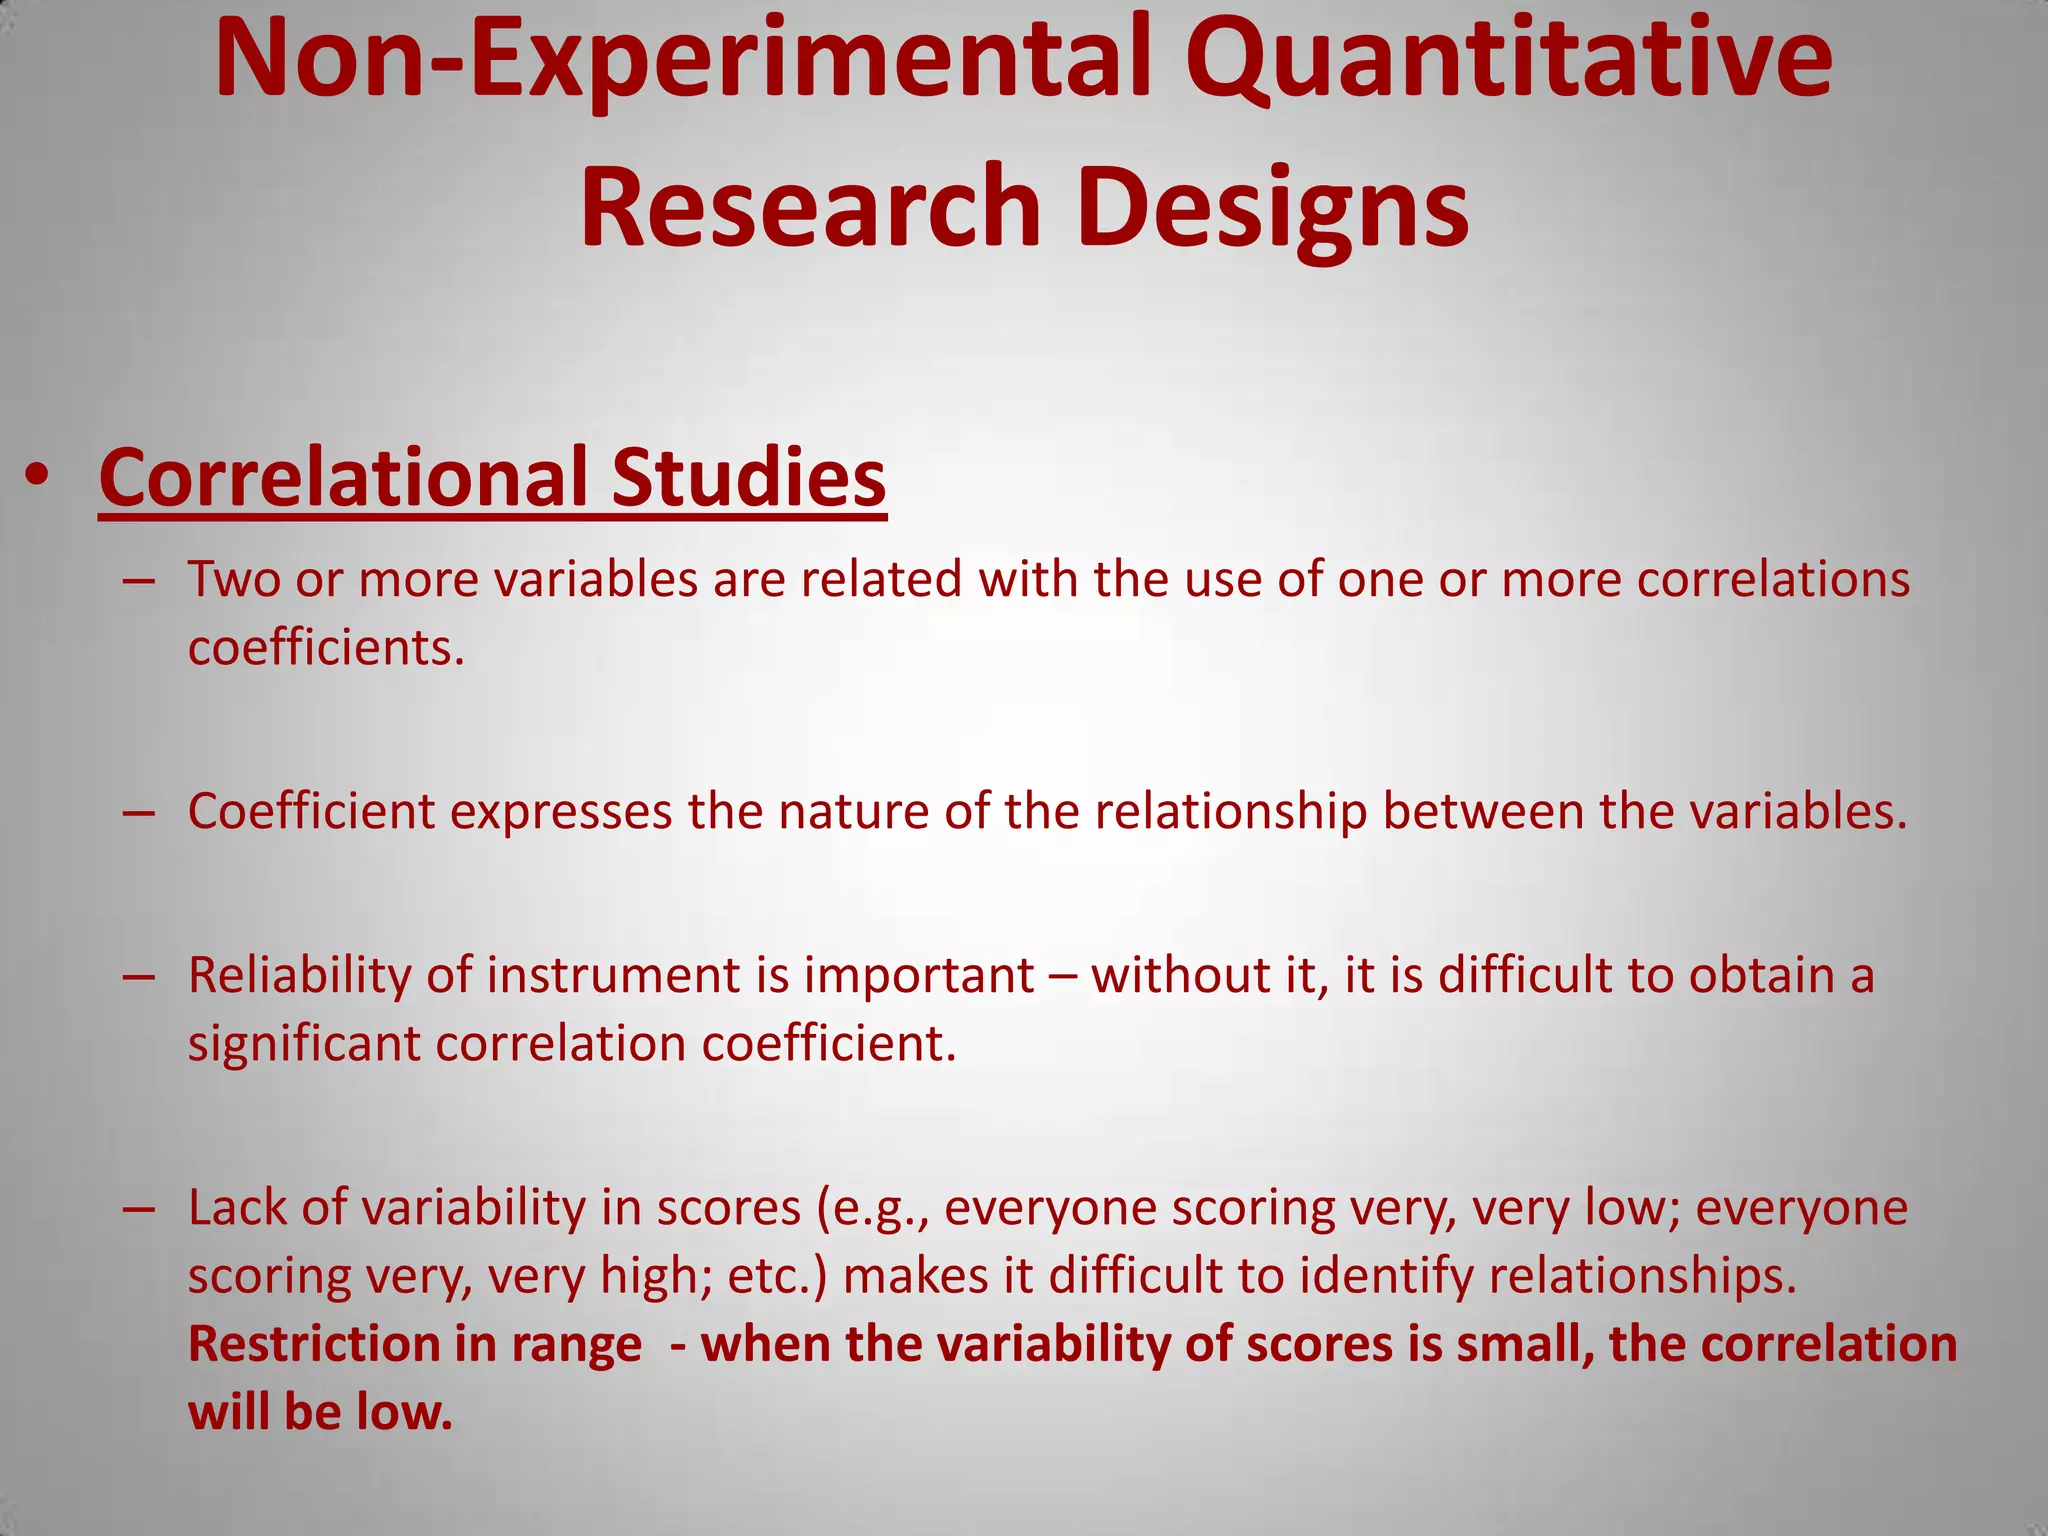
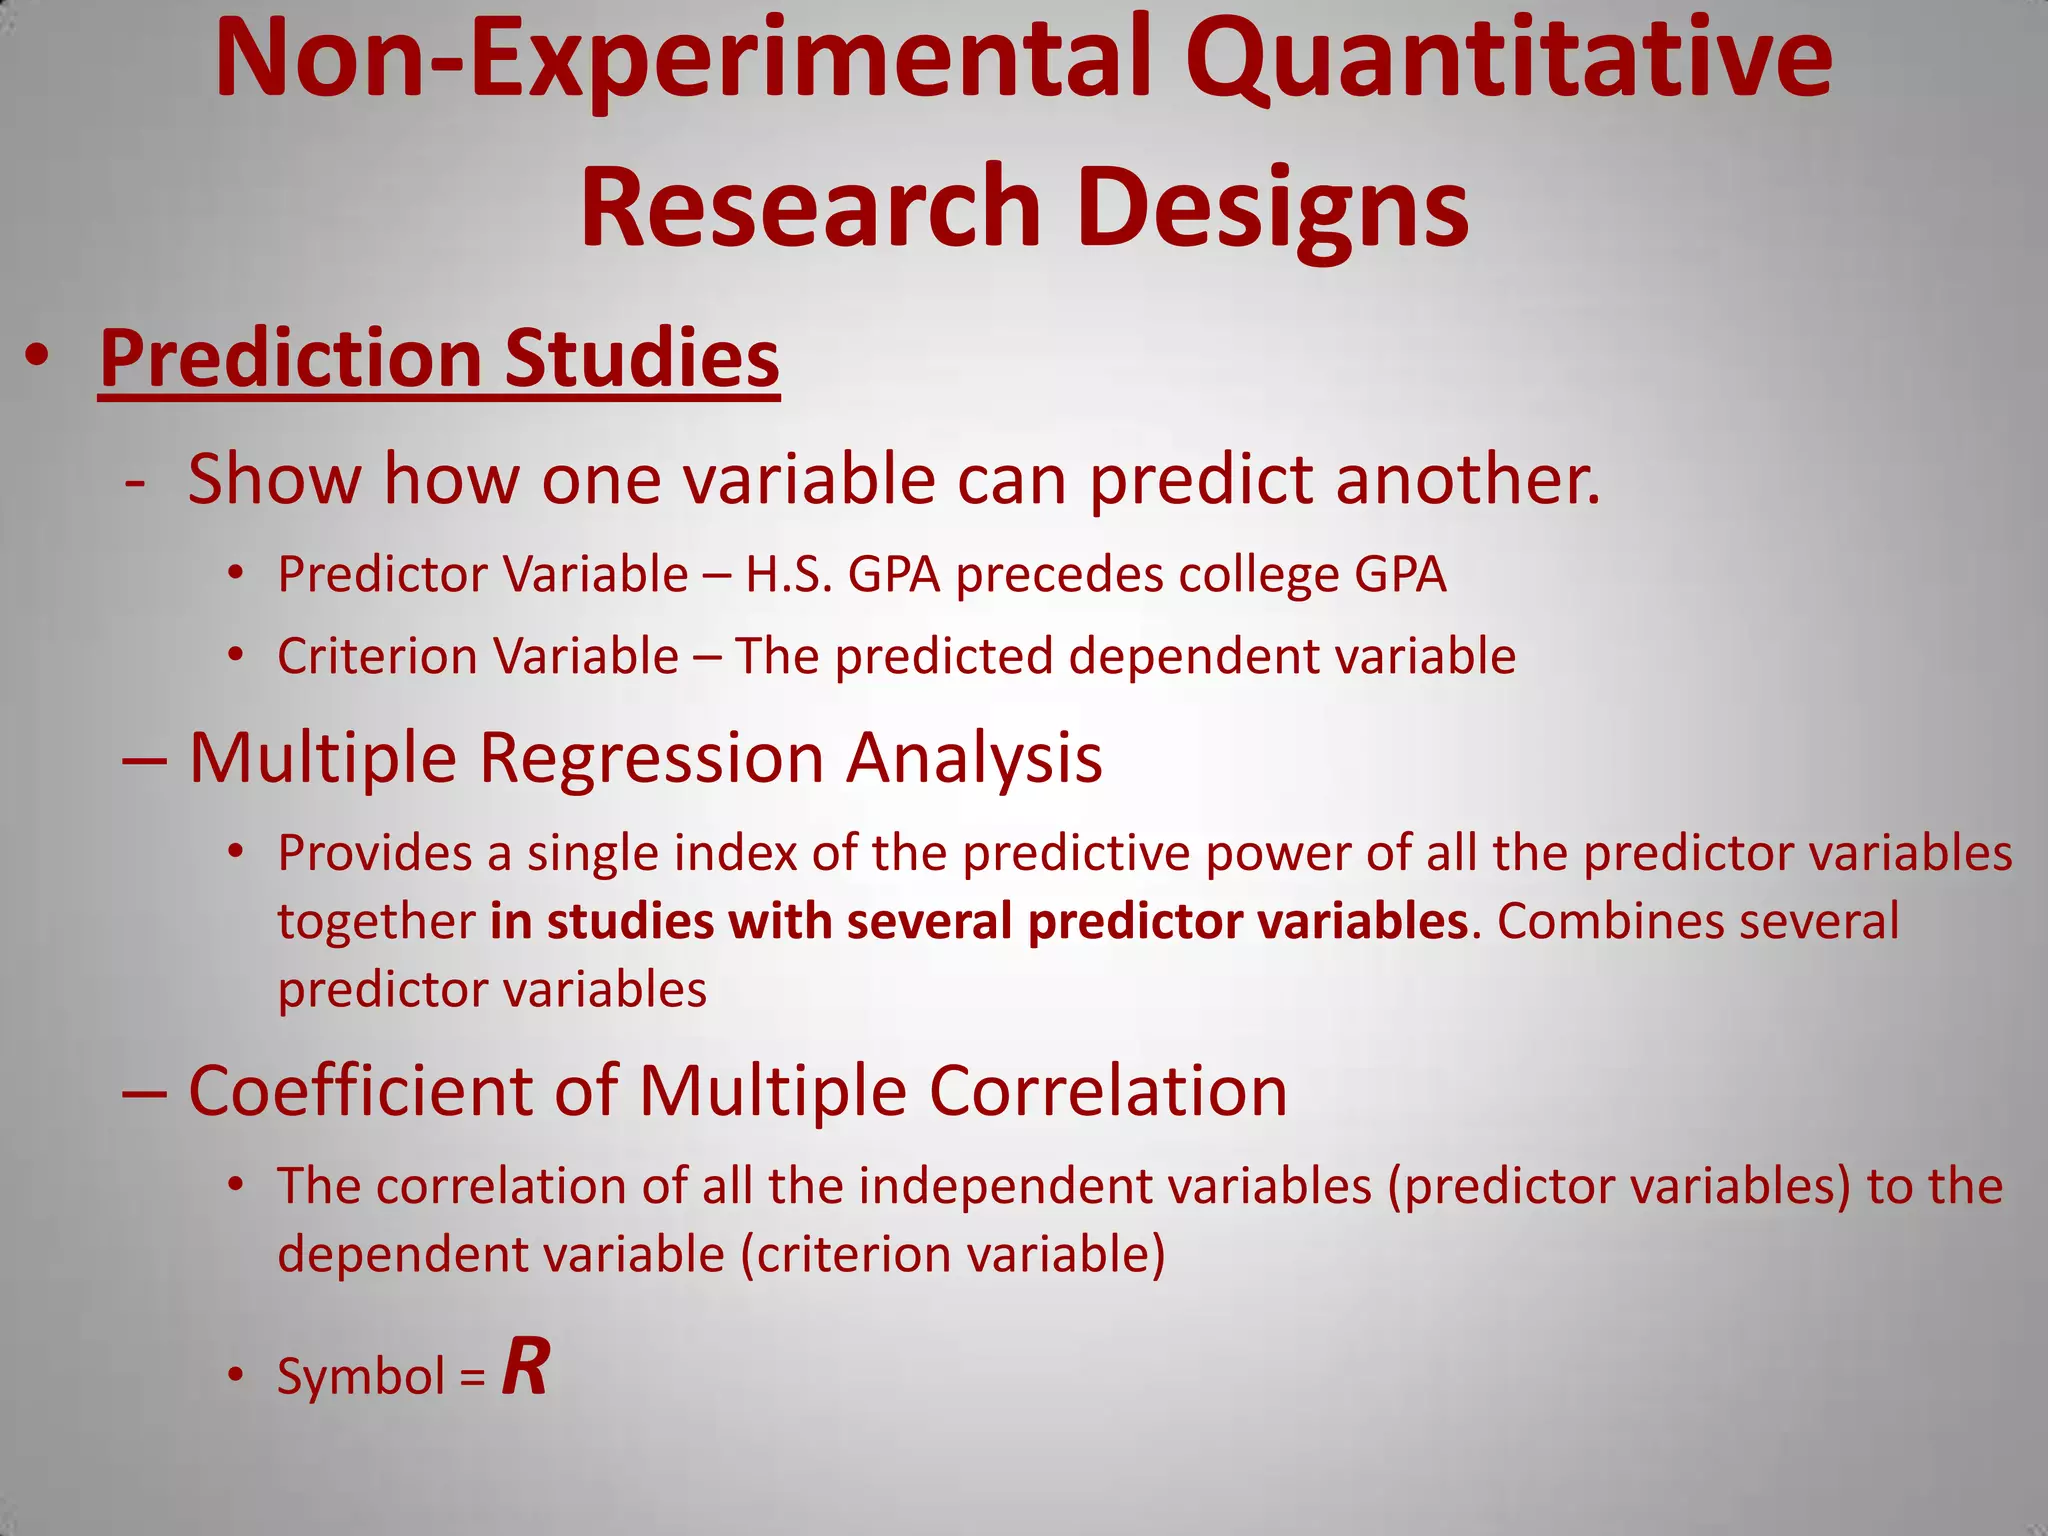
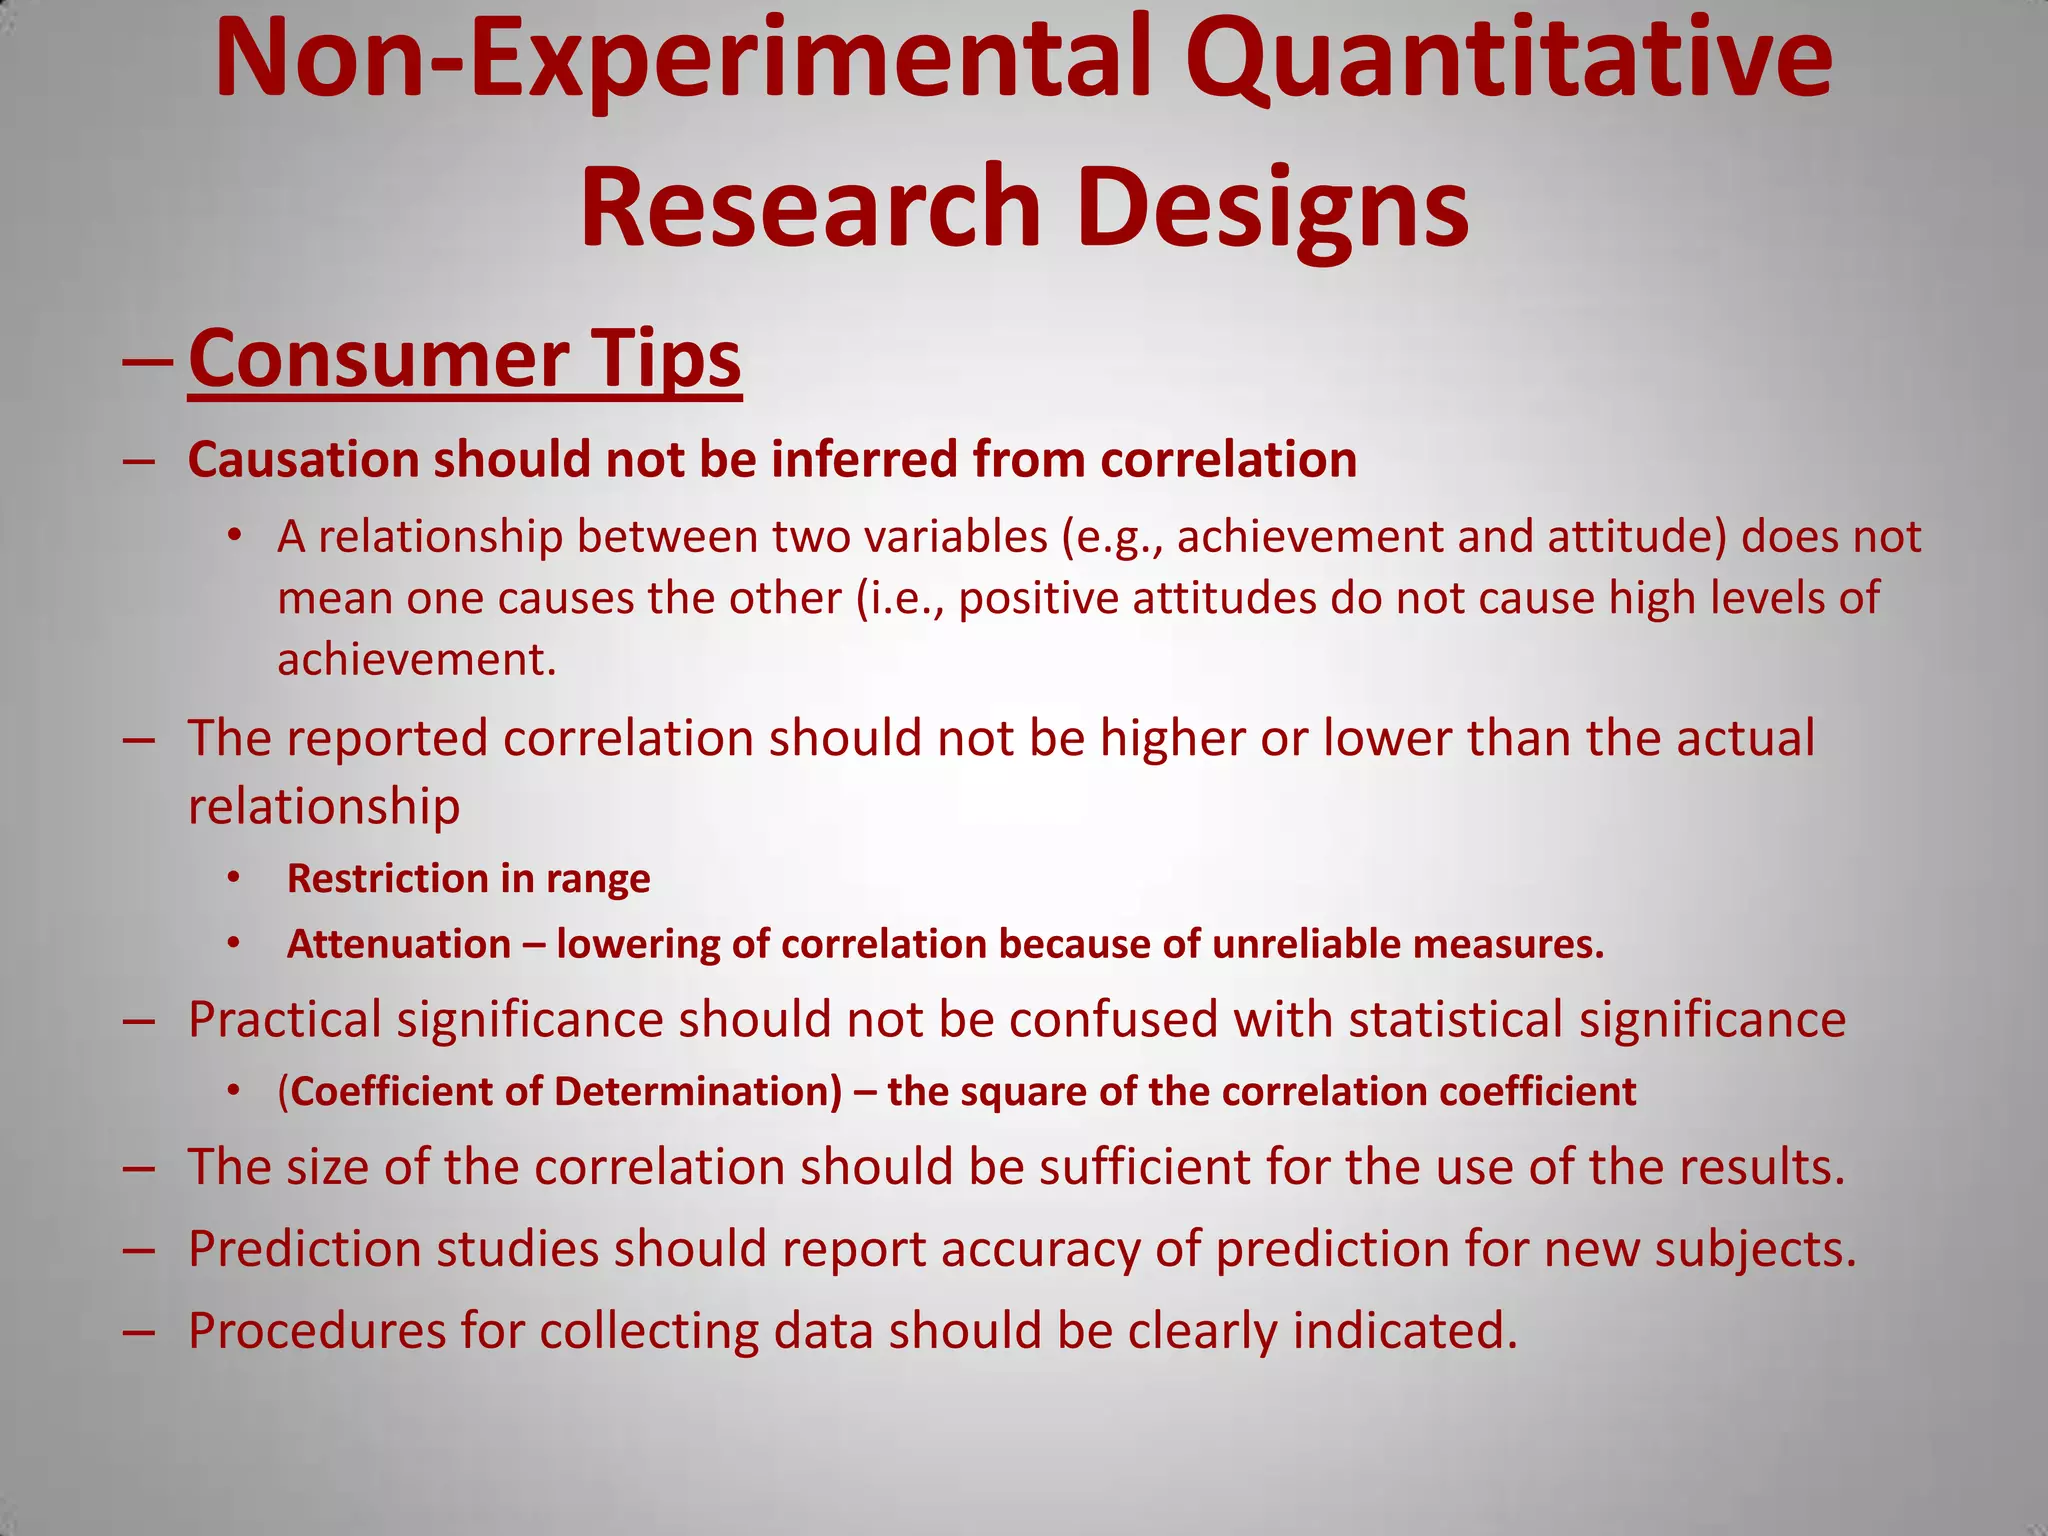
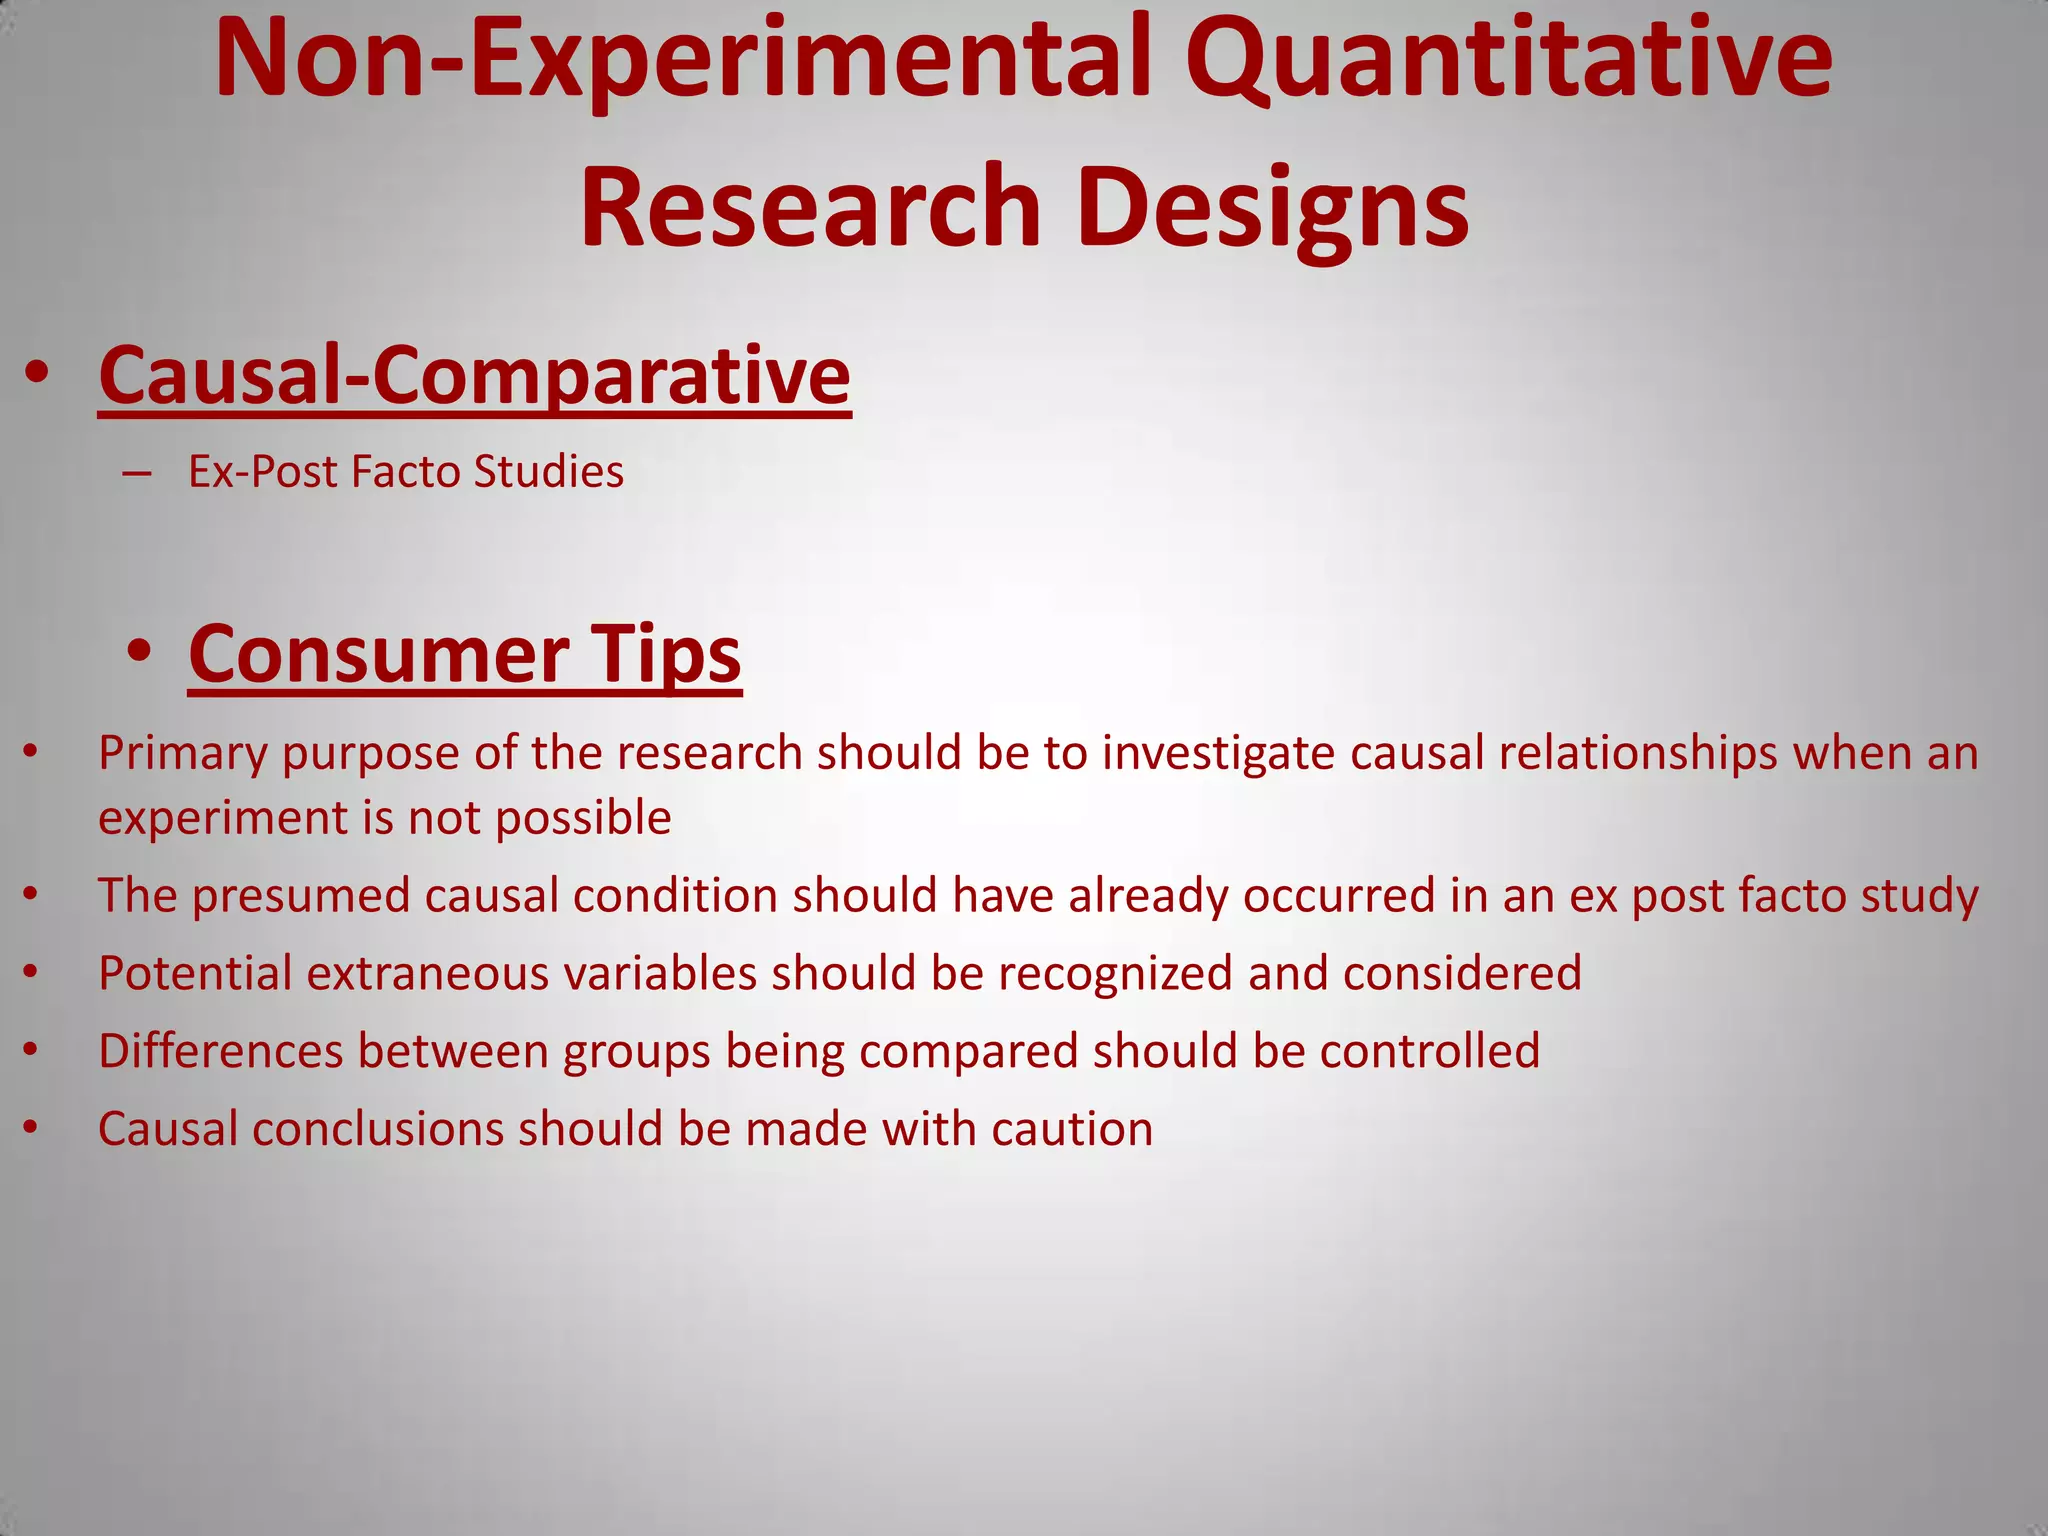
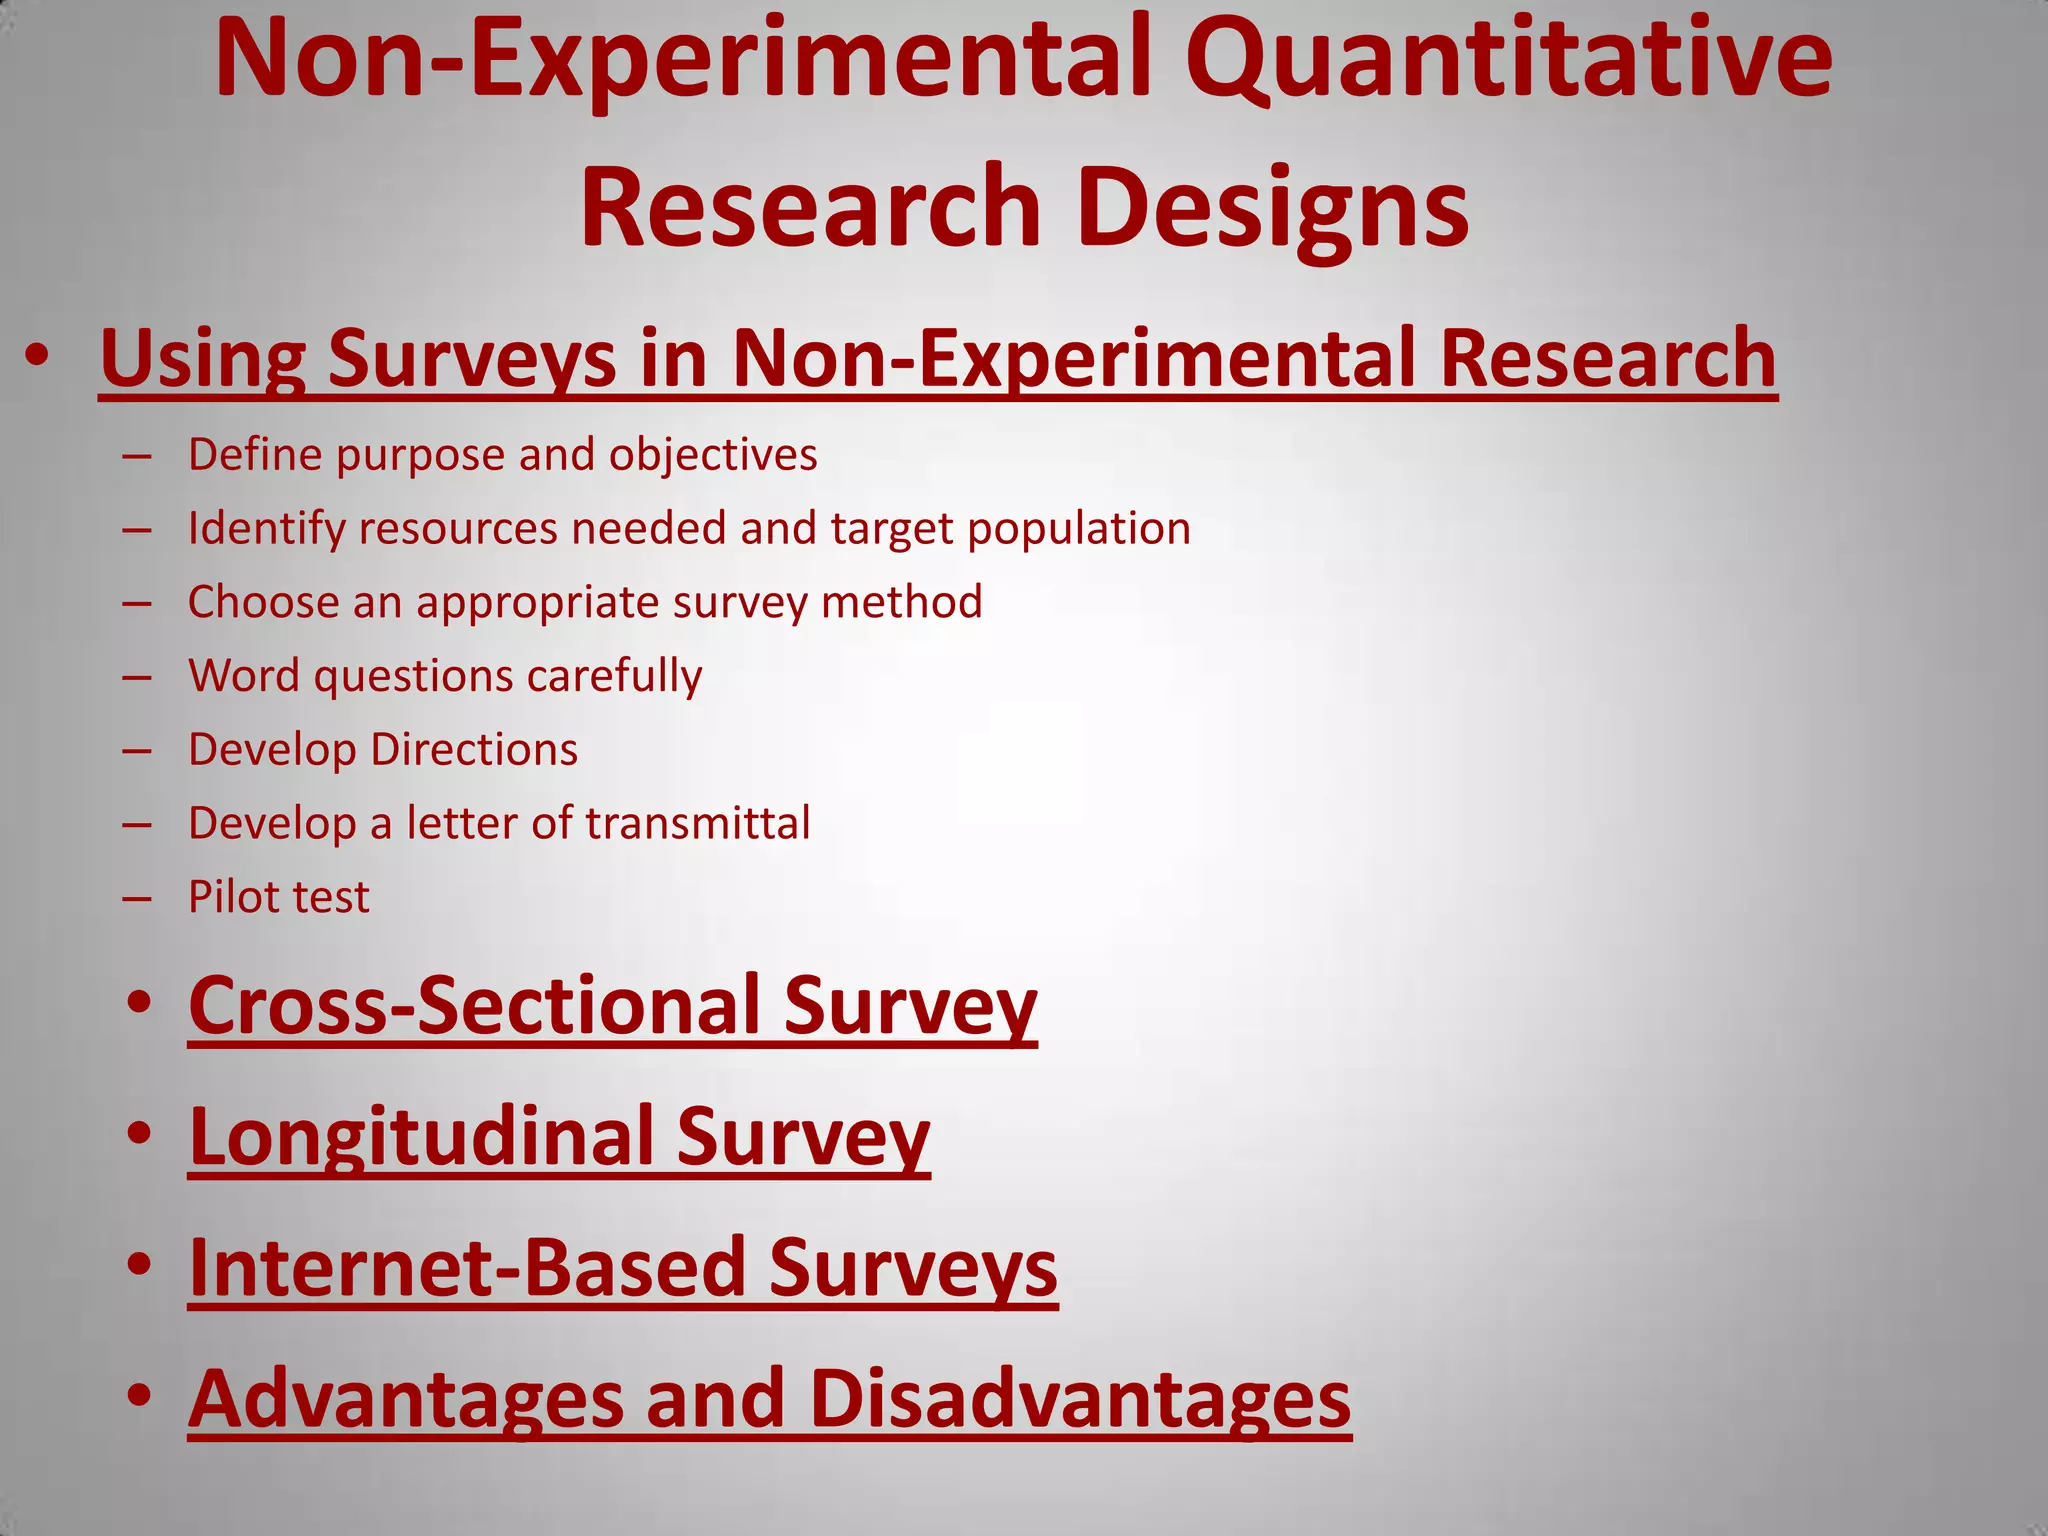
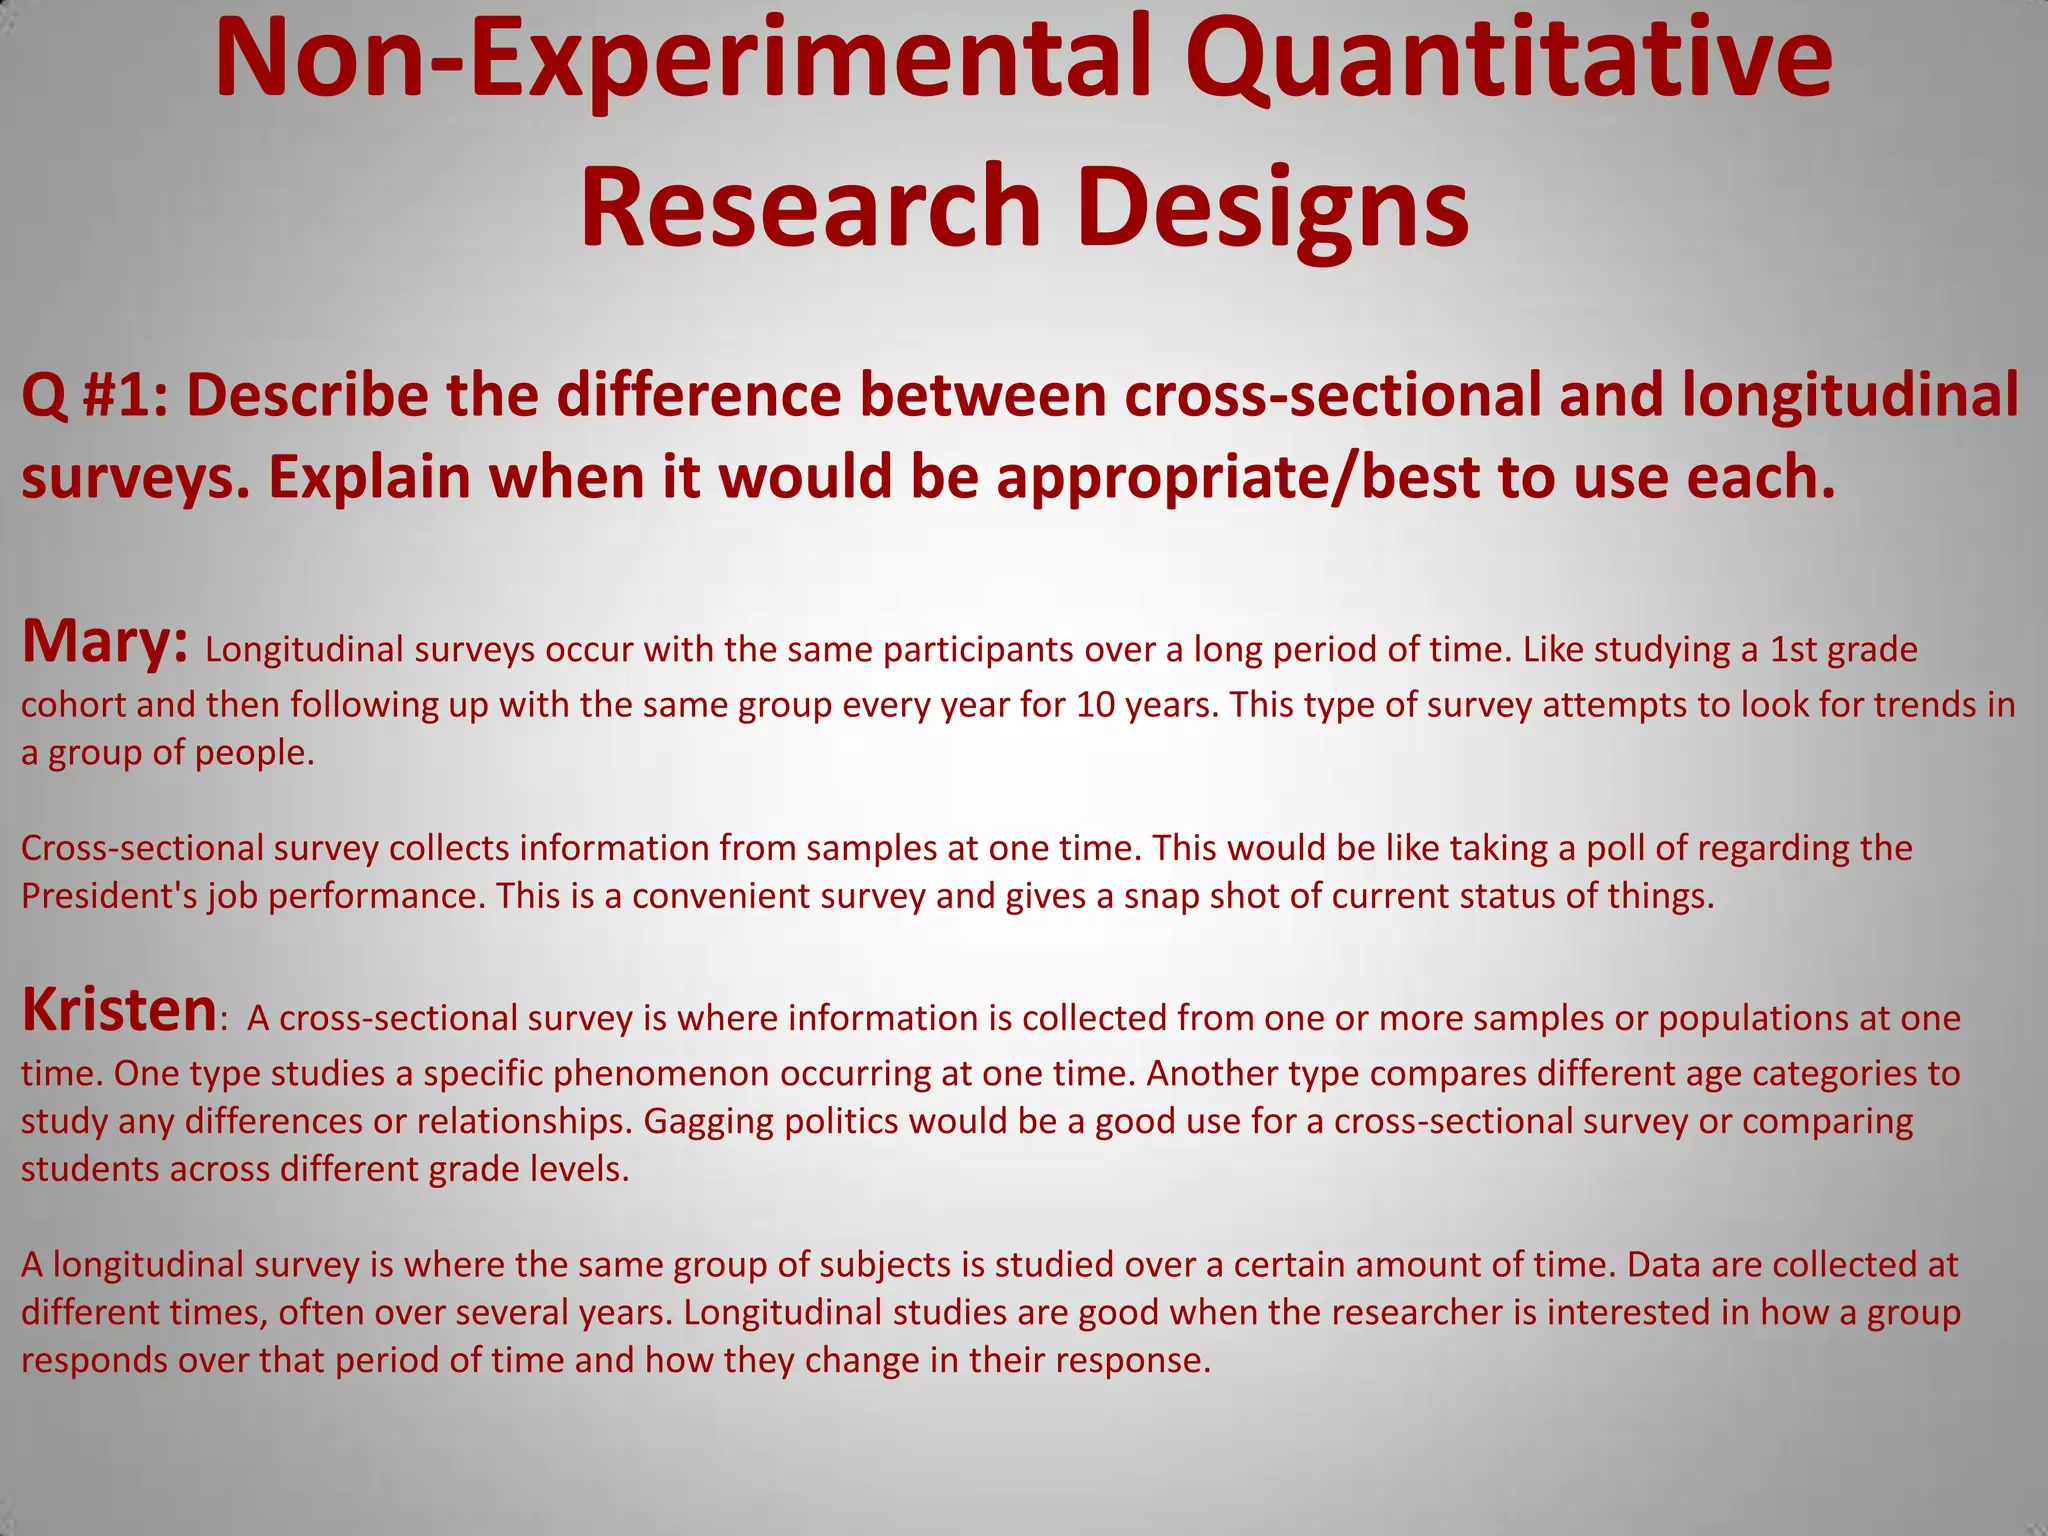
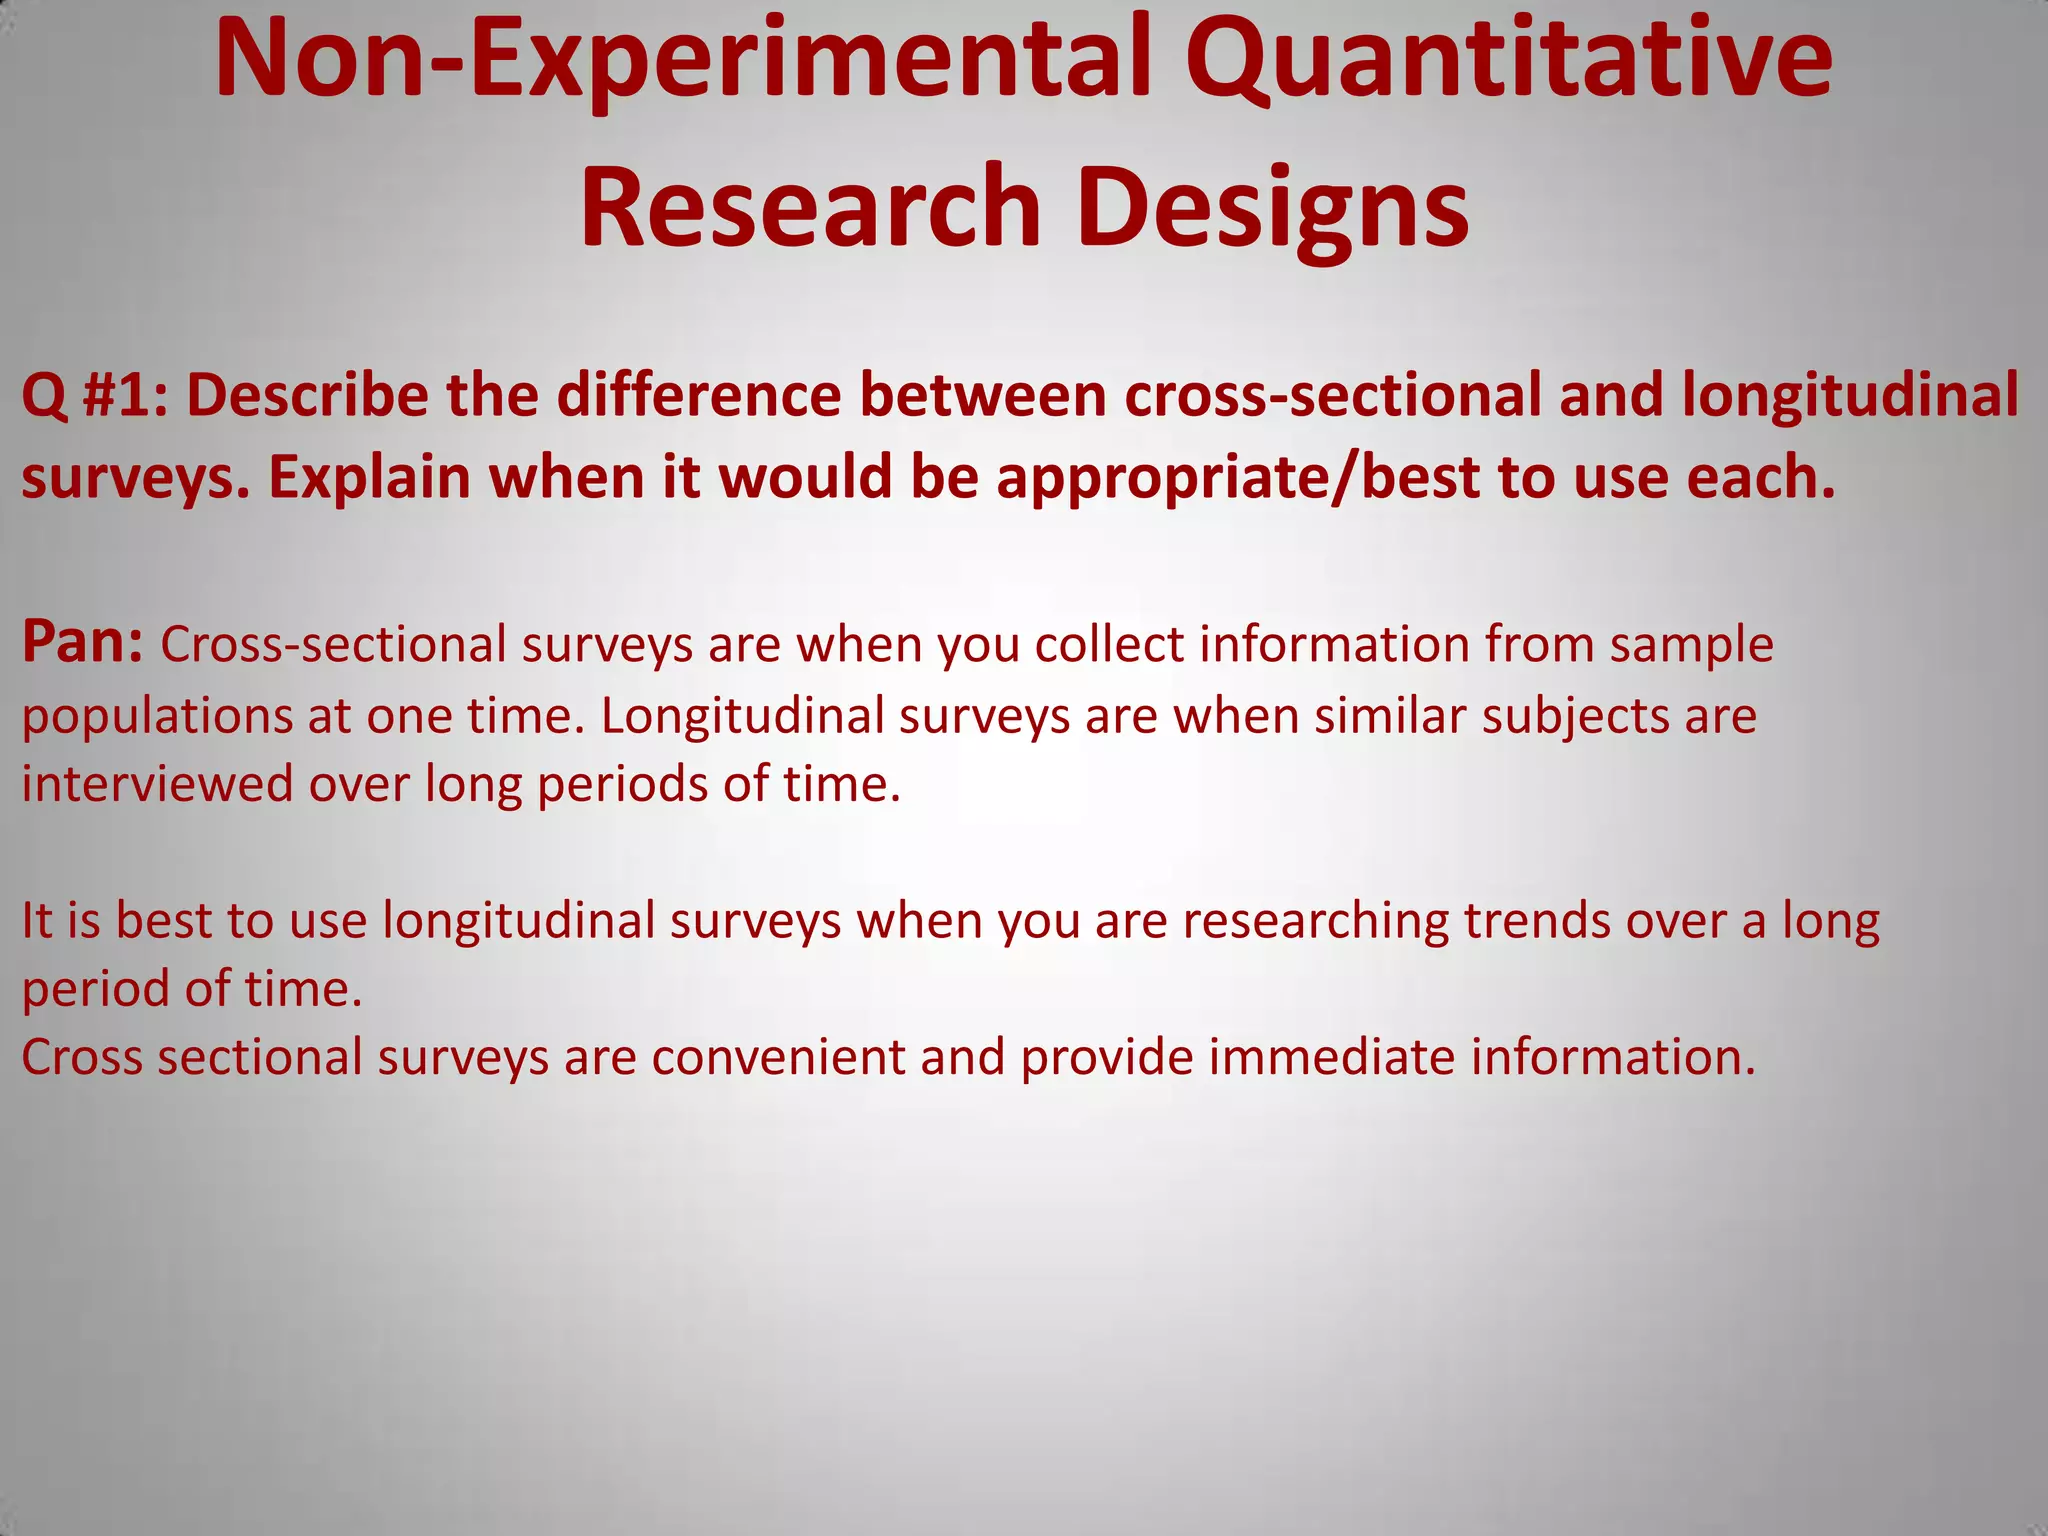
Non-Experimental Quantitative Research DesignsChapter 8Germaine HarleyBart Miller
Non-Experimental Quantitative Research DesignsResearch Design
How information is obtained
  The plan and structure of research to provide a credible answer to a research question
Purpose of Non-Experimental Research
Describes existing phenomena without changing some condition to affect subjects’ responses.
 A report of the way things are or the way things were.
 Investigates the current status of something.Non-Experimental Quantitative Research DesignsFour types of designs- Descriptive- RelationshipsComparativeCorrelational- Causal-comparative- Ex Post Facto- Survey
Non-Experimental Quantitative Research DesignsDescriptive Studies
 Describes a phenomenon – in the form of stats, percentages, averages, frequencies, etc.
  Graphs and Visuals
  Book Example – Classroom Climate/Student’s Attitudes & Learning
Describe what is meant by “classroom climate” – Once established – variables can be related.
Consumer Tips
Conclusions about relationships should be made with caution
  Subjects and instrumentation should be well described Non-Experimental Quantitative Research DesignsRelationships in Non-Experimental DesignsRelationship/AssociationSystematic variation between two variablesTypes of Relationship StudiesComparativeCorrelational

Non experimental%20 quantitative%20research%20designs-1

  • 1.
    Non-Experimental Quantitative ResearchDesignsChapter 8Germaine HarleyBart Miller
  • 2.
  • 3.
  • 4.
    Theplan and structure of research to provide a credible answer to a research question
  • 5.
  • 6.
    Describes existing phenomenawithout changing some condition to affect subjects’ responses.
  • 7.
    A reportof the way things are or the way things were.
  • 8.
    Investigates thecurrent status of something.Non-Experimental Quantitative Research DesignsFour types of designs- Descriptive- RelationshipsComparativeCorrelational- Causal-comparative- Ex Post Facto- Survey
  • 9.
    Non-Experimental Quantitative ResearchDesignsDescriptive Studies
  • 10.
    Describes aphenomenon – in the form of stats, percentages, averages, frequencies, etc.
  • 11.
    Graphsand Visuals
  • 12.
    BookExample – Classroom Climate/Student’s Attitudes & Learning
  • 13.
    Describe what ismeant by “classroom climate” – Once established – variables can be related.
  • 14.
  • 15.
    Conclusions about relationshipsshould be made with caution
  • 16.
    Subjectsand instrumentation should be well described Non-Experimental Quantitative Research DesignsRelationships in Non-Experimental DesignsRelationship/AssociationSystematic variation between two variablesTypes of Relationship StudiesComparativeCorrelational
  • 17.
  • 18.
    Non-Experimental Quantitative ResearchDesignsQ #2: Why are relationships important in nonexperimental designs? Mary: Because relationships describe differences or similarities between variables, they are important to help the researcher identify the variables to study. Also, studying relationships can help researchers to identify causes of, or to predict behaviors or outcomes. Kristen: There are many reasons relationships are important in non-experimental designs. 1. they allow us to make a preliminary identification of possible causes for the outcomes in the research. 2. they help us indentify variables to be studied. 3. they allow us to predict the value of one variable based on other variables. 4. the research is dominated by the term and, therefore, it is important to know what is meant by it. Pan: Relationships allow us to identify causes of educational phenomena and can identify variables for research. And they can help us predict the importance of one variable over another. Relationships are very important in research. Research is to examine all sorts of relationships between different things.
  • 19.
    Non-Experimental Quantitative ResearchDesignsComparative StudiesCompares two or more groups on a variable.Example: If math scores for males are significantly higher than those for females, a relationship exists between gender and math achievement Consumer TipsSubjects instrumentation, and procedures should be well describedIdentify the criteria for establishing different groupsDo not infer causation from comparative research designsGraphic presentations should not distort the results
  • 20.
    Non-Experimental Quantitative ResearchDesignsCorrelational StudiesTwo or more variables are related with the use of one or more correlations coefficients.Coefficient expresses the nature of the relationship between the variables.Reliability of instrument is important – without it, it is difficult to obtain a significant correlation coefficient.Lack of variability in scores (e.g., everyone scoring very, very low; everyone scoring very, very high; etc.) makes it difficult to identify relationships. Restriction in range - when the variability of scores is small, the correlation will be low.
  • 21.
    Non-Experimental Quantitative ResearchDesignsPrediction Studies- Show how one variable can predict another.Predictor Variable – H.S. GPA precedes college GPACriterion Variable – The predicted dependent variableMultiple Regression AnalysisProvides a single index of the predictive power of all the predictor variables together in studies with several predictor variables. Combines several predictor variablesCoefficient of Multiple CorrelationThe correlation of all the independent variables (predictor variables) to the dependent variable (criterion variable)Symbol = R
  • 22.
    Non-Experimental Quantitative ResearchDesignsConsumer TipsCausation should not be inferred from correlationA relationship between two variables (e.g., achievement and attitude) does not mean one causes the other (i.e., positive attitudes do not cause high levels of achievement.The reported correlation should not be higher or lower than the actual relationshipRestriction in range Attenuation – lowering of correlation because of unreliable measures.Practical significance should not be confused with statistical significance(Coefficient of Determination) – the square of the correlation coefficientThe size of the correlation should be sufficient for the use of the results.Prediction studies should report accuracy of prediction for new subjects.Procedures for collecting data should be clearly indicated.
  • 23.
    Non-Experimental Quantitative ResearchDesignsCausal-Comparative Ex-Post Facto StudiesConsumer TipsPrimary purpose of the research should be to investigate causal relationships when an experiment is not possibleThe presumed causal condition should have already occurred in an ex post facto study Potential extraneous variables should be recognized and consideredDifferences between groups being compared should be controlledCausal conclusions should be made with caution
  • 24.
    Non-Experimental Quantitative ResearchDesignsUsing Surveys in Non-Experimental ResearchDefine purpose and objectivesIdentify resources needed and target populationChoose an appropriate survey methodWord questions carefullyDevelop DirectionsDevelop a letter of transmittalPilot testCross-Sectional Survey
  • 25.
  • 26.
  • 27.
    Advantages and DisadvantagesNon-ExperimentalQuantitative Research DesignsQ #1: Describe the difference between cross-sectional and longitudinal surveys. Explain when it would be appropriate/best to use each.Mary: Longitudinal surveys occur with the same participants over a long period of time. Like studying a 1st grade cohort and then following up with the same group every year for 10 years. This type of survey attempts to look for trends in a group of people.Cross-sectional survey collects information from samples at one time. This would be like taking a poll of regarding the President's job performance. This is a convenient survey and gives a snap shot of current status of things. Kristen: A cross-sectional survey is where information is collected from one or more samples or populations at one time. One type studies a specific phenomenon occurring at one time. Another type compares different age categories to study any differences or relationships. Gagging politics would be a good use for a cross-sectional survey or comparing students across different grade levels.A longitudinal survey is where the same group of subjects is studied over a certain amount of time. Data are collected at different times, often over several years. Longitudinal studies are good when the researcher is interested in how a group responds over that period of time and how they change in their response.
  • 28.
    Non-Experimental Quantitative ResearchDesignsQ #1: Describe the difference between cross-sectional and longitudinal surveys. Explain when it would be appropriate/best to use each.Pan: Cross-sectional surveys are when you collect information from sample populations at one time. Longitudinal surveys are when similar subjects are interviewed over long periods of time.It is best to use longitudinal surveys when you are researching trends over a long period of time.Cross sectional surveys are convenient and provide immediate information.
  • 29.