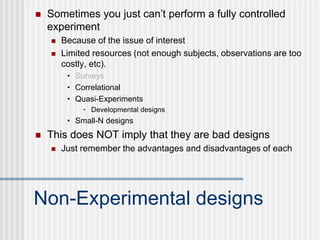
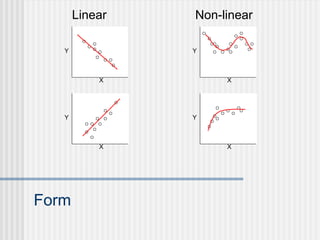
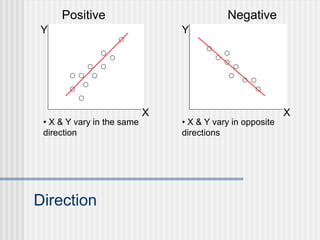
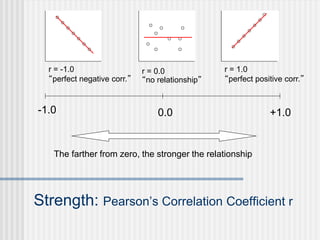
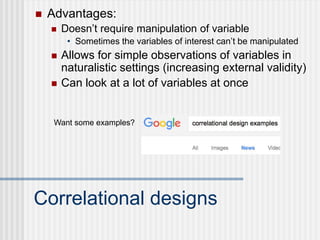
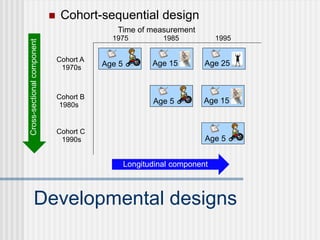
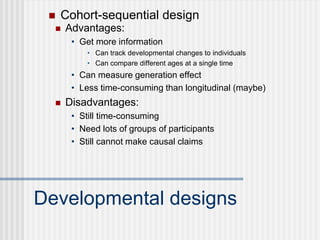
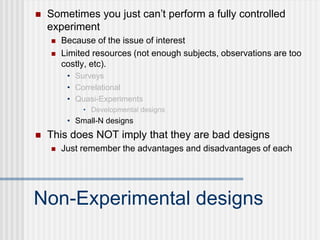
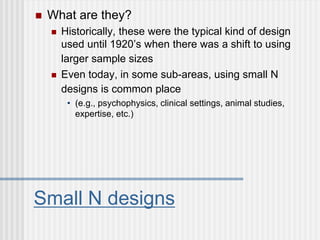
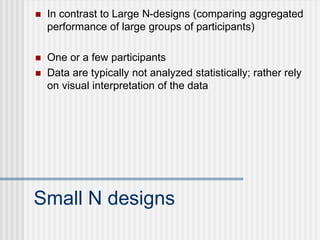
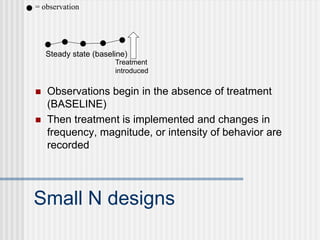
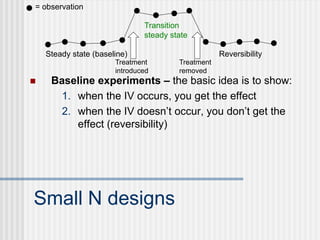
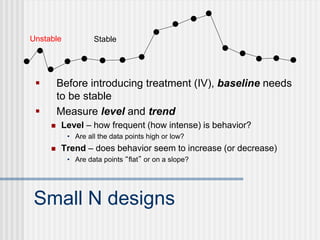
This document discusses non-experimental research designs, including correlational, quasi-experimental, developmental, and small-N designs. Correlational designs examine relationships between variables without manipulation. Quasi-experiments approximate true experiments but lack full control or random assignment. Developmental designs study age-related changes using cross-sectional, longitudinal, or cohort-sequential methods. Small-N designs involve in-depth analysis of a small number of cases. While not as rigorous as experiments, these non-experimental designs are still valuable when manipulation is not possible or ethical.


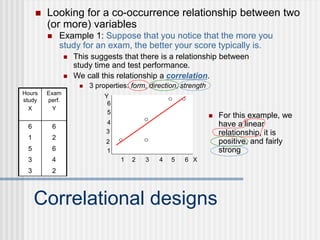
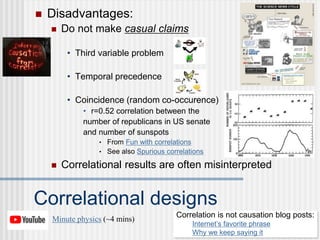
![Misunderstood Correlational designs
Example 2: Suppose that you notice that kids
who sit in the front of class typically get higher
grades.
This suggests that there is a relationship between
where you sit in class and grades.
Daily Gazzett
Children who sit in the
back of the classroom
receive lower grades
than those who sit in
the front.
Possibly implied: “[All] Children who sit in the
back of the classroom [always] receive lower
grades than those [each and every child] who sit
in the front.”
Incorrect interpretation: Sitting in the back of the
classroom causes lower grades.
Better way to say it: “Researchers X and Y found
that children who sat in the back of the
classroom were more likely to receive lower
grades than those who sat in the front.”
Other examples:
Psych you mind | PsyBlog](https://image.slidesharecdn.com/21-230605020206-cc3bf90d/85/non-experimental-11-320.jpg)


![제 23회 보아즈(BOAZ) 빅데이터 컨퍼런스 - [MBOAX] : ABSA를 활용한 소비자 반응 분석 기반 운영 효율화 대시보드 설계](https://cdn.slidesharecdn.com/ss_thumbnails/3-1boaz23rdconferencemboax-260203102709-9d519923-thumbnail.jpg?width=640&height=640&fit=bounds)


