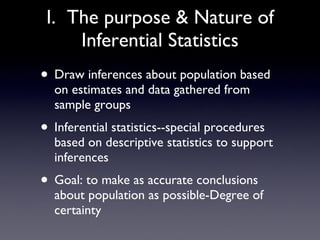
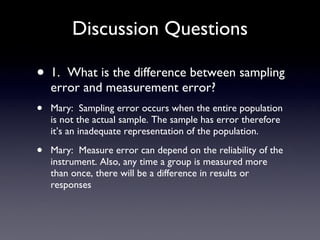
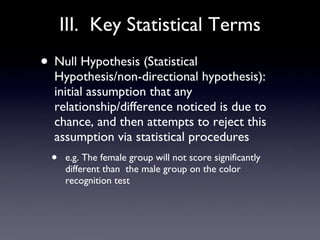
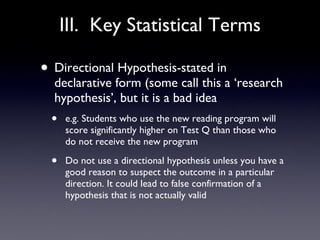
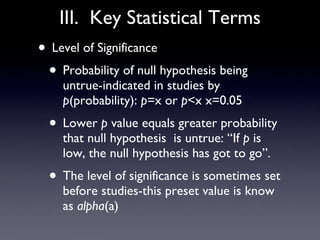
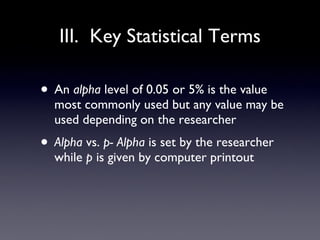
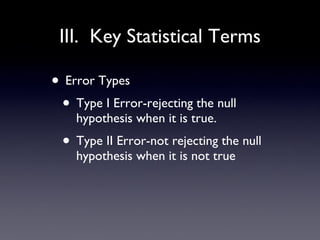
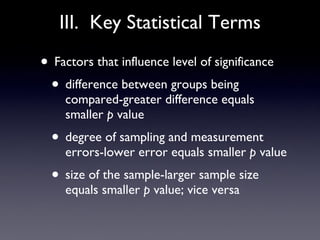
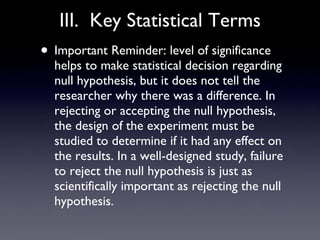
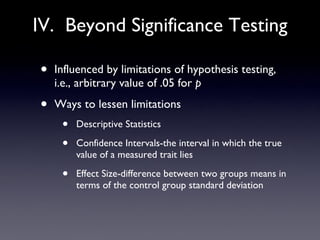
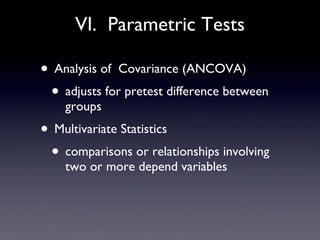
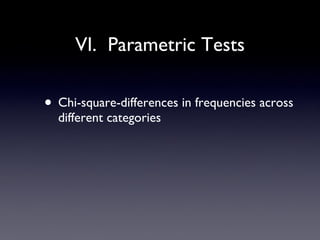
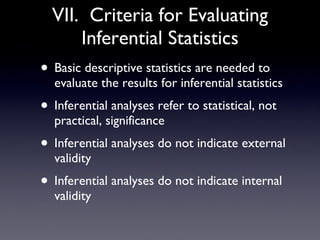
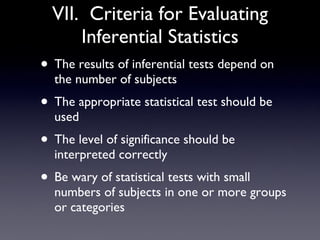
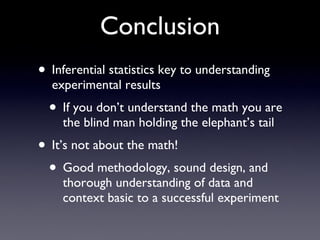
Understanding Statistical Inferences Chapter 10 Educational Research: Fundamentals for the Consumer Pan Zhang  4/24/2011
I.  The purpose & Nature of Inferential Statistics Draw inferences about population based on estimates and data gathered from sample groups Inferential statistics--special procedures based on descriptive statistics to support inferences  Goal: to make as accurate conclusions about population as possible-Degree of certainty
Discussion Questions 1.  What is the difference between sampling error and measurement error? Mary:  Sampling error occurs when the entire population is not the actual sample. The sample has error therefore it’s an inadequate representation of the population. Mary:  Measure error can depend on the reliability of the instrument. Also, any time a group is measured more than once, there will be a difference in results or responses
Discussion Questions Germaine:  A sampling error is inferring that an entire population is represented by merely a sample of that population. Germaine:  A measurement error depends on the reliability of the instrument. The higher the reliability of the instrument, the lower the amount of the measurement error.
Discussion Questions 1.  What is the difference between sampling error and measurement error? Bart:  Sampling error occurs when the subjects in the sample are measured and then inferred to obtain results for the entire population. Whereas measurement error occurs when researchers infer a real or true value on a trait from imperfect measurement. Based on the reliability of the measuring instrument.
II.  Errors in Sampling &Measurement Sample errors-if entire population is not measured, results of experiments can be inaccurate large sample sizes equal less chance of error; smaller sample sizes equal larger chance of error degree of sampling error must be taken into account when making inferences
II.  Errors in Sampling & Measurement Measurement errors-errors can occur no matter sample size need to pay attention to: lack of validity or lack of reliability degree of measurement error must be taken into account when making inferences
III.  Key Statistical Terms Null Hypothesis (Statistical Hypothesis/non-directional hypothesis): initial assumption that any relationship/difference noticed is due to chance, and then attempts to reject this assumption via statistical procedures e.g. The female group will not score significantly different than  the male group on the color recognition test
III.  Key Statistical Terms Directional Hypothesis-stated in declarative form (some call this a ‘research hypothesis’, but it is a bad idea e.g. Students who use the new reading program will score significantly higher on Test Q than those who do not receive the new program Do not use a directional hypothesis unless you have a good reason to suspect the outcome in a particular direction. It could lead to false confirmation of a hypothesis that is not actually valid
III.  Key Statistical Terms Level of Significance Probability of null hypothesis being untrue-indicated in studies by  p (probability):  p =x or  p <x x=0.05 Lower  p  value equals greater probability that null hypothesis  is untrue: “If  p  is low, the null hypothesis has got to go”.  The level of significance is sometimes set before studies-this preset value is know as  alpha (a)
III.  Key Statistical Terms An  alpha  level of 0.05 or 5% is the value most commonly used but any value may be used depending on the researcher Alpha  vs.  p- Alpha  is set by the researcher while  p  is given by computer printout
III.  Key Statistical Terms Error Types Type I Error-rejecting the null hypothesis when it is true. Type II Error-not rejecting the null hypothesis when it is not true
III.  Key Statistical Terms Factors that influence level of significance difference between groups being compared-greater difference equals smaller  p  value degree of sampling and measurement errors-lower error equals smaller  p  value size of the sample-larger sample size equals smaller  p  value; vice versa
III.  Key Statistical Terms Important Reminder: level of significance helps to make statistical decision regarding null hypothesis, but it does not tell the researcher why there was a difference. In rejecting or accepting the null hypothesis, the design of the experiment must be studied to determine if it had any effect on the results. In a well-designed study, failure to reject the null hypothesis is just as scientifically important as rejecting the null hypothesis.
IV.  Beyond Significance Testing Influenced by limitations of hypothesis testing, i.e., arbitrary value of .05 for  p Ways to lessen limitations Descriptive Statistics Confidence Intervals-the interval in which the true value of a measured trait lies Effect Size-difference between two groups means in terms of the control group standard deviation
IV.  Beyond Significance Testing Effect size-Statistical significance vs Practical significance statistical significance: it is unlikely that a result occurs by chance practical significance: the result is meaningful and has some practical impact in the real world statistical significance is not equal to practical significance Effect size http://www.youtube.com/watch?v=hEx0ZShqRlc
V.  Types of Inferential Statistics Tests Parametric-based on certain assumptions, i.e., having a population that is normally distributed Nonparametric-use when assumptions for parametric tests are not met
VI.  Parametric Tests T-test--A comparison of the means between two groups Independent-sample-used in designs in which there are different subjects in each group e.g. two randomly assigned groups on a posttest of achievement Dependent-used in single group pretest-posttest designs in which the group members are paired or matched in some way
VI.  Parametric Tests Analysis of Variance (ANOVA) compare two or more means Factorial Analysis of Variation two or more independent variables analyzed together
VI.  Parametric Tests Analysis of  Covariance (ANCOVA) adjusts for pretest difference between groups Multivariate Statistics comparisons or relationships involving two or more depend variables
Discussion Questions 2.  Why would it be helpful to use ANCOVA rather than ANOVA? Mary:  ANCOVA would be appropriate to use when there exists a pretest difference between groups. In this circumstance, it is used to adjust the post test scores to compensate for the original difference between the groups. Germaine:  The ANCOVA can control initial differences that could exist between treatment and control groups
Discussion Questions 2.  Why would it be helpful to use ANCOVA rather than ANOVA? Bart:  Because ANCOVA is a variation of ANOVA, it would be helpful when analyzing data more complex, like from two groups with pretest differences. ANOVA in contrast is comparing two or more means without pretest differences.
VI.  Parametric Tests Chi-square-differences in frequencies across different categories
VII.  Criteria for Evaluating Inferential Statistics Basic descriptive statistics are needed to evaluate the results for inferential statistics Inferential analyses refer to statistical, not practical, significance Inferential analyses do not indicate external validity Inferential analyses do not indicate internal validity
VII.  Criteria for Evaluating Inferential Statistics The results of inferential tests depend on the number of subjects The appropriate statistical test should be used The level of significance should be interpreted correctly Be wary of statistical tests with small numbers of subjects in one or more groups or categories
Conclusion Inferential statistics key to understanding experimental results If you don’t understand the math you are the blind man holding the elephant’s tail It’s not about the math! Good methodology, sound design, and thorough understanding of data and context basic to a successful experiment
Useful Links ANOVA http://www.youtube.com/watch?v=34TLBR0TWwQ http://www.youtube.com/watch?v=1_d_pS6-sos&feature=related P-value http://www.youtube.com/watch?v=lm_CagZXcv8&feature=related http://www.youtube.com/watch?v=ZFXy_UdlQJg&feature=related T-statistics explains P-value  http://www.youtube.com/watch?v=y4WyuiWK6lw&feature=related
Useful Links Student’s T test http://www.youtube.com/watch?v=pqtG1vXg_f8&feature=fvwrel 3 types of ANOVA http://www.youtube.com/watch?v=1nddyCJLAOc&feature=pyv&ad=7259998857&kw=anova&gclid=CKSAgrOttagCFQsGbAodiWkQCQ Effect size http://www.youtube.com/watch?v=hEx0ZShqRlc Chi-square http://www.youtube.com/watch?v=2QeDRsxSF9M&feature=related

Chapter10 3%285%29

  • 1.
    Understanding Statistical InferencesChapter 10 Educational Research: Fundamentals for the Consumer Pan Zhang 4/24/2011
  • 2.
    I. Thepurpose & Nature of Inferential Statistics Draw inferences about population based on estimates and data gathered from sample groups Inferential statistics--special procedures based on descriptive statistics to support inferences Goal: to make as accurate conclusions about population as possible-Degree of certainty
  • 3.
    Discussion Questions 1. What is the difference between sampling error and measurement error? Mary: Sampling error occurs when the entire population is not the actual sample. The sample has error therefore it’s an inadequate representation of the population. Mary: Measure error can depend on the reliability of the instrument. Also, any time a group is measured more than once, there will be a difference in results or responses
  • 4.
    Discussion Questions Germaine: A sampling error is inferring that an entire population is represented by merely a sample of that population. Germaine: A measurement error depends on the reliability of the instrument. The higher the reliability of the instrument, the lower the amount of the measurement error.
  • 5.
    Discussion Questions 1. What is the difference between sampling error and measurement error? Bart: Sampling error occurs when the subjects in the sample are measured and then inferred to obtain results for the entire population. Whereas measurement error occurs when researchers infer a real or true value on a trait from imperfect measurement. Based on the reliability of the measuring instrument.
  • 6.
    II. Errorsin Sampling &Measurement Sample errors-if entire population is not measured, results of experiments can be inaccurate large sample sizes equal less chance of error; smaller sample sizes equal larger chance of error degree of sampling error must be taken into account when making inferences
  • 7.
    II. Errorsin Sampling & Measurement Measurement errors-errors can occur no matter sample size need to pay attention to: lack of validity or lack of reliability degree of measurement error must be taken into account when making inferences
  • 8.
    III. KeyStatistical Terms Null Hypothesis (Statistical Hypothesis/non-directional hypothesis): initial assumption that any relationship/difference noticed is due to chance, and then attempts to reject this assumption via statistical procedures e.g. The female group will not score significantly different than the male group on the color recognition test
  • 9.
    III. KeyStatistical Terms Directional Hypothesis-stated in declarative form (some call this a ‘research hypothesis’, but it is a bad idea e.g. Students who use the new reading program will score significantly higher on Test Q than those who do not receive the new program Do not use a directional hypothesis unless you have a good reason to suspect the outcome in a particular direction. It could lead to false confirmation of a hypothesis that is not actually valid
  • 10.
    III. KeyStatistical Terms Level of Significance Probability of null hypothesis being untrue-indicated in studies by p (probability): p =x or p <x x=0.05 Lower p value equals greater probability that null hypothesis is untrue: “If p is low, the null hypothesis has got to go”. The level of significance is sometimes set before studies-this preset value is know as alpha (a)
  • 11.
    III. KeyStatistical Terms An alpha level of 0.05 or 5% is the value most commonly used but any value may be used depending on the researcher Alpha vs. p- Alpha is set by the researcher while p is given by computer printout
  • 12.
    III. KeyStatistical Terms Error Types Type I Error-rejecting the null hypothesis when it is true. Type II Error-not rejecting the null hypothesis when it is not true
  • 13.
    III. KeyStatistical Terms Factors that influence level of significance difference between groups being compared-greater difference equals smaller p value degree of sampling and measurement errors-lower error equals smaller p value size of the sample-larger sample size equals smaller p value; vice versa
  • 14.
    III. KeyStatistical Terms Important Reminder: level of significance helps to make statistical decision regarding null hypothesis, but it does not tell the researcher why there was a difference. In rejecting or accepting the null hypothesis, the design of the experiment must be studied to determine if it had any effect on the results. In a well-designed study, failure to reject the null hypothesis is just as scientifically important as rejecting the null hypothesis.
  • 15.
    IV. BeyondSignificance Testing Influenced by limitations of hypothesis testing, i.e., arbitrary value of .05 for p Ways to lessen limitations Descriptive Statistics Confidence Intervals-the interval in which the true value of a measured trait lies Effect Size-difference between two groups means in terms of the control group standard deviation
  • 16.
    IV. BeyondSignificance Testing Effect size-Statistical significance vs Practical significance statistical significance: it is unlikely that a result occurs by chance practical significance: the result is meaningful and has some practical impact in the real world statistical significance is not equal to practical significance Effect size http://www.youtube.com/watch?v=hEx0ZShqRlc
  • 17.
    V. Typesof Inferential Statistics Tests Parametric-based on certain assumptions, i.e., having a population that is normally distributed Nonparametric-use when assumptions for parametric tests are not met
  • 18.
    VI. ParametricTests T-test--A comparison of the means between two groups Independent-sample-used in designs in which there are different subjects in each group e.g. two randomly assigned groups on a posttest of achievement Dependent-used in single group pretest-posttest designs in which the group members are paired or matched in some way
  • 19.
    VI. ParametricTests Analysis of Variance (ANOVA) compare two or more means Factorial Analysis of Variation two or more independent variables analyzed together
  • 20.
    VI. ParametricTests Analysis of Covariance (ANCOVA) adjusts for pretest difference between groups Multivariate Statistics comparisons or relationships involving two or more depend variables
  • 21.
    Discussion Questions 2. Why would it be helpful to use ANCOVA rather than ANOVA? Mary: ANCOVA would be appropriate to use when there exists a pretest difference between groups. In this circumstance, it is used to adjust the post test scores to compensate for the original difference between the groups. Germaine: The ANCOVA can control initial differences that could exist between treatment and control groups
  • 22.
    Discussion Questions 2. Why would it be helpful to use ANCOVA rather than ANOVA? Bart: Because ANCOVA is a variation of ANOVA, it would be helpful when analyzing data more complex, like from two groups with pretest differences. ANOVA in contrast is comparing two or more means without pretest differences.
  • 23.
    VI. ParametricTests Chi-square-differences in frequencies across different categories
  • 24.
    VII. Criteriafor Evaluating Inferential Statistics Basic descriptive statistics are needed to evaluate the results for inferential statistics Inferential analyses refer to statistical, not practical, significance Inferential analyses do not indicate external validity Inferential analyses do not indicate internal validity
  • 25.
    VII. Criteriafor Evaluating Inferential Statistics The results of inferential tests depend on the number of subjects The appropriate statistical test should be used The level of significance should be interpreted correctly Be wary of statistical tests with small numbers of subjects in one or more groups or categories
  • 26.
    Conclusion Inferential statisticskey to understanding experimental results If you don’t understand the math you are the blind man holding the elephant’s tail It’s not about the math! Good methodology, sound design, and thorough understanding of data and context basic to a successful experiment
  • 27.
    Useful Links ANOVAhttp://www.youtube.com/watch?v=34TLBR0TWwQ http://www.youtube.com/watch?v=1_d_pS6-sos&feature=related P-value http://www.youtube.com/watch?v=lm_CagZXcv8&feature=related http://www.youtube.com/watch?v=ZFXy_UdlQJg&feature=related T-statistics explains P-value http://www.youtube.com/watch?v=y4WyuiWK6lw&feature=related
  • 28.
    Useful Links Student’sT test http://www.youtube.com/watch?v=pqtG1vXg_f8&feature=fvwrel 3 types of ANOVA http://www.youtube.com/watch?v=1nddyCJLAOc&feature=pyv&ad=7259998857&kw=anova&gclid=CKSAgrOttagCFQsGbAodiWkQCQ Effect size http://www.youtube.com/watch?v=hEx0ZShqRlc Chi-square http://www.youtube.com/watch?v=2QeDRsxSF9M&feature=related