This document provides an overview of survey and correlational research methods. It defines survey research as collecting data using instruments like questionnaires to answer questions about people's opinions or characteristics. The main purposes of surveys are to gather information about groups and sample populations. Correlational research determines if and how strongly two or more variables are related by calculating correlation coefficients. Relationship studies explore factors related to complex variables, while prediction studies use correlations to predict outcomes. The document outlines different survey and correlational research designs, procedures, analyses, and considerations.
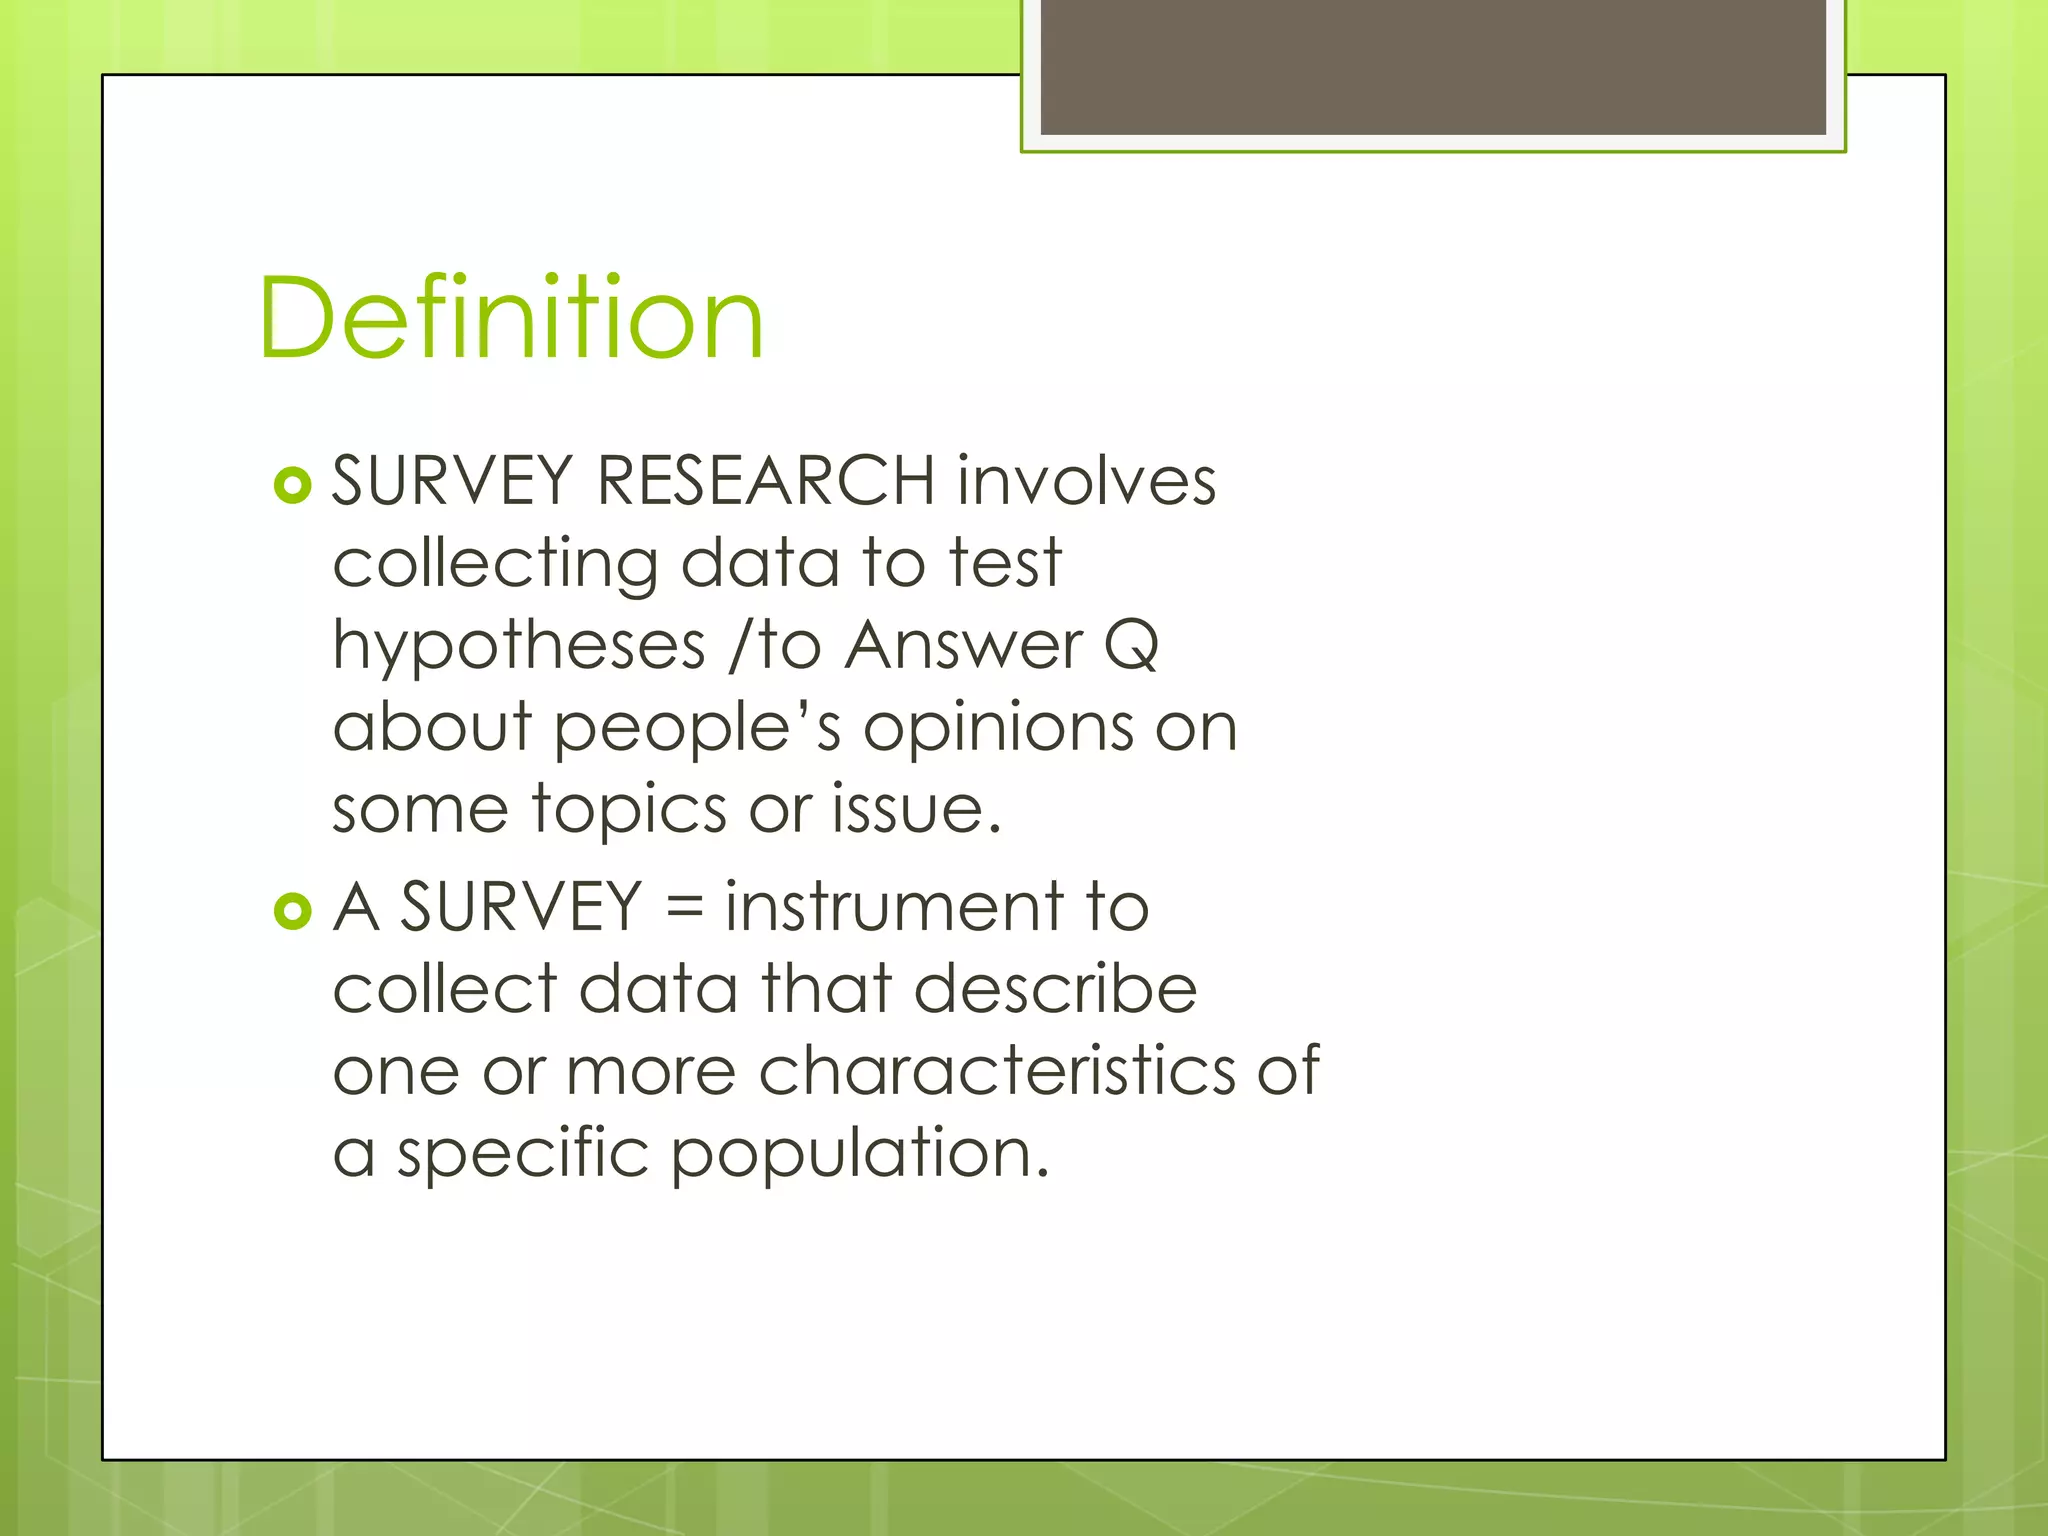
Definition
SURVEY
RESEARCH involves
collectingdata to test
hypotheses /to Answer Q
about people’s opinions on
some topics or issue.
A SURVEY = instrument to
collect data that describe
one or more characteristics of
a specific population.
4.
Purpose
Gather information aboutgroups beliefs,
attitudes, behaviour, and demographic
composition.
SAMPLE SURVEY: researcher attempts to infer
information about population based on a
representative sample drawn from that
population.
CENSUS SURVEY: researcher attempts to
acquire information from every member of a
population.
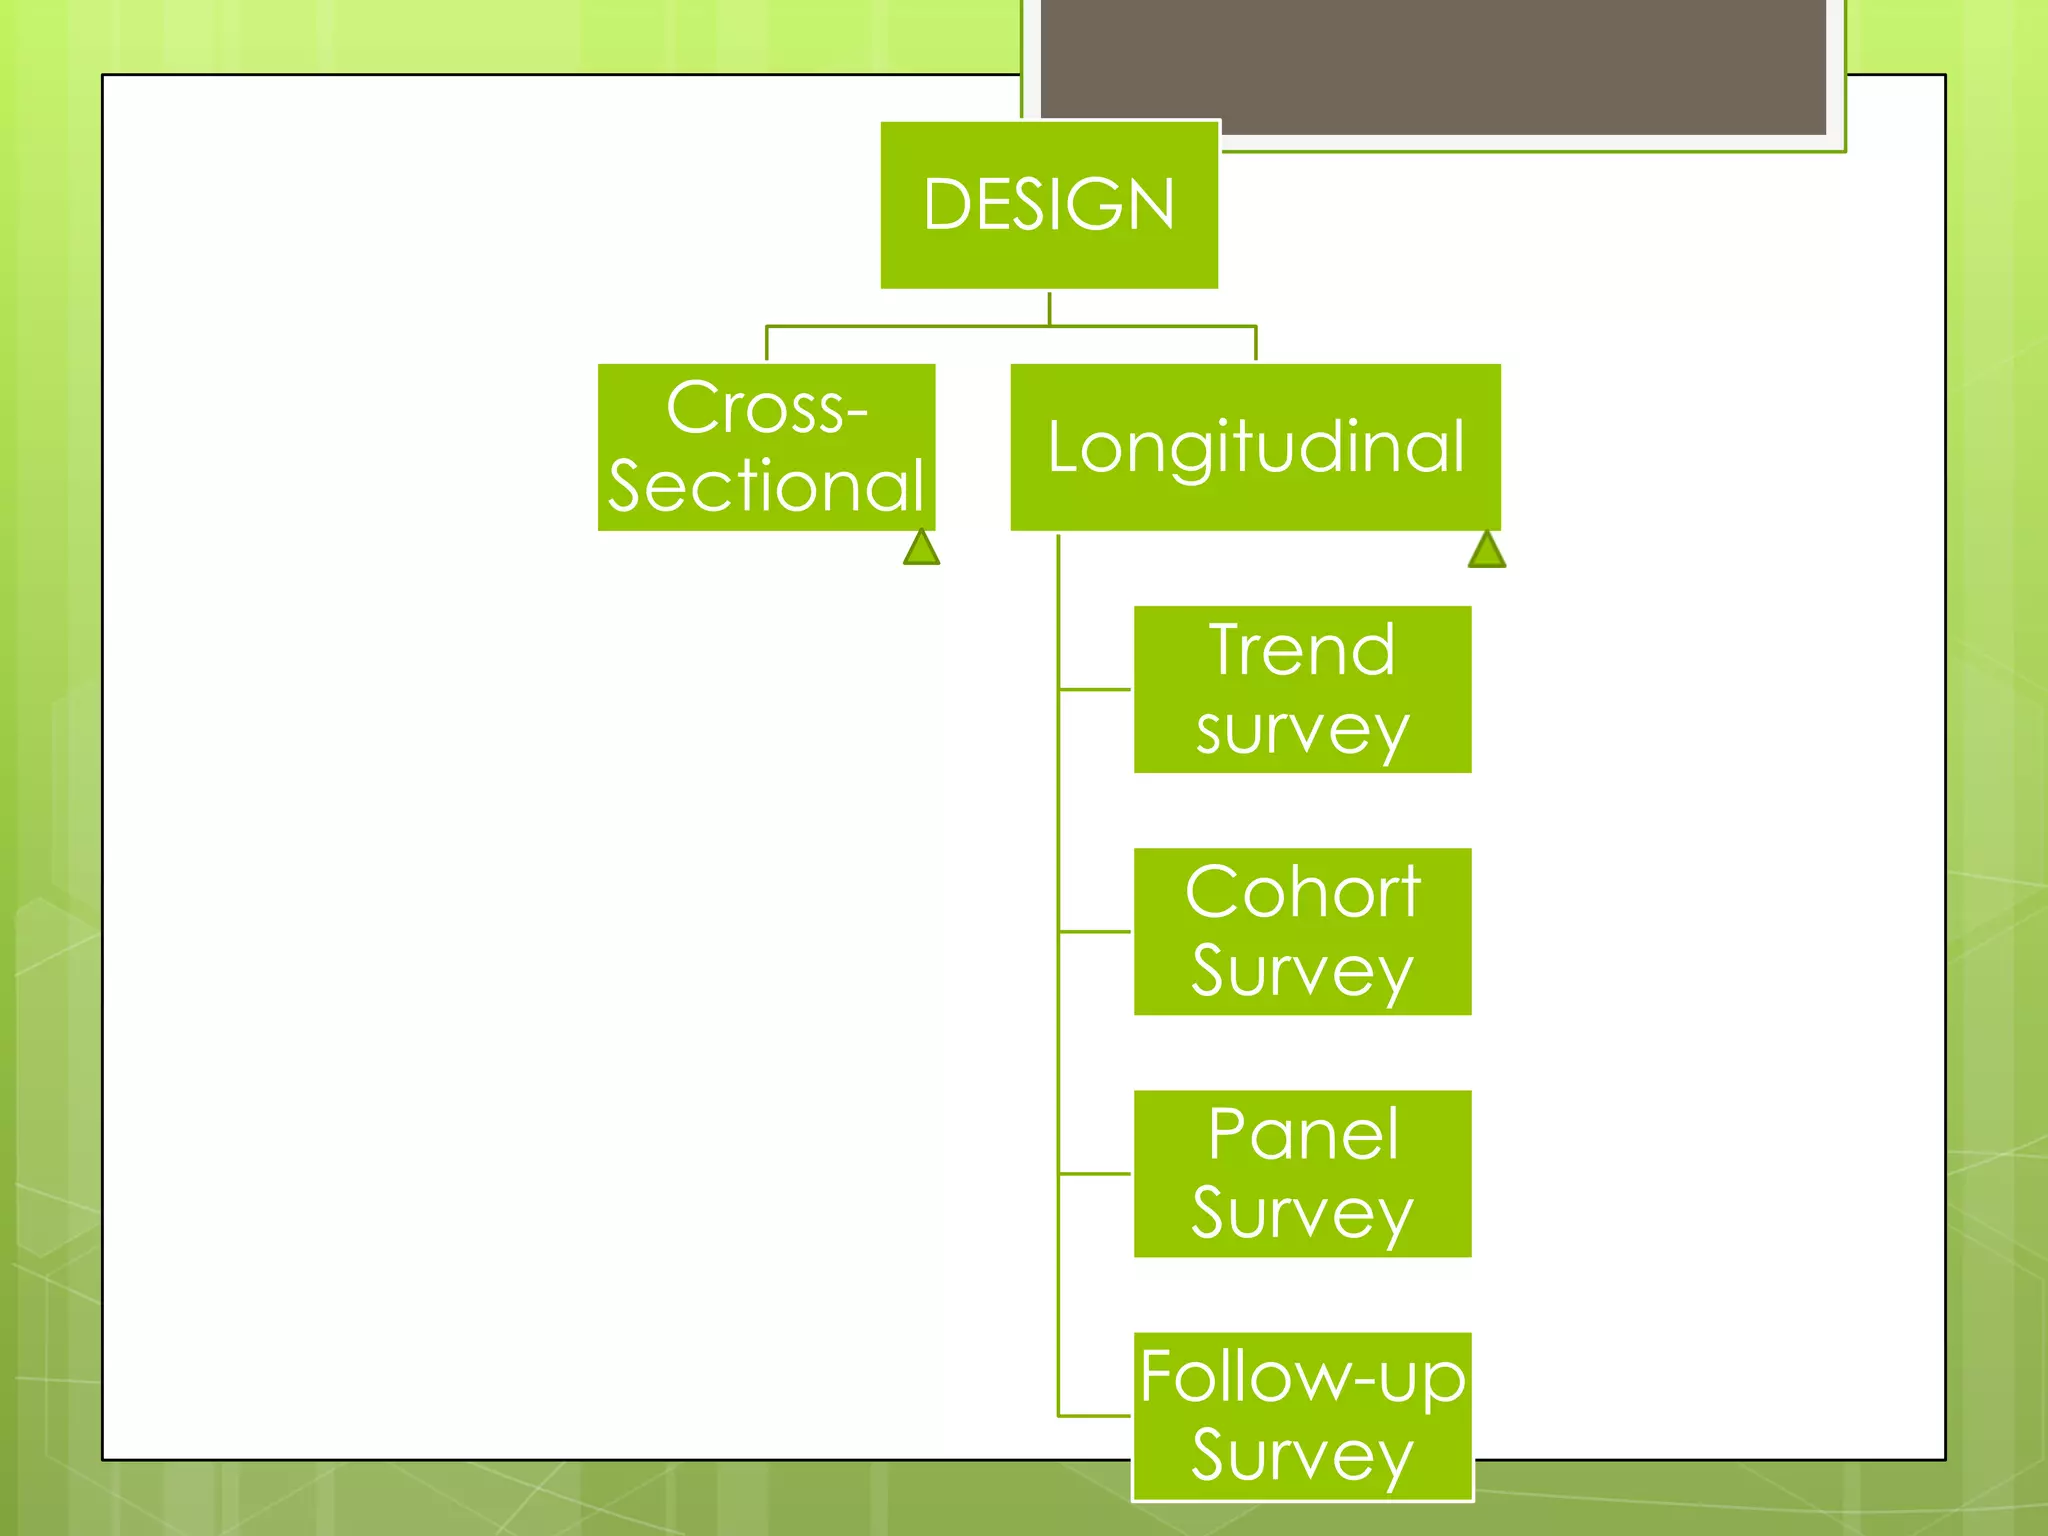
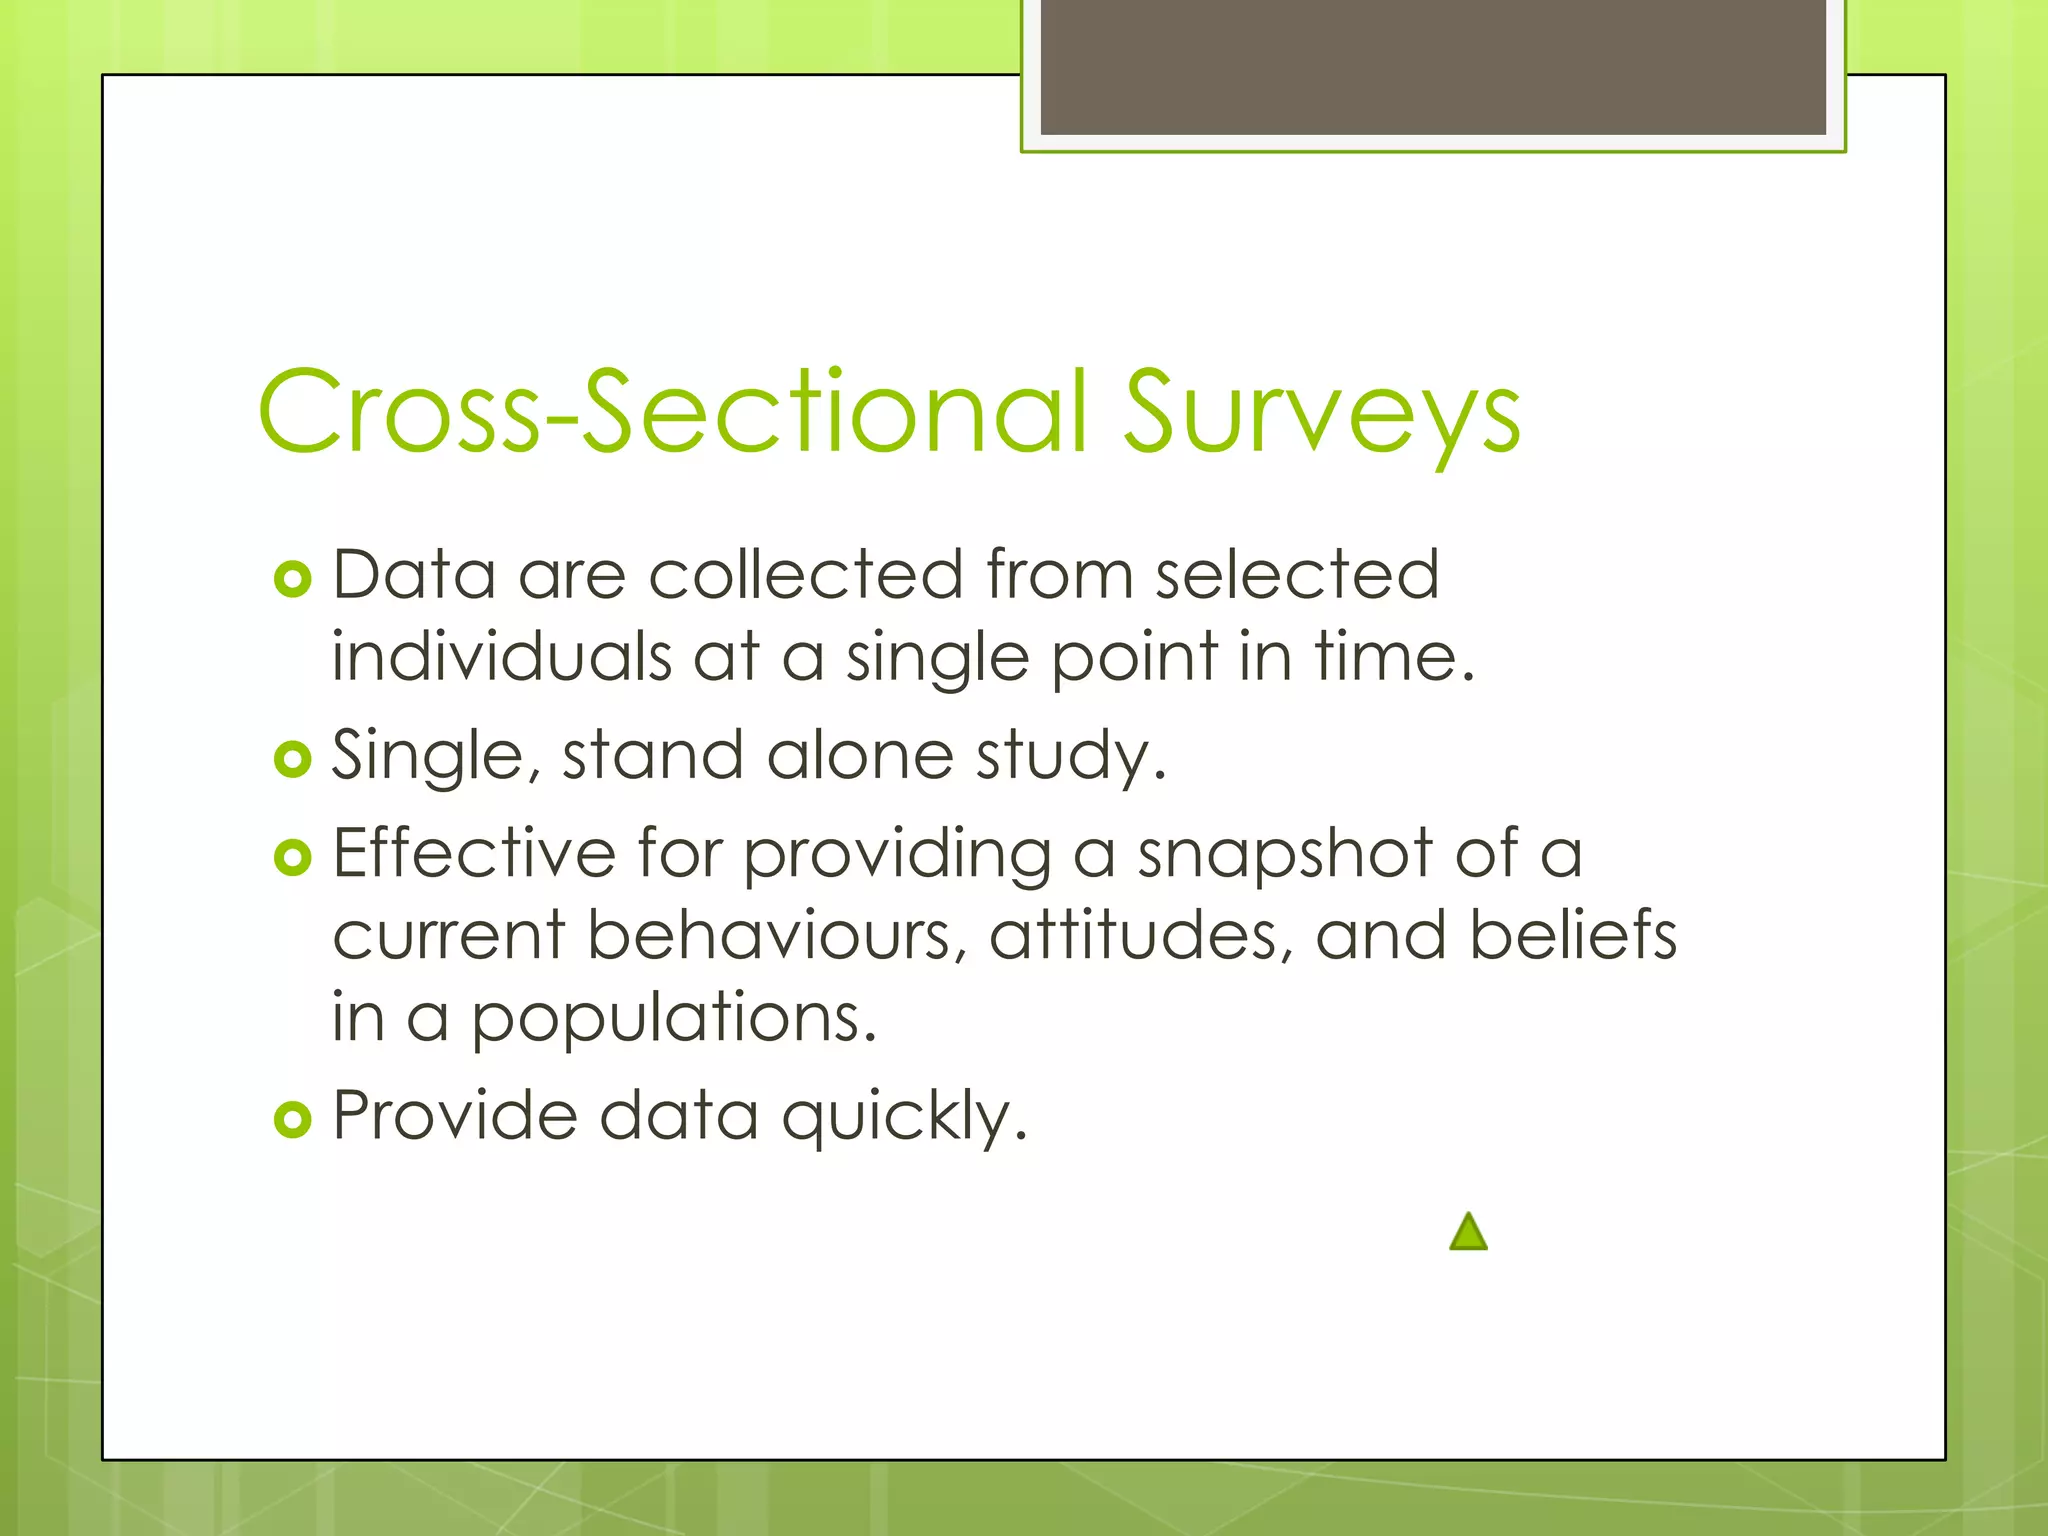
Cross-Sectional Surveys
Data
arecollected from selected
individuals at a single point in time.
Single, stand alone study.
Effective for providing a snapshot of a
current behaviours, attitudes, and beliefs
in a populations.
Provide data quickly.
7.
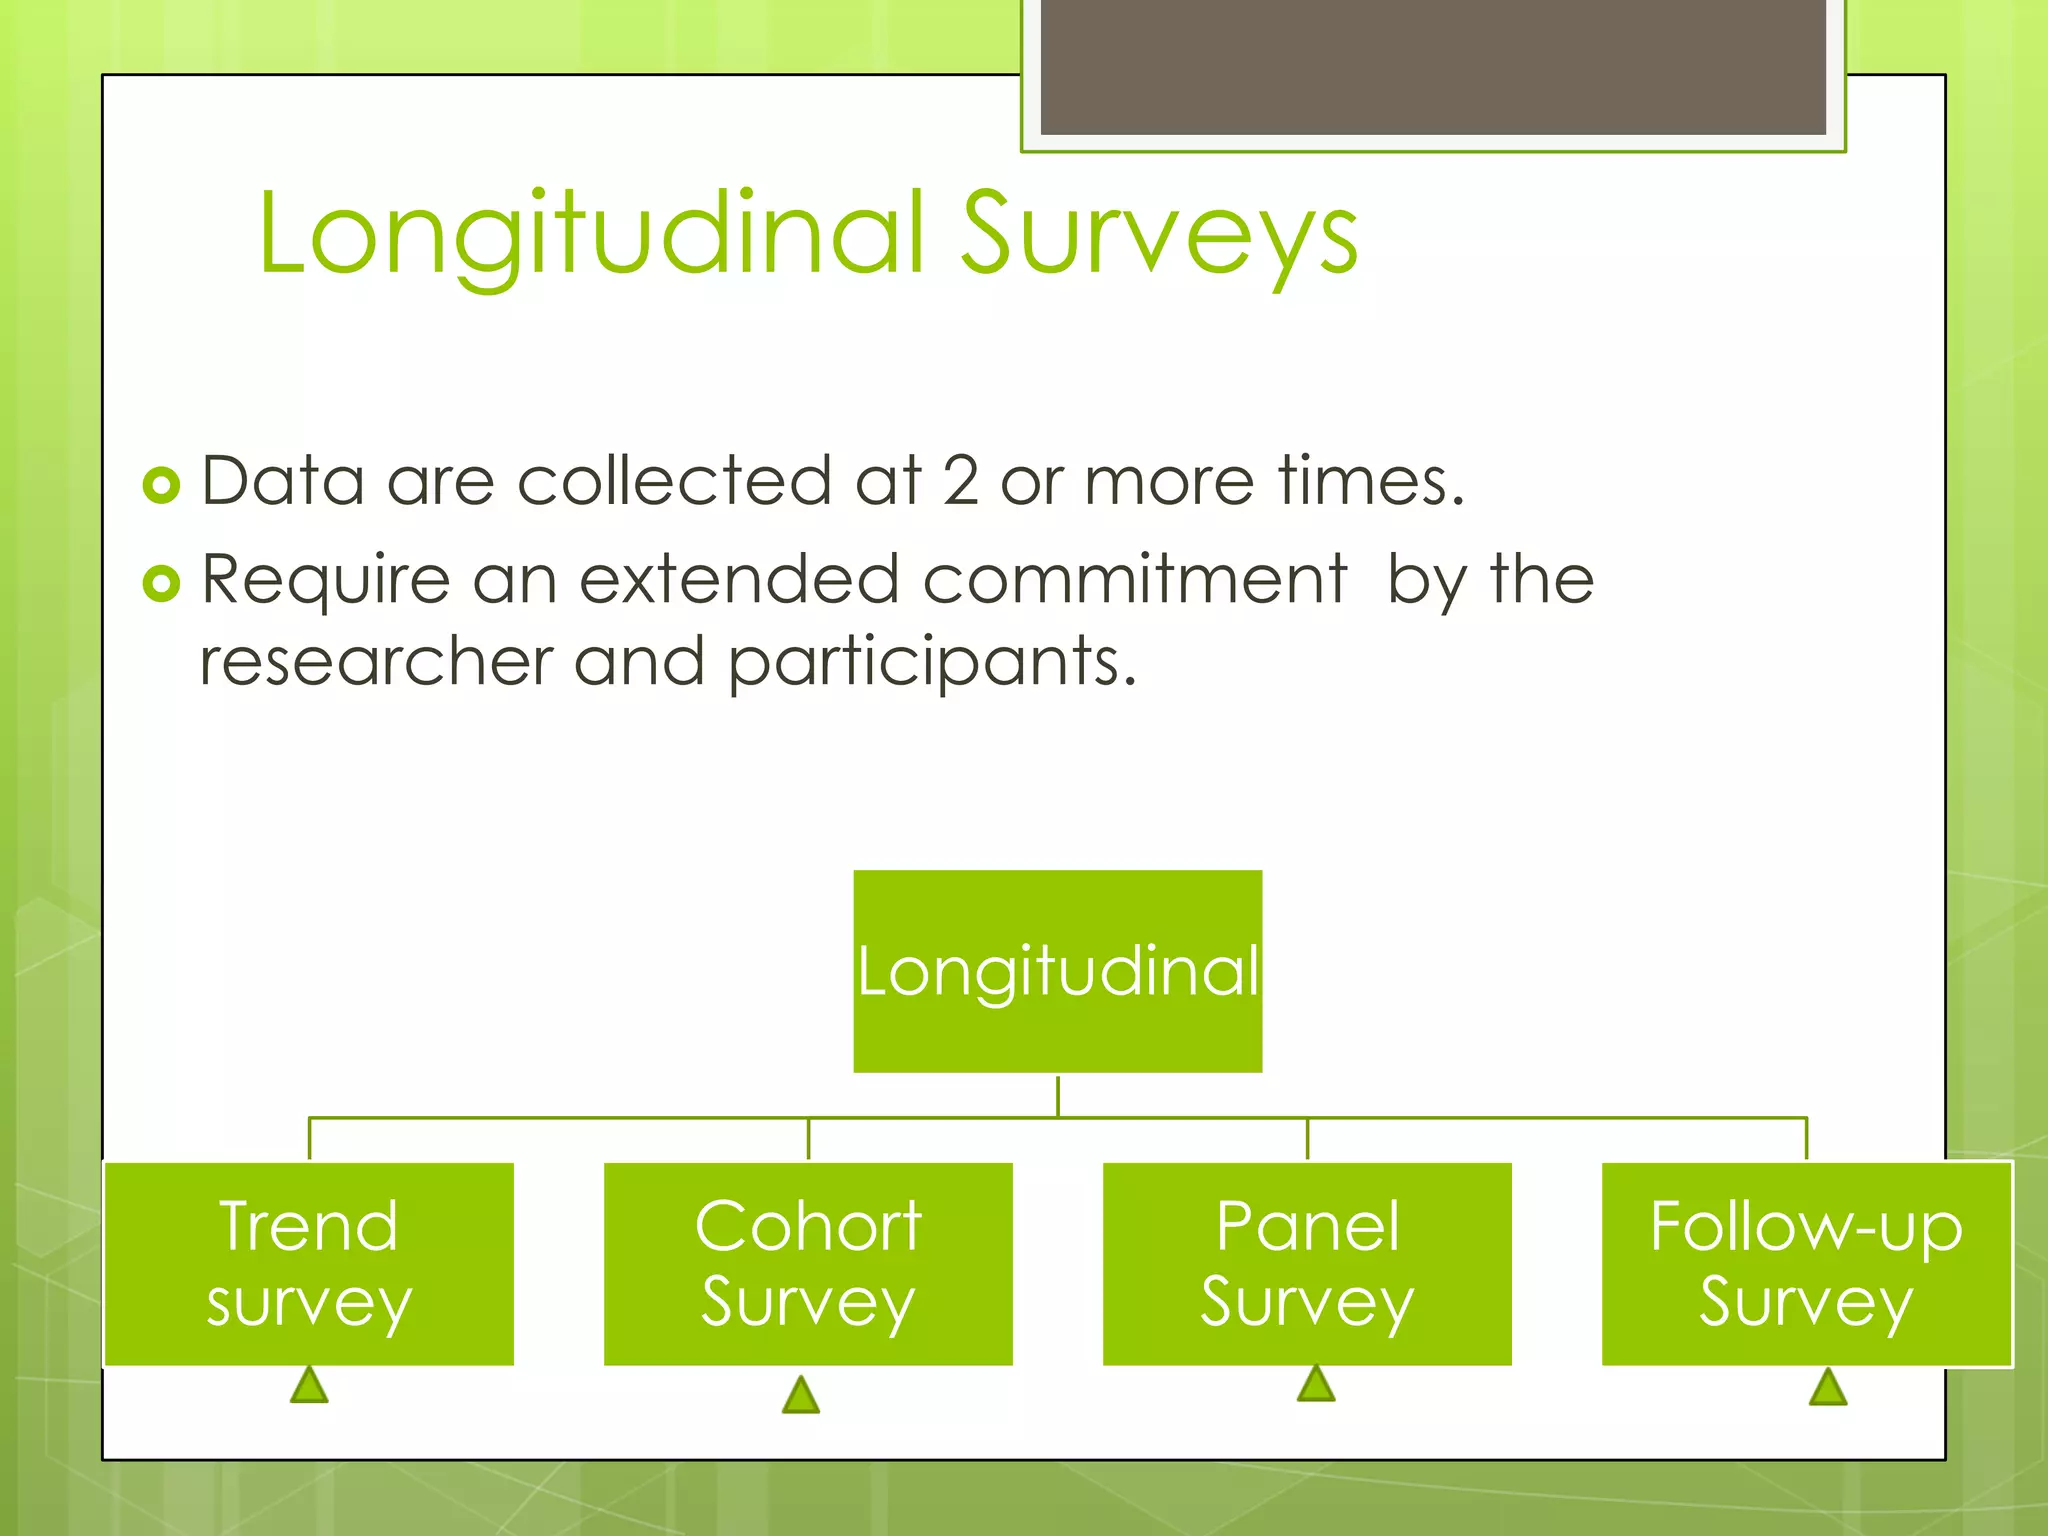
Longitudinal Surveys
Data
arecollected at 2 or more times.
Require an extended commitment by the
researcher and participants.
Longitudinal
Trend
survey
Cohort
Survey
Panel
Survey
Follow-up
Survey
8.
Trend Survey
Examines
changesover time in a
particular population defined by some
particular trait/traits.
Researcher can analyze changes in
attitudes, beliefs, behaviours within that
particular population over time.
9.
Cohort Survey
Involves
onepopulation selected at a
particular time period but multiple
samples taken and surveyed at different
points of time.
Can be different samples, but in the same
population.
10.
Panel Survey
The
sameindividuals are studies over time.
Frequent problem: lost of individuals from
the study because of relocation, name
change, lack of interest, or death.
Take long time.
11.
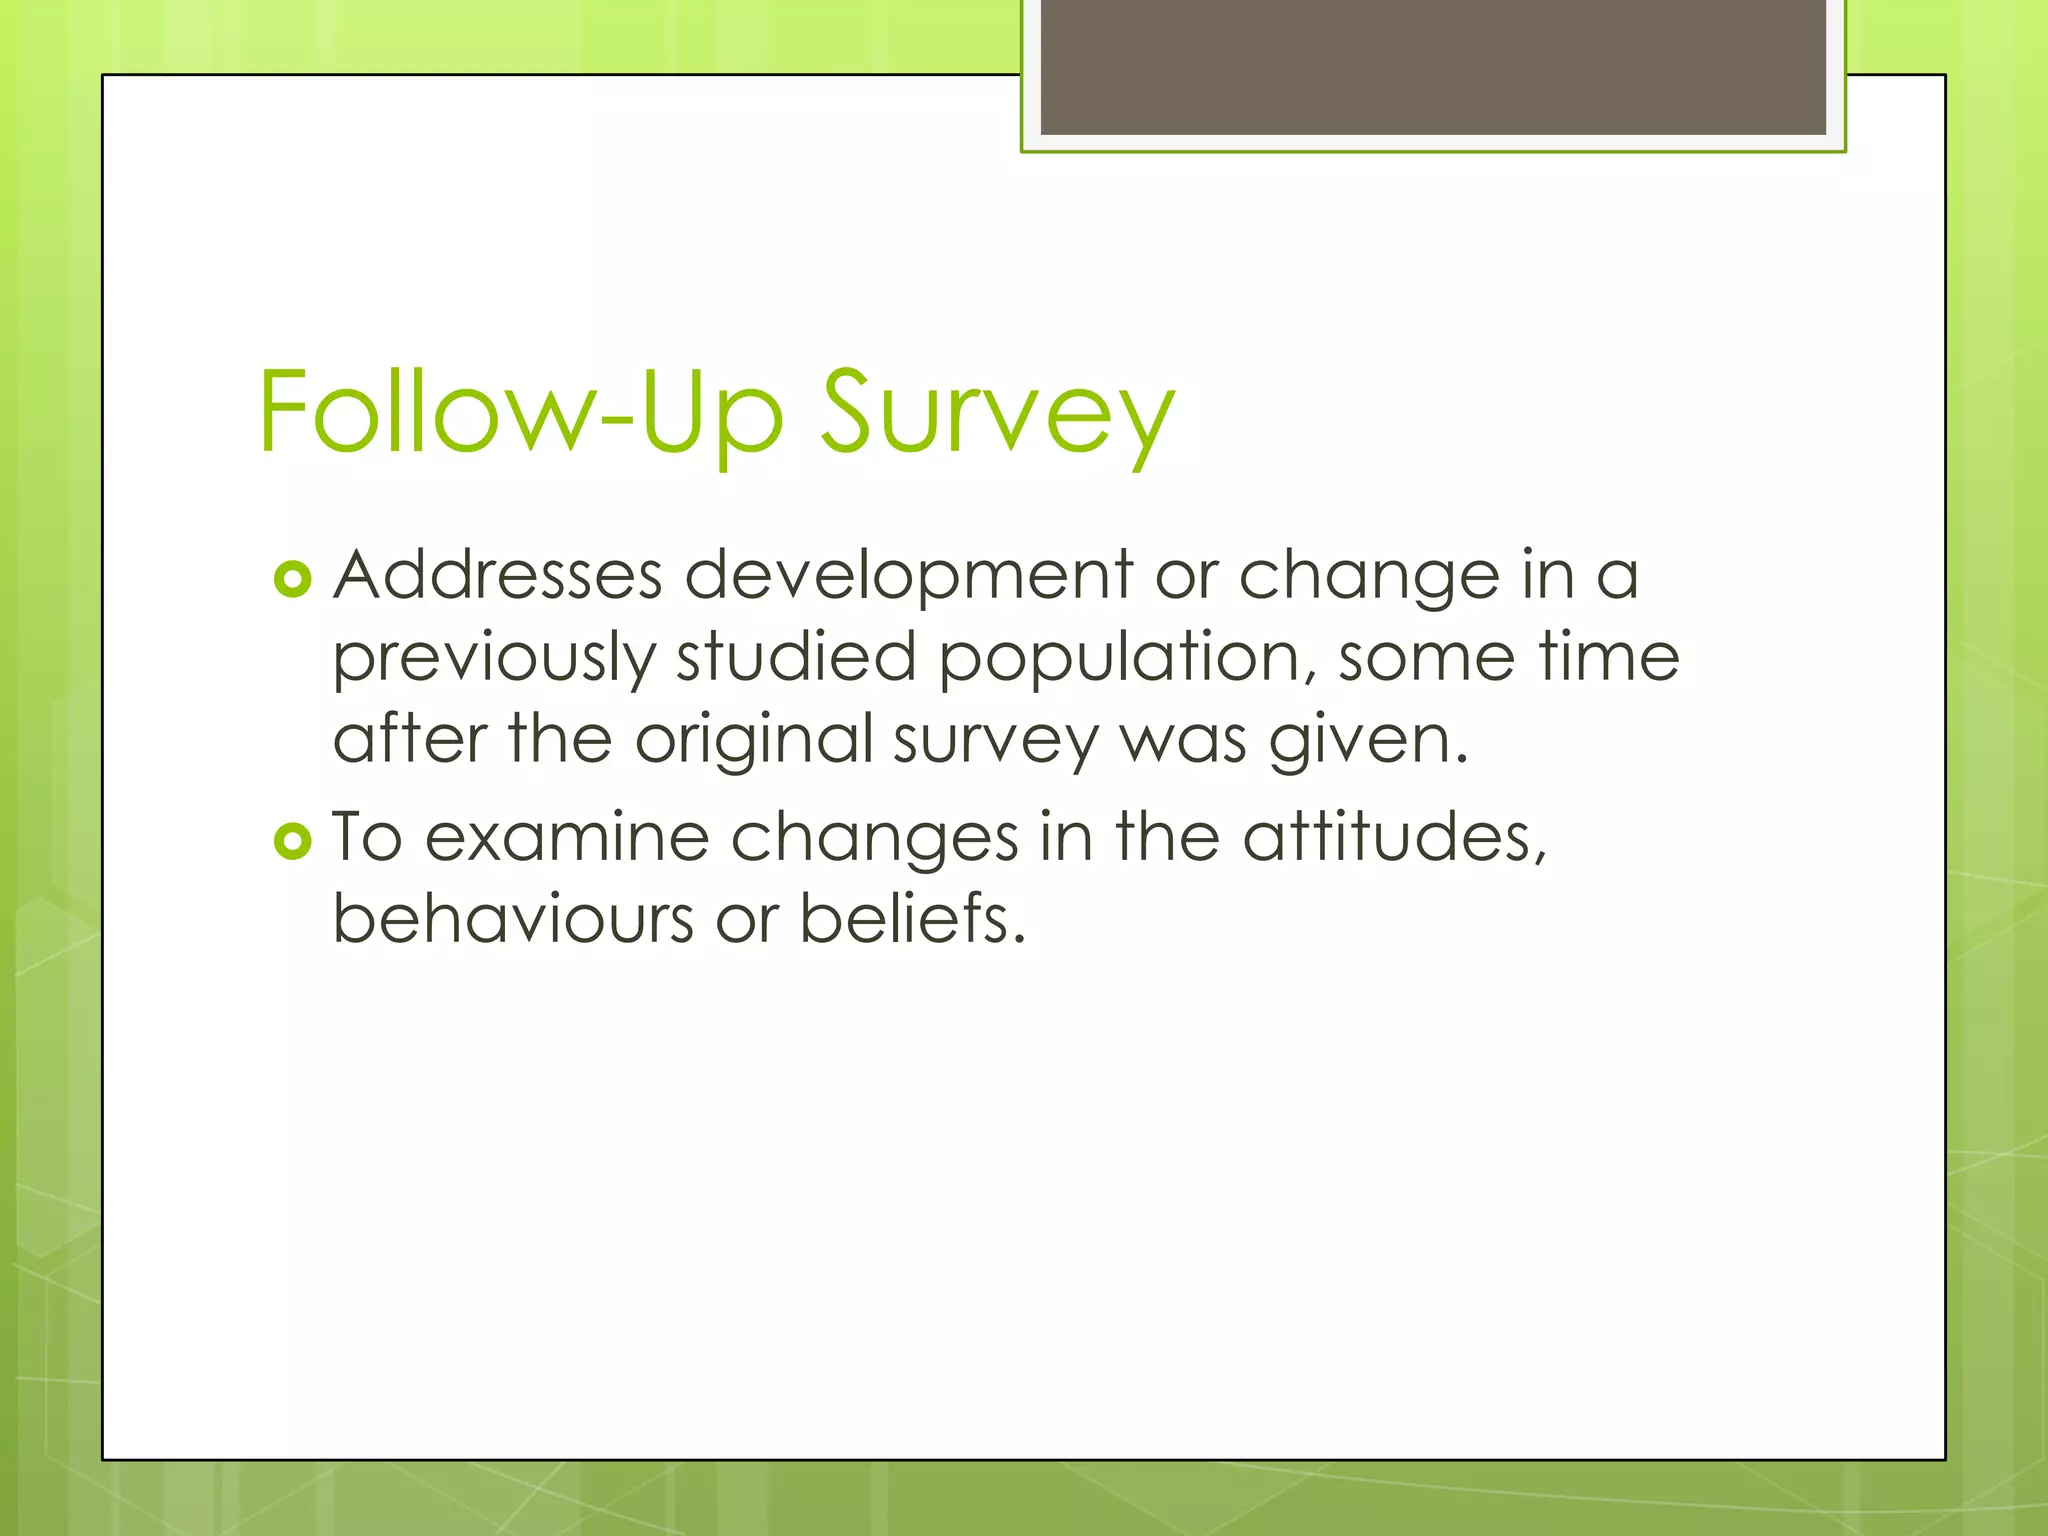
Follow-Up Survey
Addresses
developmentor change in a
previously studied population, some time
after the original survey was given.
To examine changes in the attitudes,
behaviours or beliefs.
12.
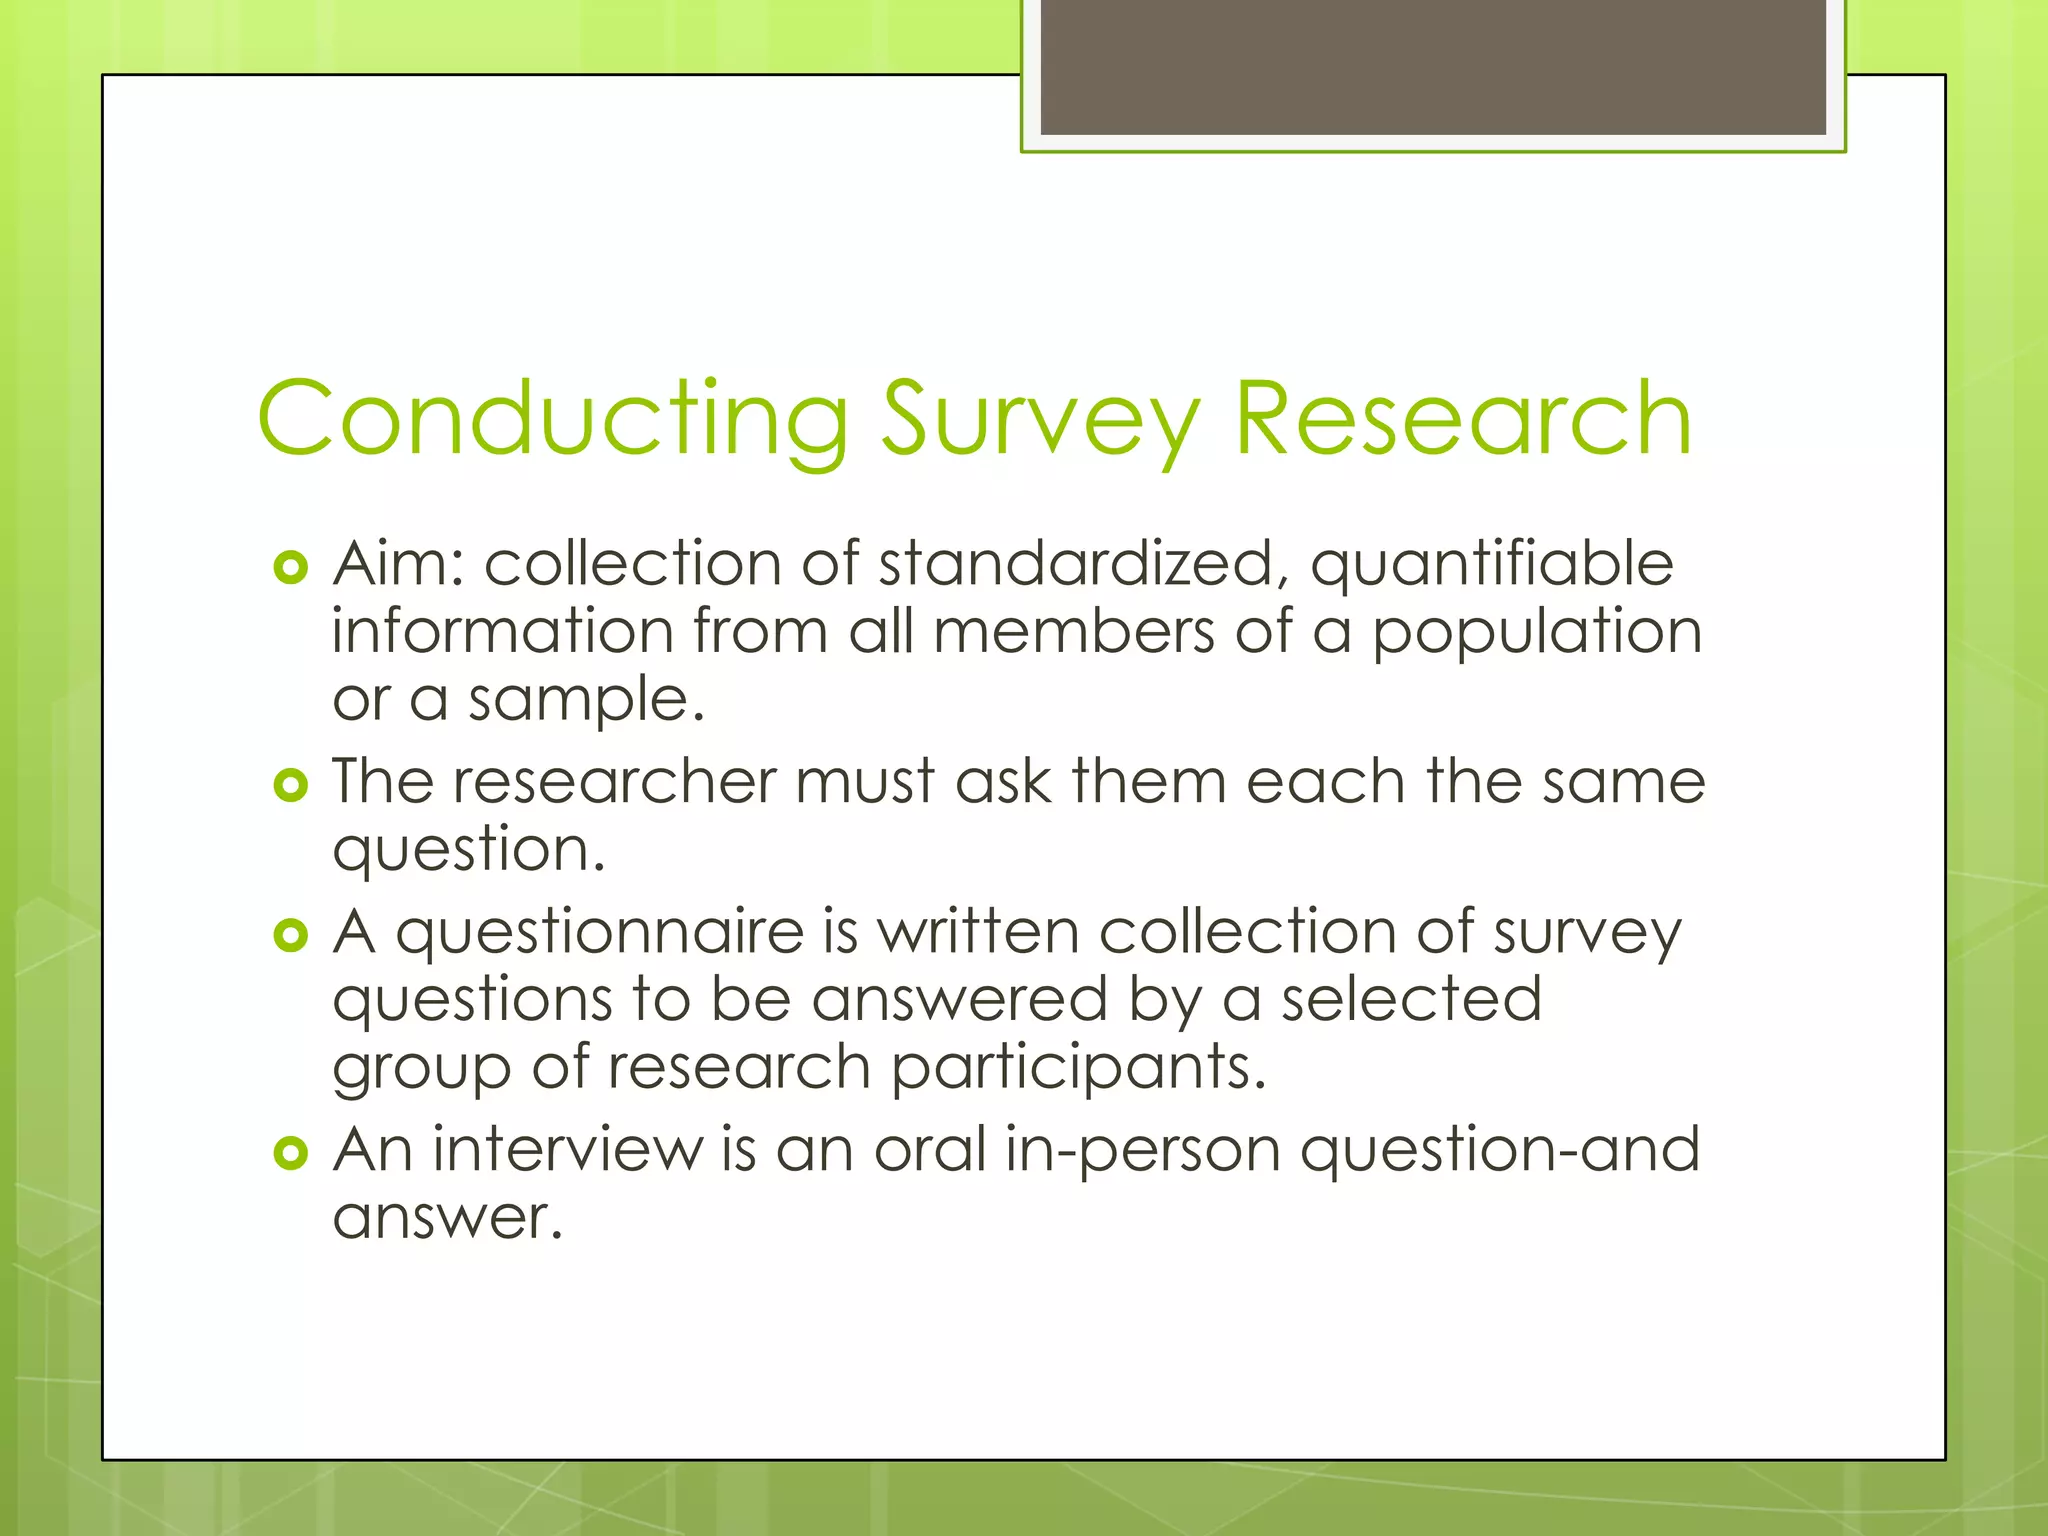
Conducting Survey Research
Aim:collection of standardized, quantifiable
information from all members of a population
or a sample.
The researcher must ask them each the same
question.
A questionnaire is written collection of survey
questions to be answered by a selected
group of research participants.
An interview is an oral in-person question-and
answer.
13.
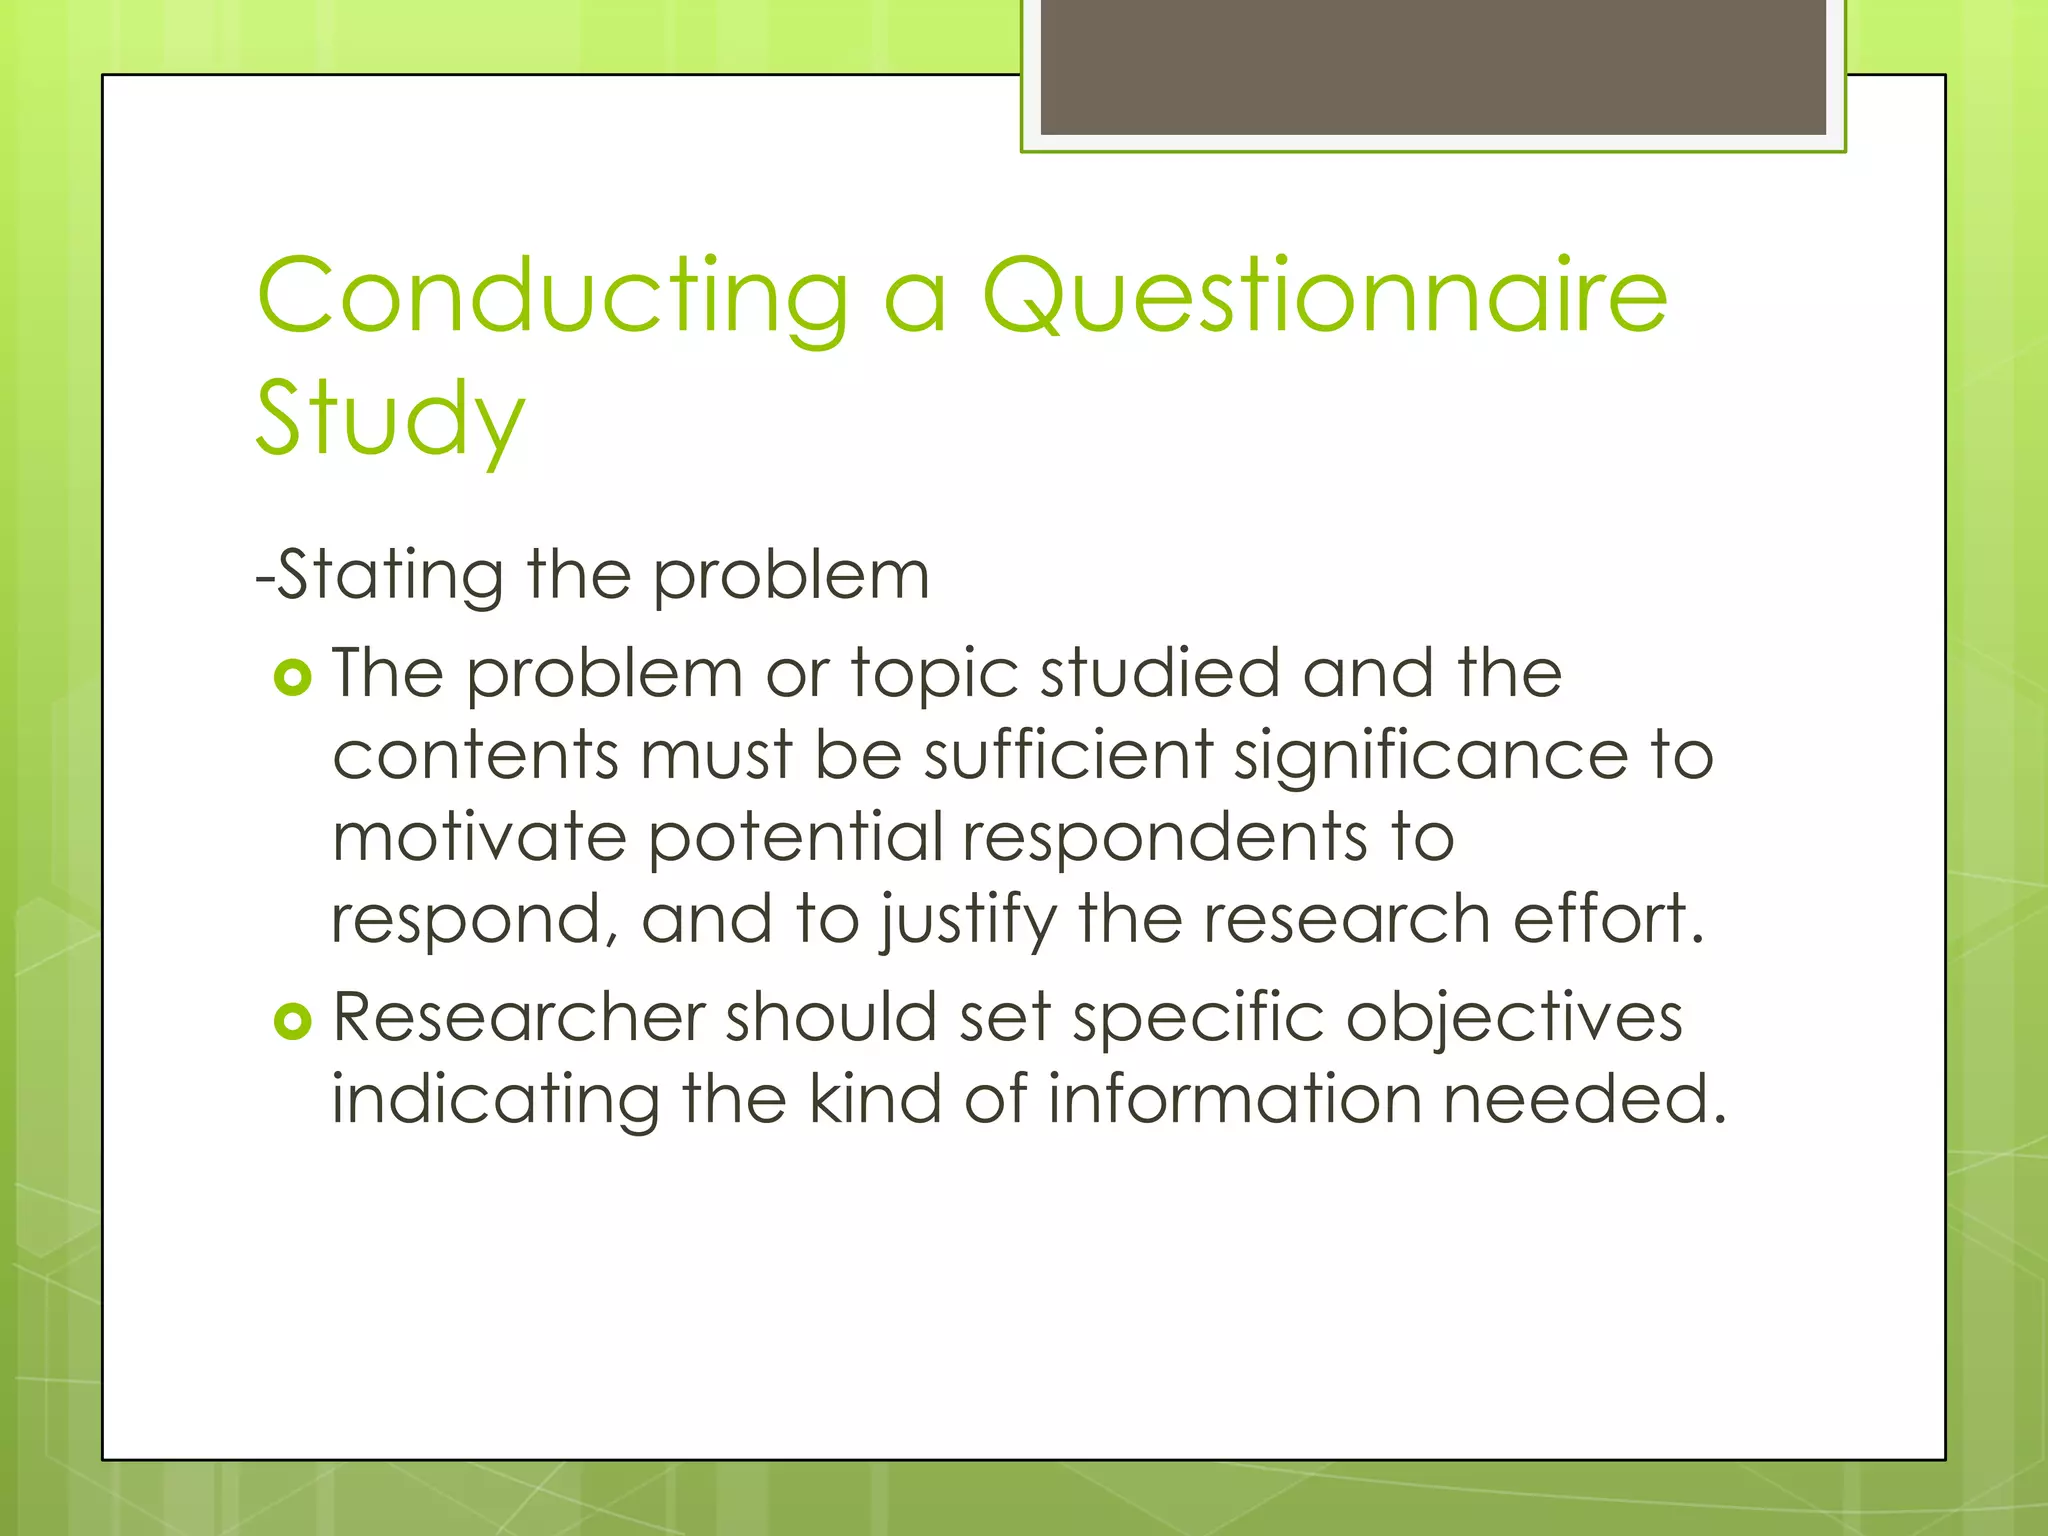
Conducting a Questionnaire
Study
-Statingthe problem
The problem or topic studied and the
contents must be sufficient significance to
motivate potential respondents to
respond, and to justify the research effort.
Researcher should set specific objectives
indicating the kind of information needed.
14.
Continued…
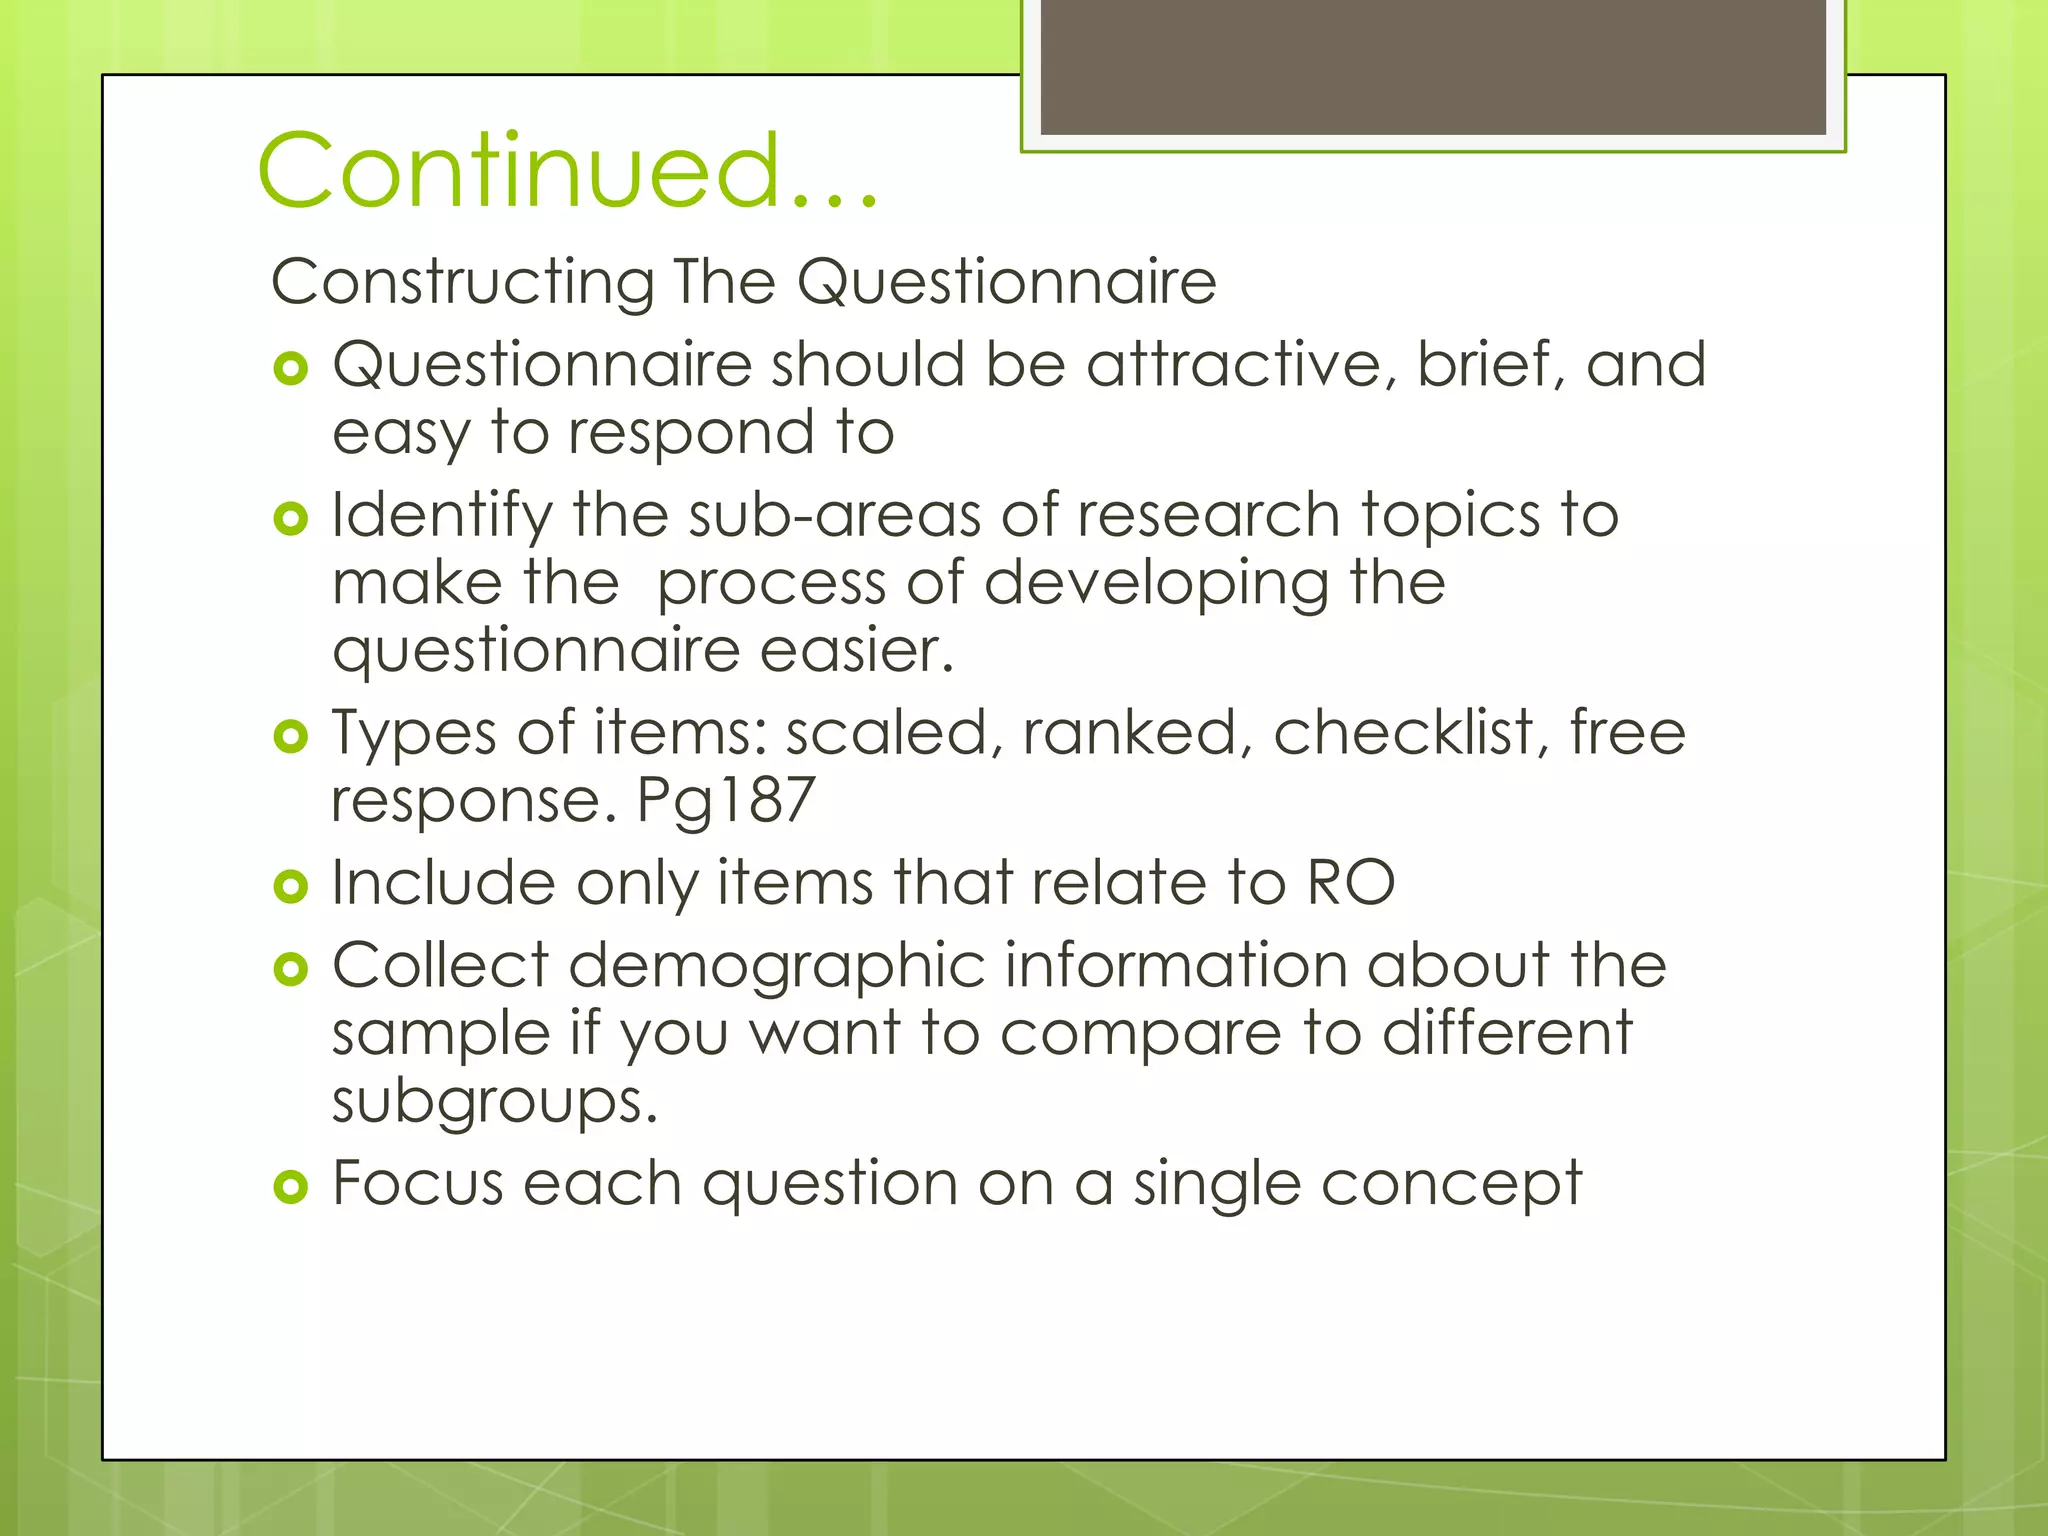
Constructing The Questionnaire
Questionnaire should be attractive, brief, and
easy to respond to
Identify the sub-areas of research topics to
make the process of developing the
questionnaire easier.
Types of items: scaled, ranked, checklist, free
response. Pg187
Include only items that relate to RO
Collect demographic information about the
sample if you want to compare to different
subgroups.
Focus each question on a single concept
15.
Continued…
-Things to consider
Define/explain ambiguous terms.
Include a point of reference to guide
respondents in answering questions.
Avoid leading questions.
Avoid sensitive questions.
Don’t ask a questions that assumes a fact
that not necessarily true.
-Pilot Test the Questionnaire
Provide information about deficiencies
and suggestion for improvement.
16.
Continued…
Choose
2 or3 individuals who are
thoughtful, critical, and similar to the
intended research participants.
-Preparing Cover Letter
When necessary.
17.
Conducting The Questionnaire
Select
participants: simple/stratified
random, cluster, systematic, nonrandom.
Distributing: mail, email, telephone.],
personal admin, interview. pg191
Conduct follow-up for reminder.
Rule of thumbs: must be more than 50%.
Dealing with nonresponse: get new
participants OR make assumptions by
generalization.
Analyzing Results: Select total sample size.
Definition
Involves collecting datato determine
whether, and to what degree, a
relationship exists between two or more
quantifiable variables.
The degree of relation is expressed as a
correlation coefficient. i.e. if two variables
are related, scores within certain range
on one variable are associated with the
other variable.
20.
Purpose
To determine relationsamong variables
(i.e. relationship study) or to use these
relations to make predictions (i.e.
prediction study)
To determine various types of validity and
reliability.
21.
Problem Selection
Variables tobe correlated should be
selected on the basis of some rationale. It
should be a logical one.
“Treasure hunts”- the researcher
correlates all sorts of variables to see what
turns up are strongly discourage (cause
inefficiency and findings difficult to
interpret).
Design and Procedure
Scoresfor two (or more) variables of
interest are obtained for each member of
the sample, and the paired scores are
then correlated.
The result is expressed as a correlation
coefficient that indicates the degree of
relation between the two variables.
24.
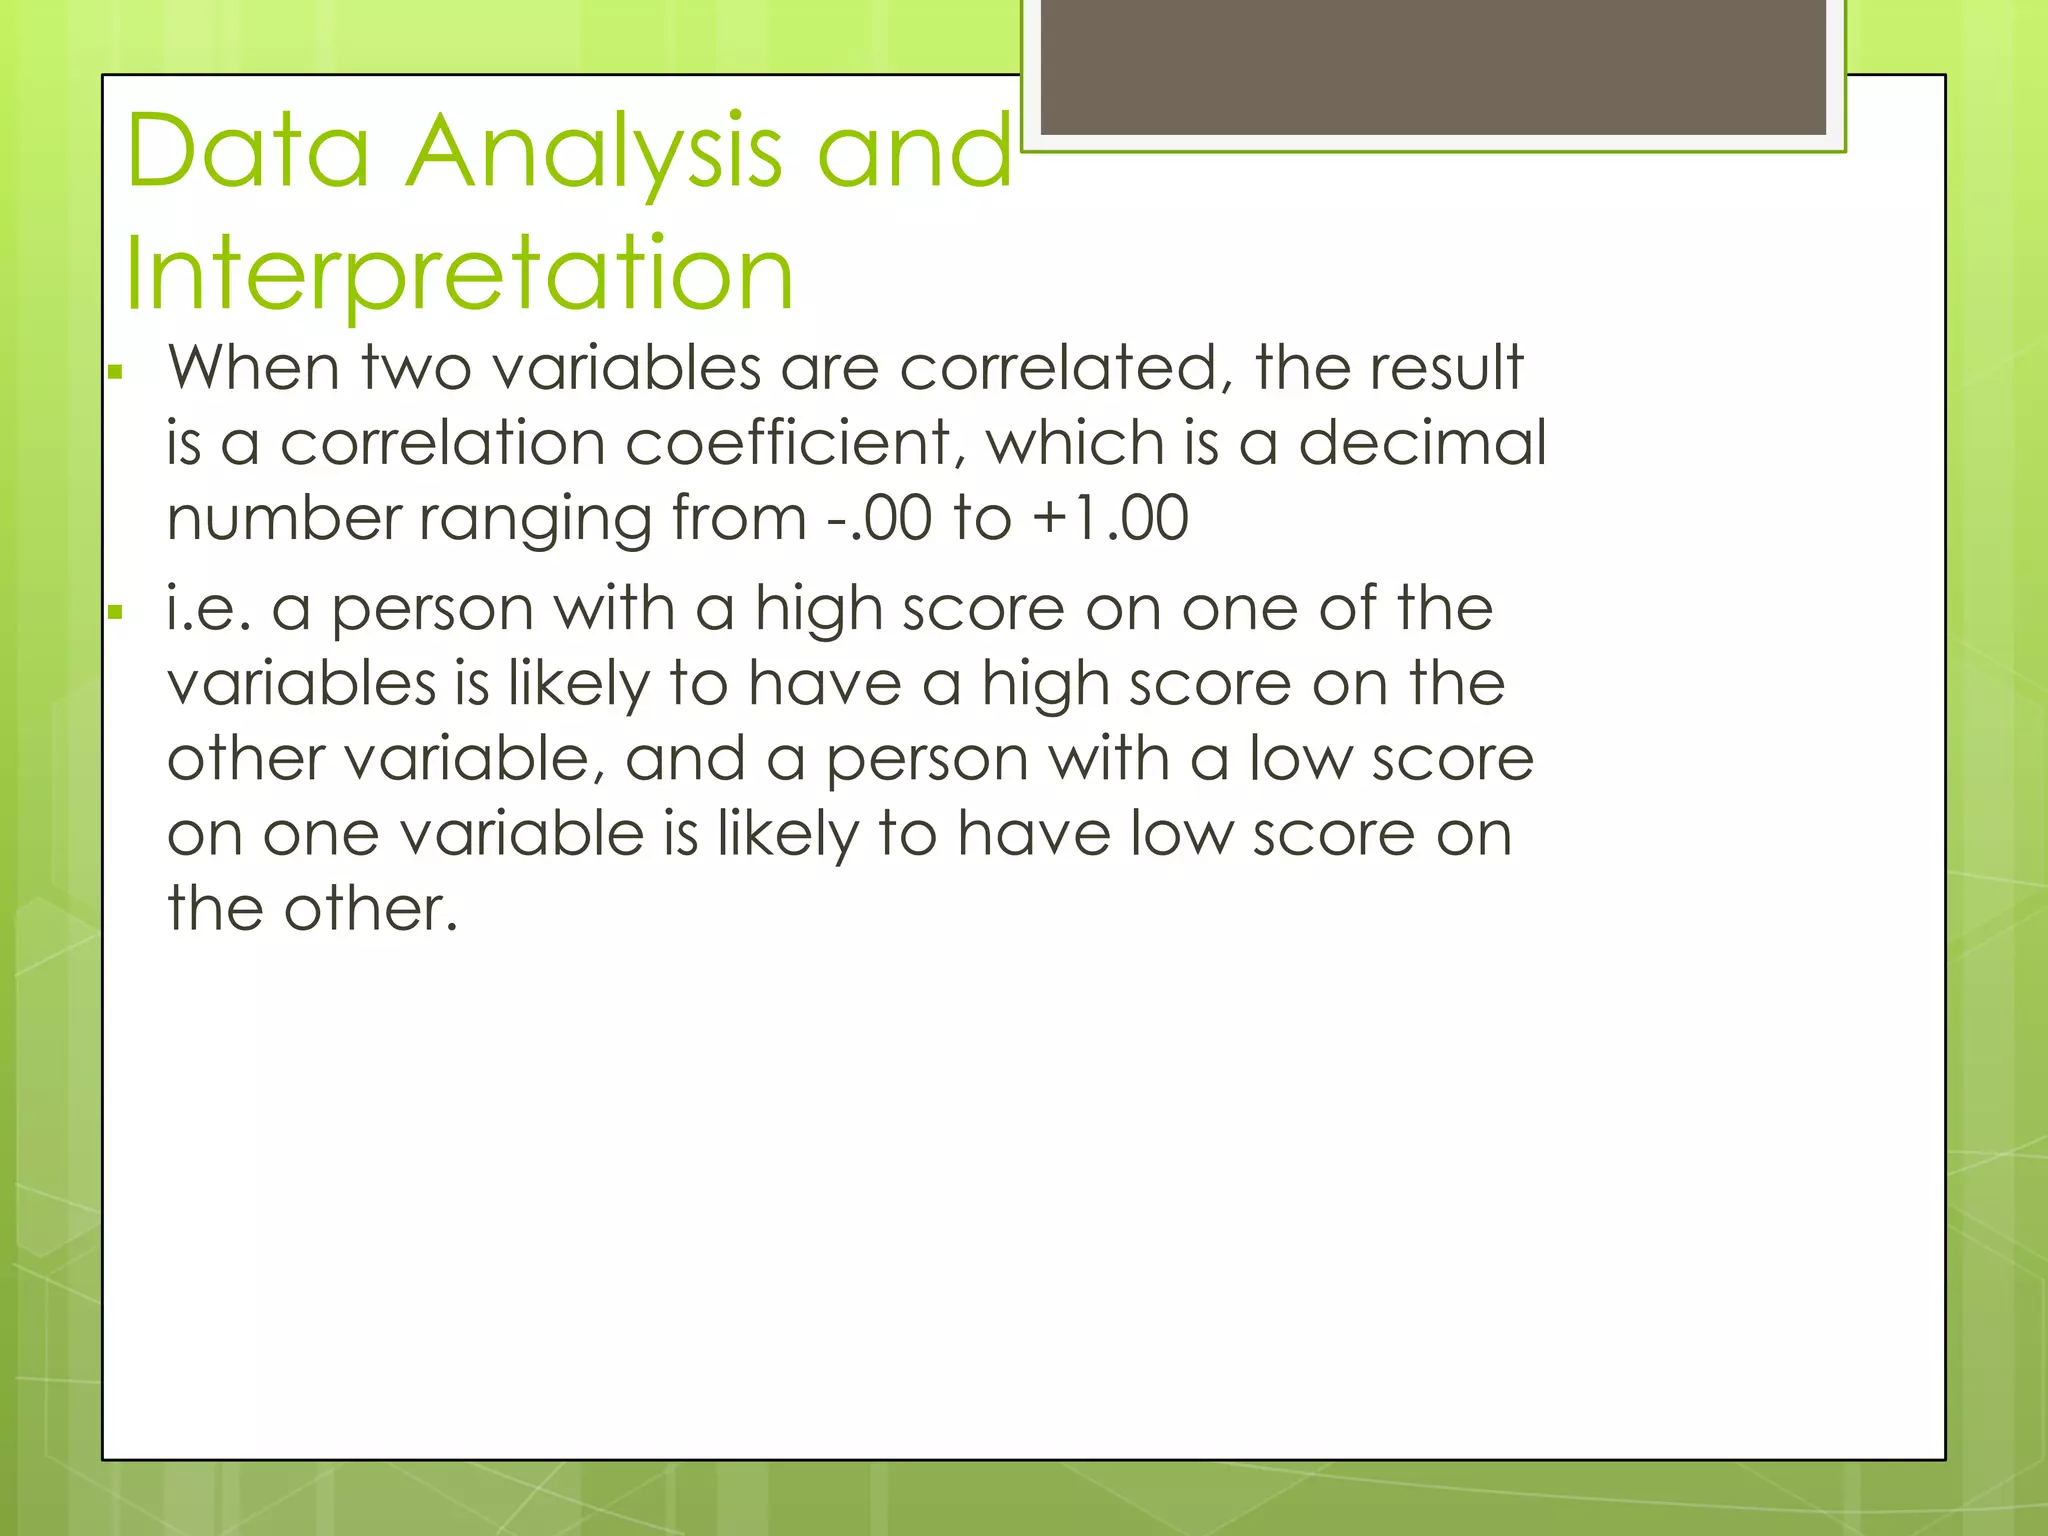
Data Analysis and
Interpretation
Whentwo variables are correlated, the result
is a correlation coefficient, which is a decimal
number ranging from -.00 to +1.00
i.e. a person with a high score on one of the
variables is likely to have a high score on the
other variable, and a person with a low score
on one variable is likely to have low score on
the other.
25.
Relationship Studies
Is when:a researcher attempts to gain insight
into variables or factors that are related to a
complex variables (e.g. academic
achievement, motivation, and self concept)
26.
Purpose
1.
2.
They help toidentify related variables suitable
for subsequent examination in causalcomparative and experimental studies.
Relationship study provide information about
the variables to control for in causalcomparative and experimental studies.
27.
PREDICTION STUDIES
o
If twovariables are highly related, scores on one
can be used to predict scores on the other.
o
The variable used to predict is called predictor. E.g
: high school grades or certification exam.
o
The variable is predicted is a complex variable
called the criterion. E.g : college grades or
principals’ evaluations.
o
Prediction study is an attempt to determine which
of a number of variables are most highly related to
the criterion variable.
o
Are conducted to facilitate decision making
about individuals.
28.
o
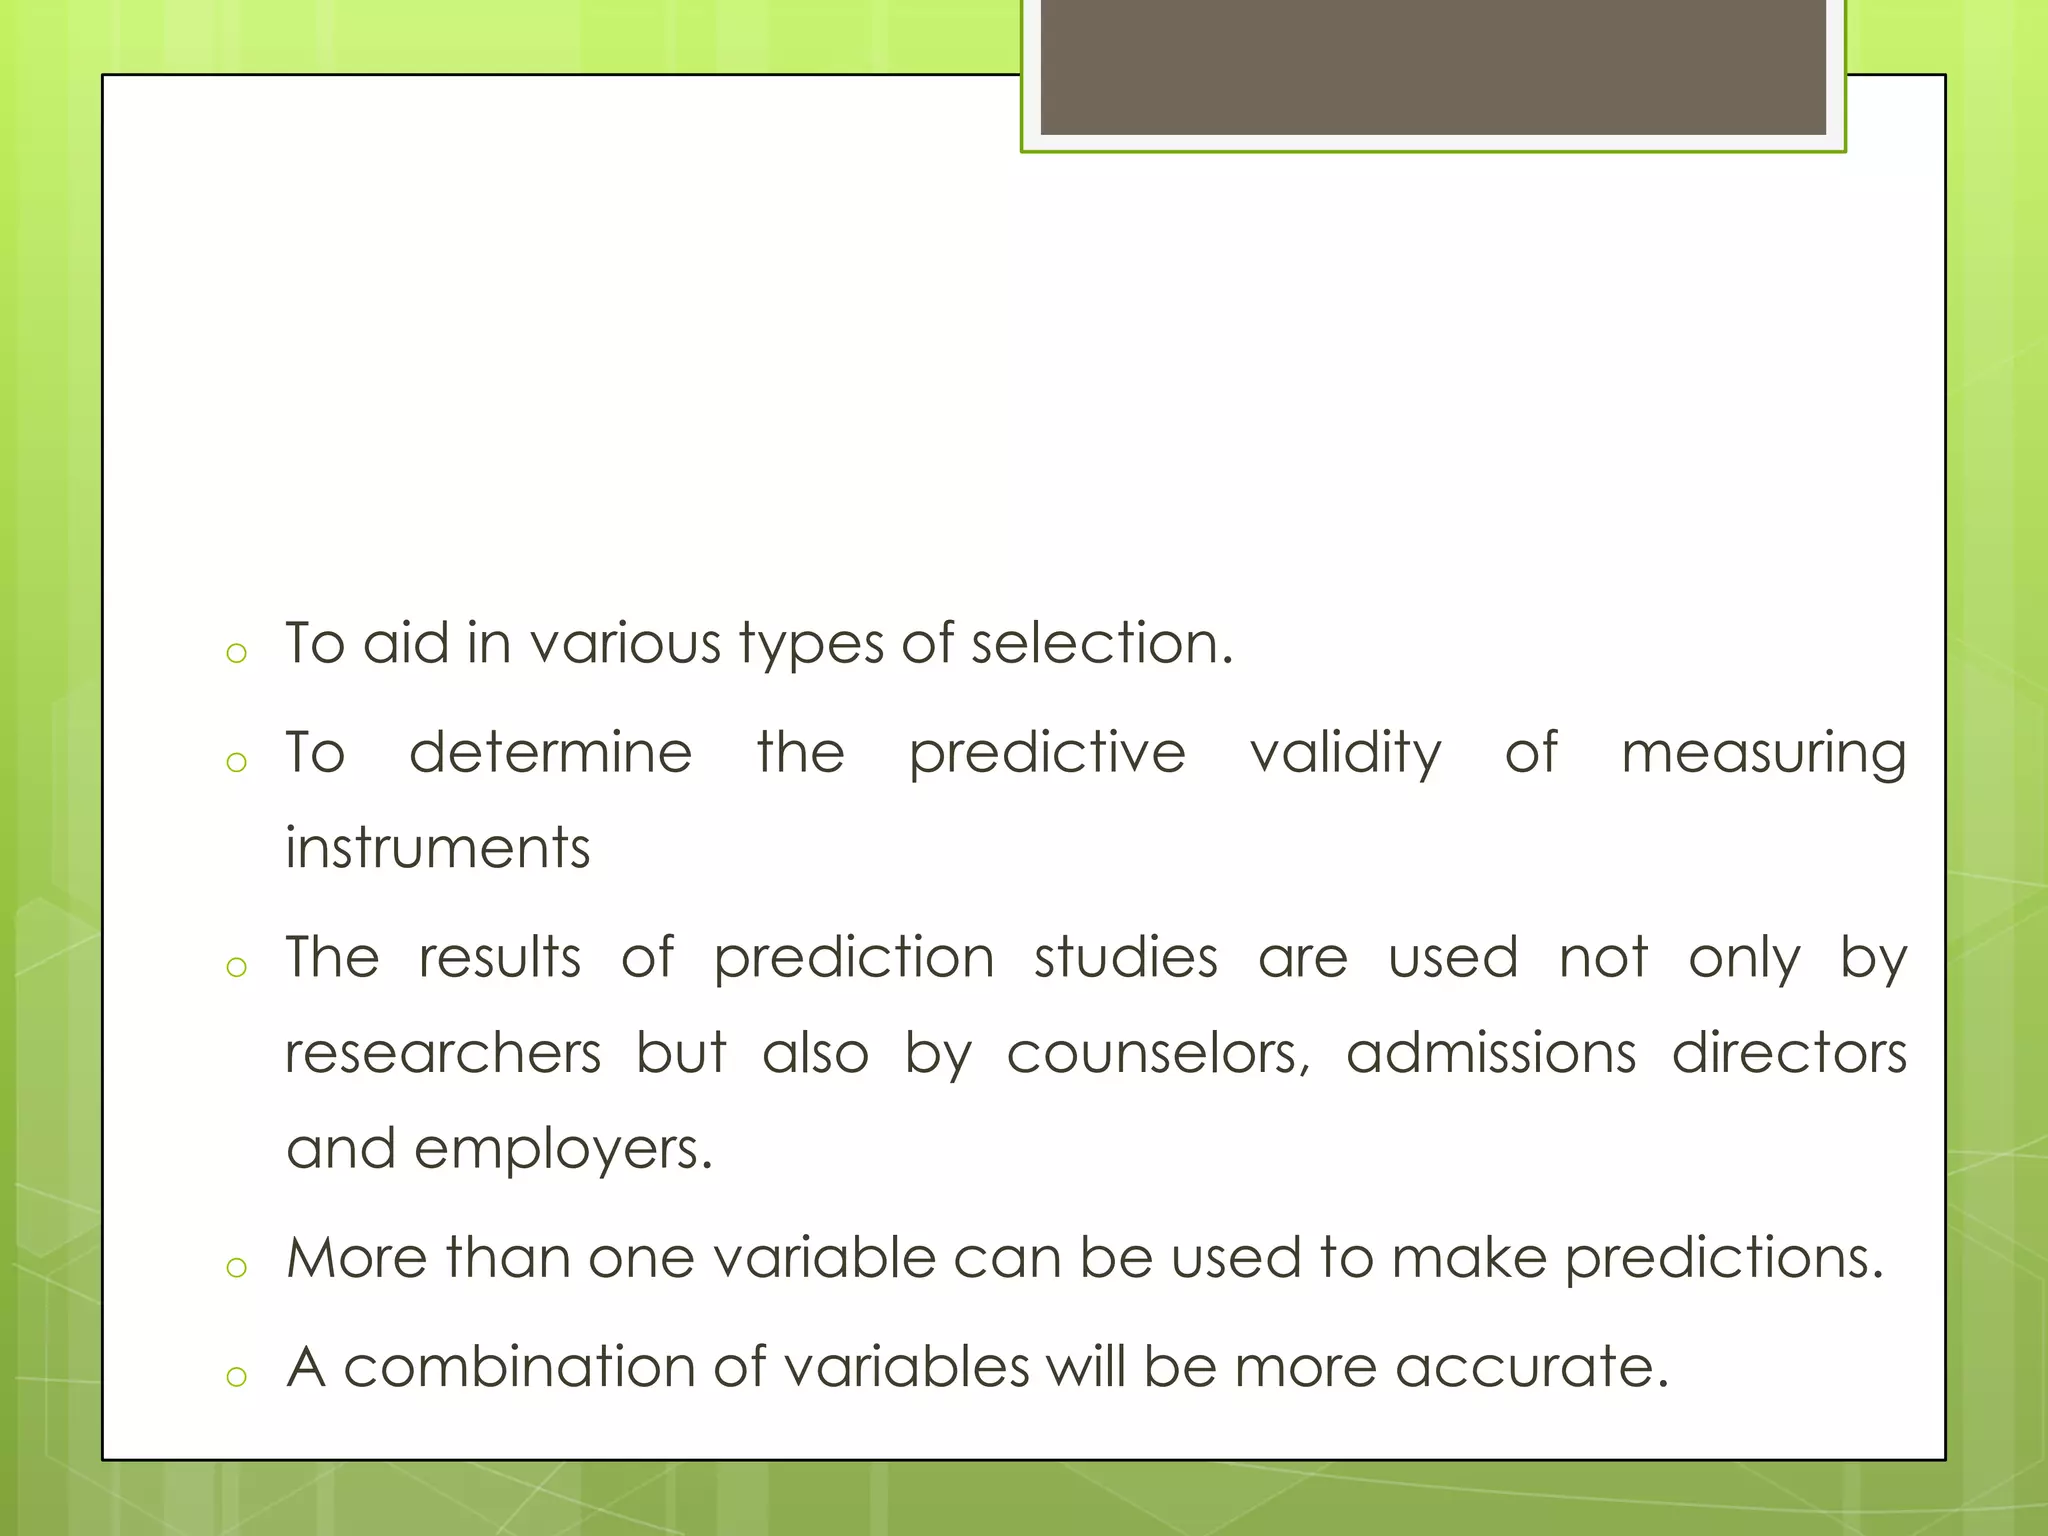
To aid invarious types of selection.
o
To
determine
the
predictive
validity
of
measuring
instruments
o
The results of prediction studies are used not only by
researchers but also by counselors, admissions directors
and employers.
o
More than one variable can be used to make predictions.
o
A combination of variables will be more accurate.
29.
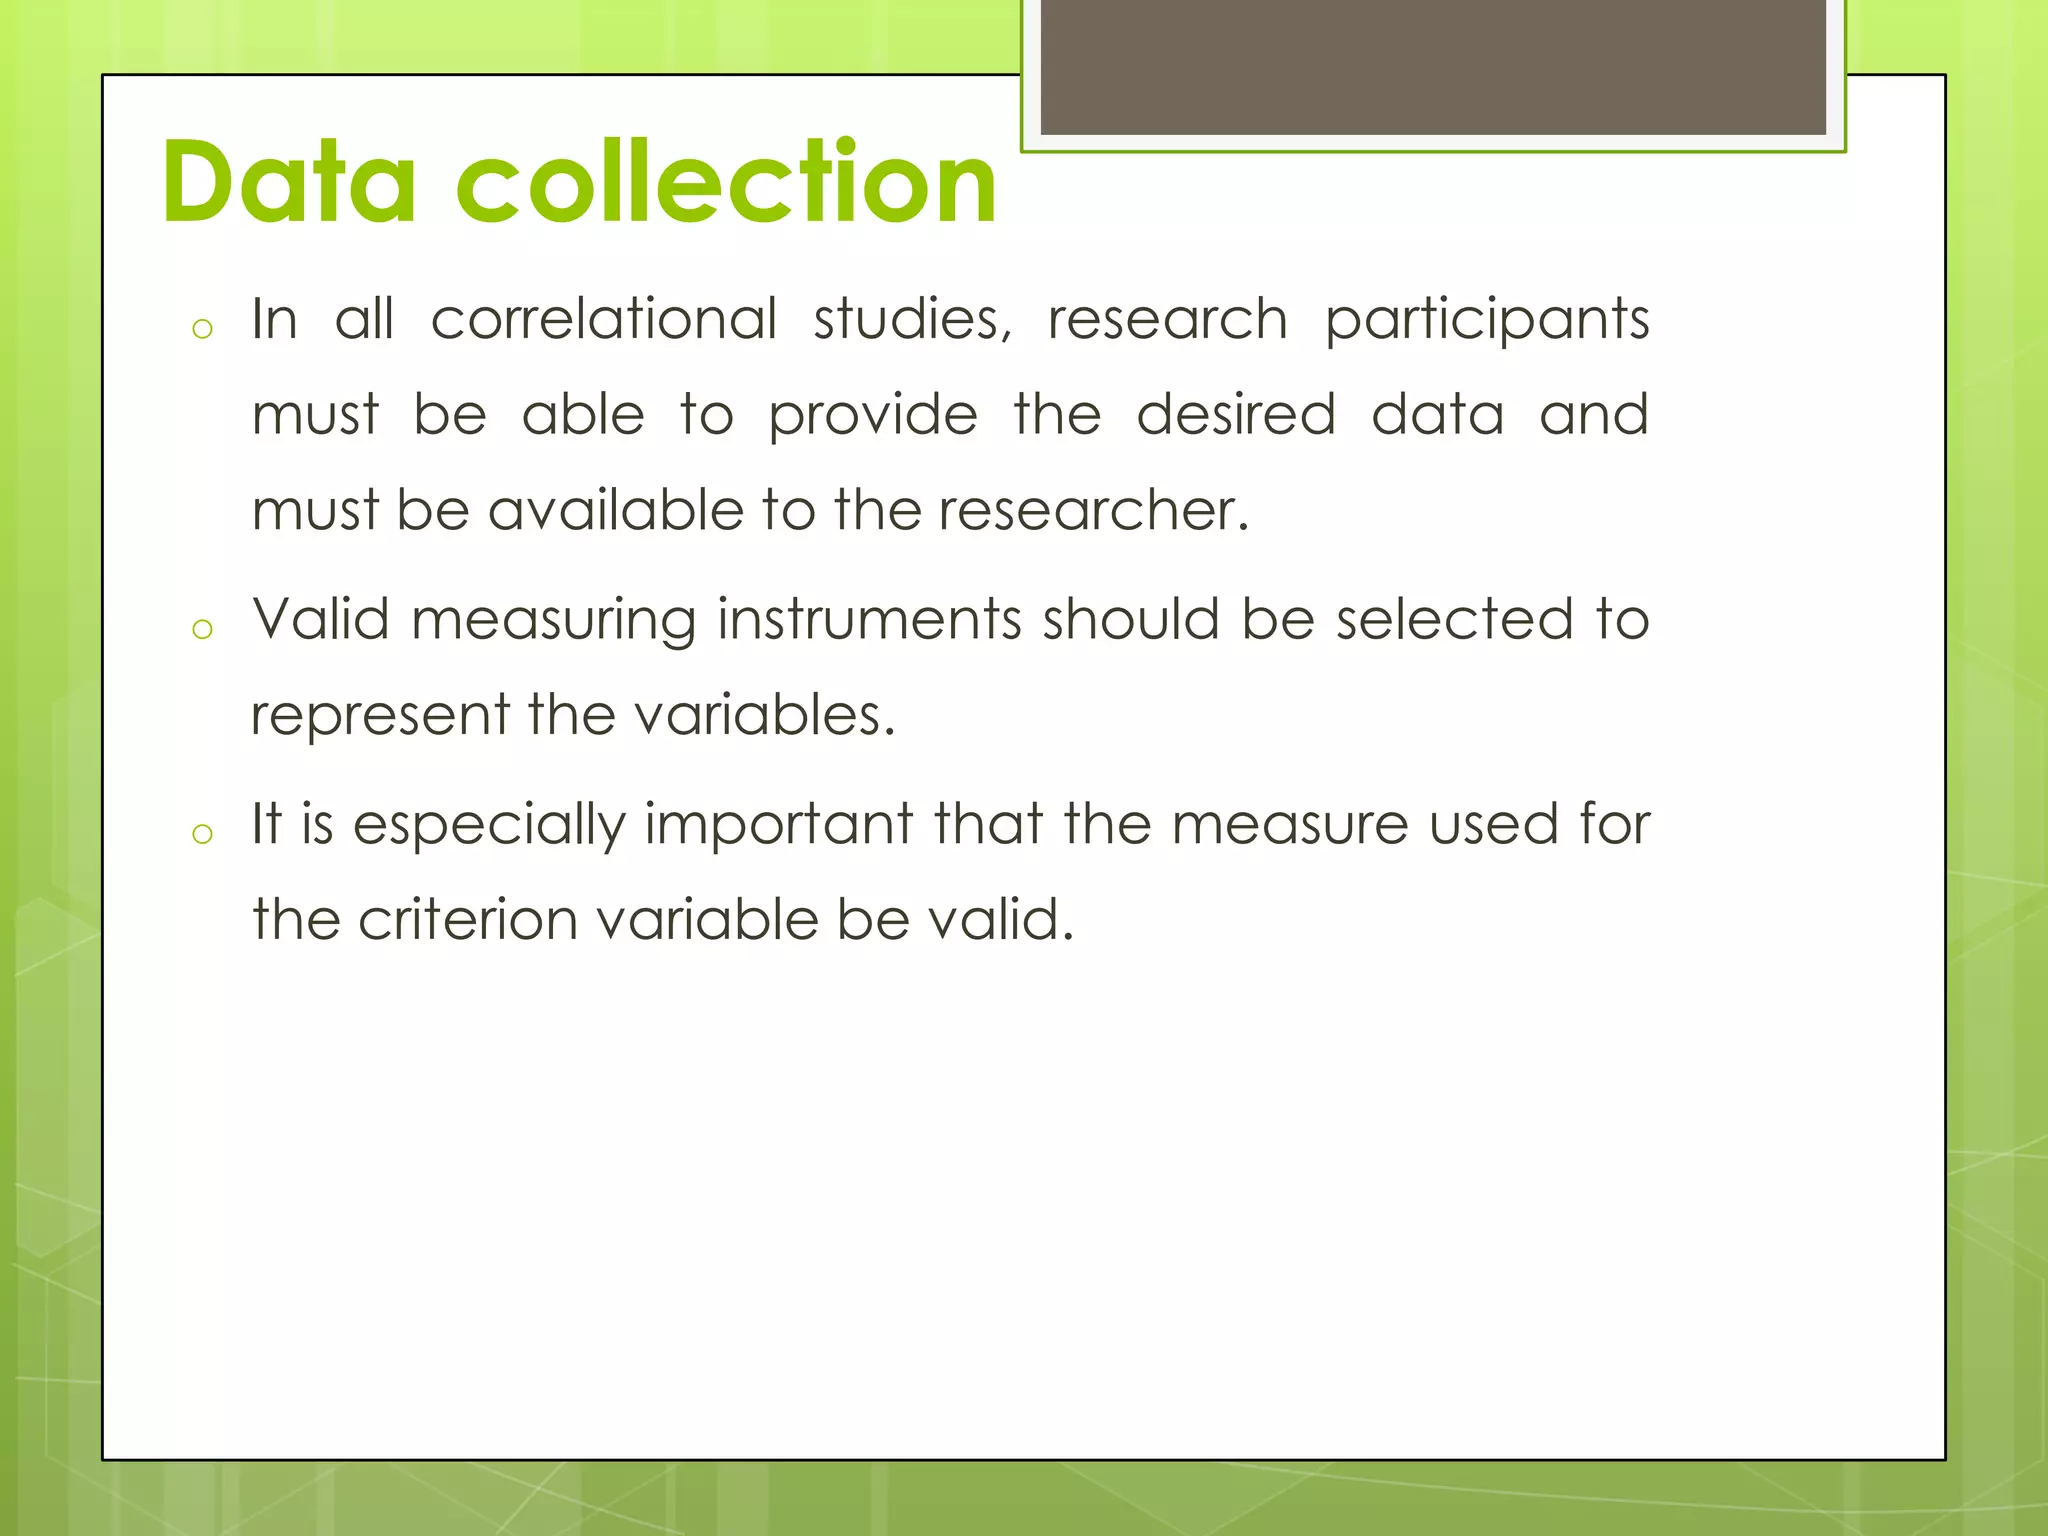
Data collection
o
In allcorrelational studies, research participants
must be able to provide the desired data and
must be available to the researcher.
o
Valid measuring instruments should be selected to
represent the variables.
o
It is especially important that the measure used for
the criterion variable be valid.
30.
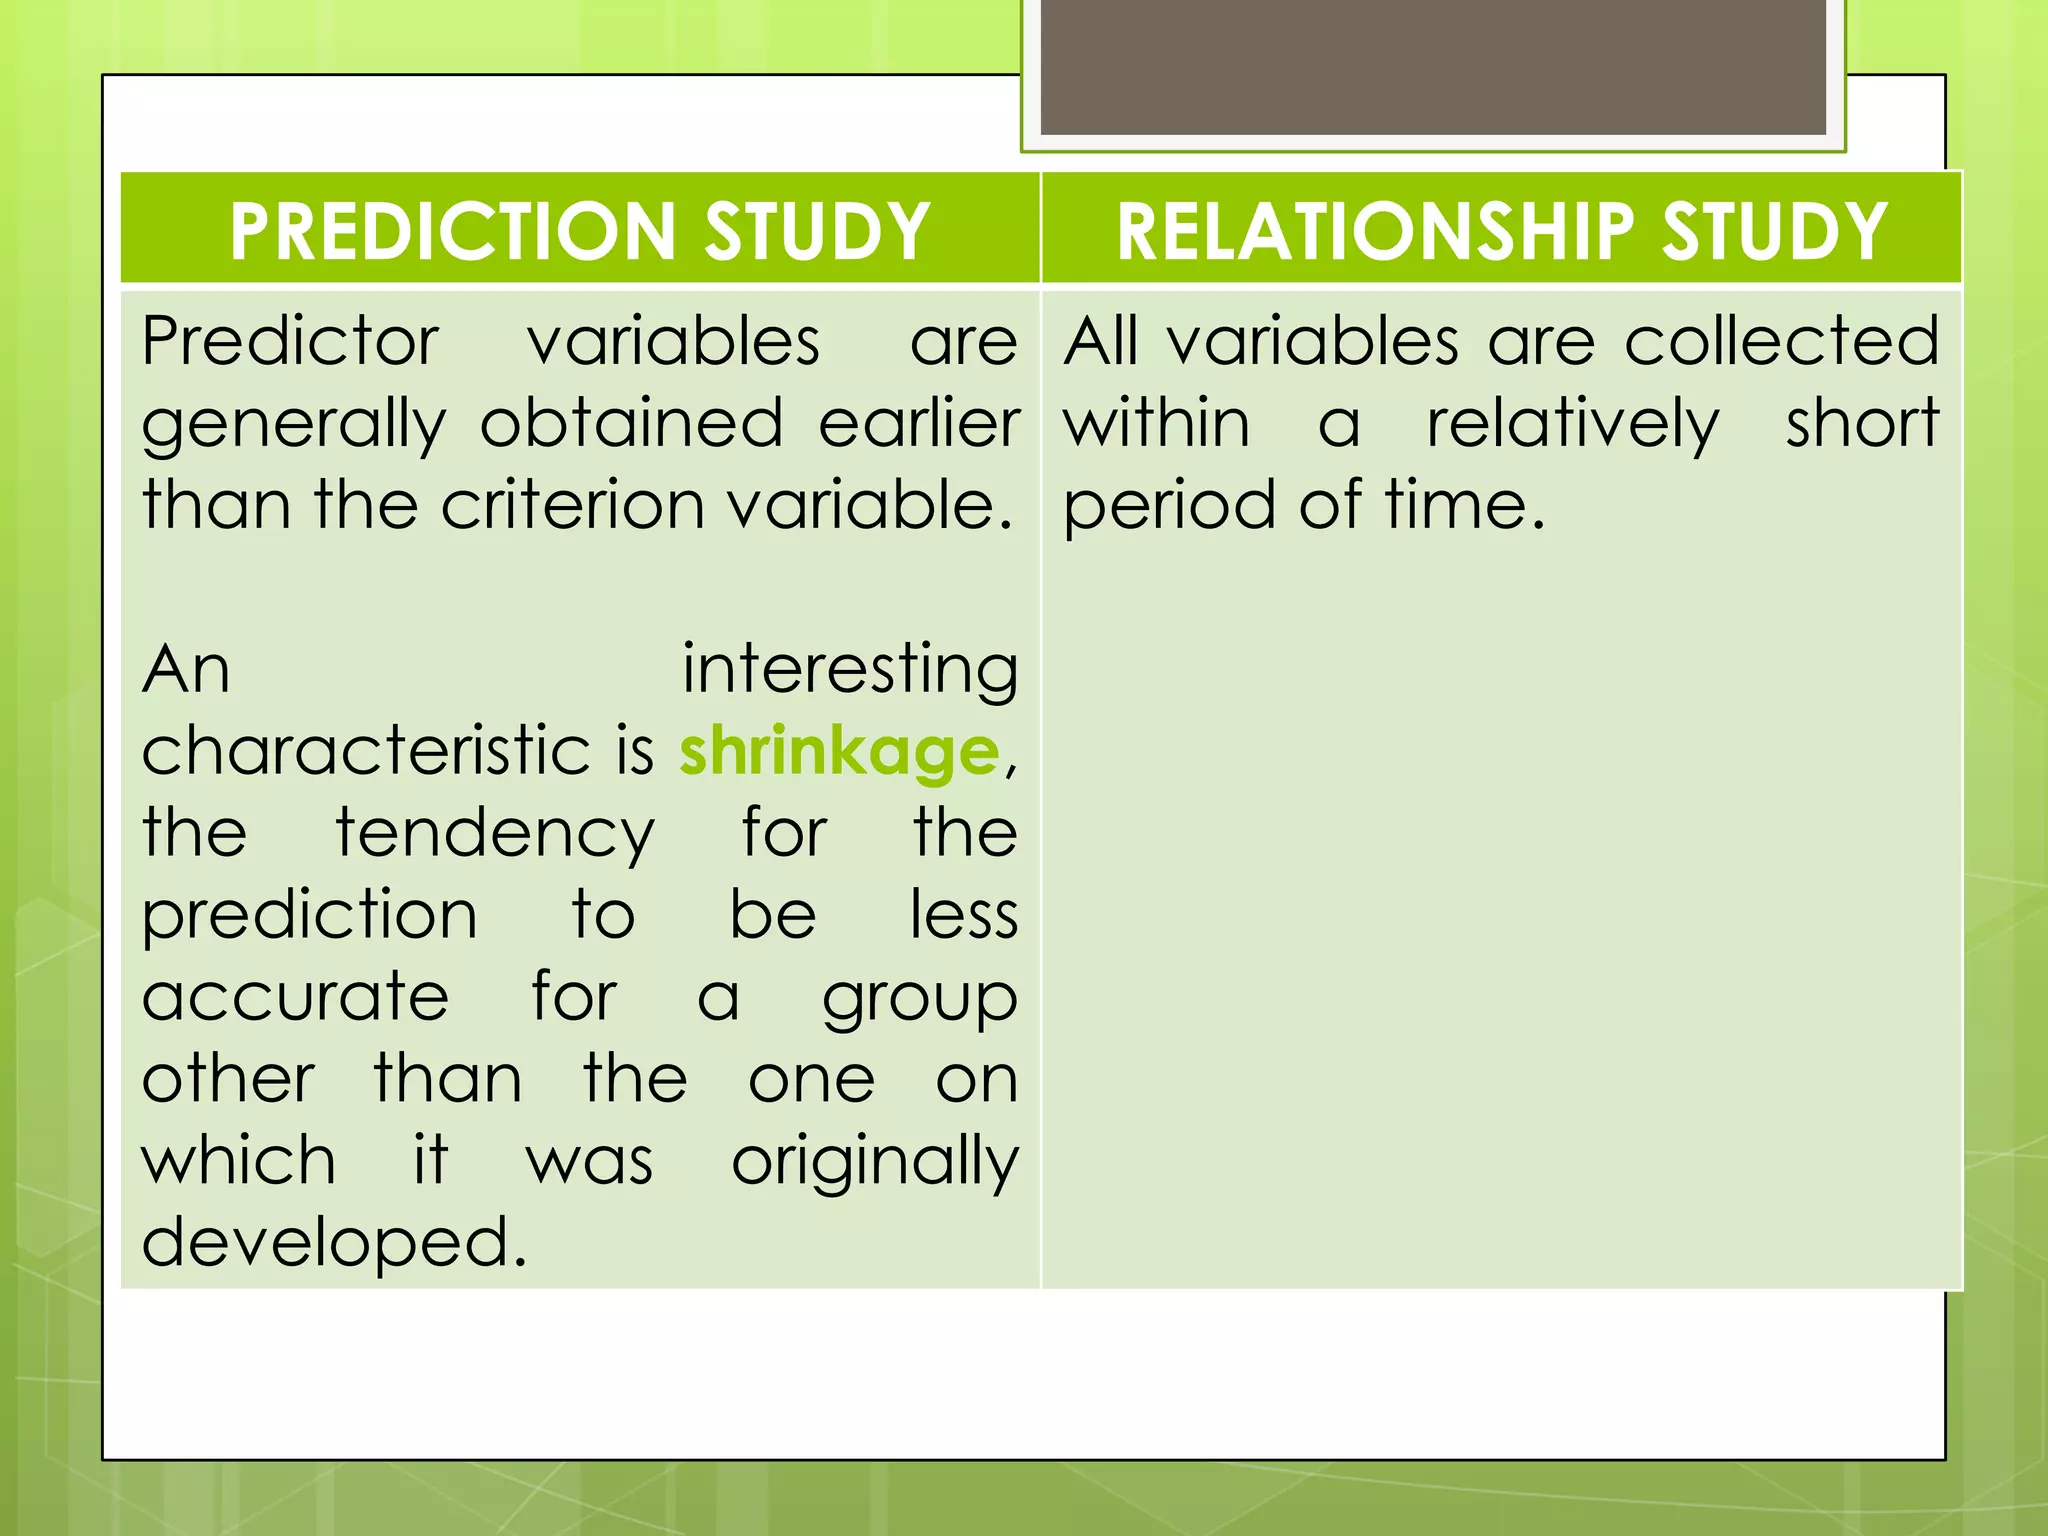
PREDICTION STUDY
RELATIONSHIP STUDY
Predictorvariables are All variables are collected
generally obtained earlier within a relatively short
than the criterion variable. period of time.
An
interesting
characteristic is shrinkage,
the tendency for the
prediction to be less
accurate for a group
other than the one on
which it was originally
developed.
31.
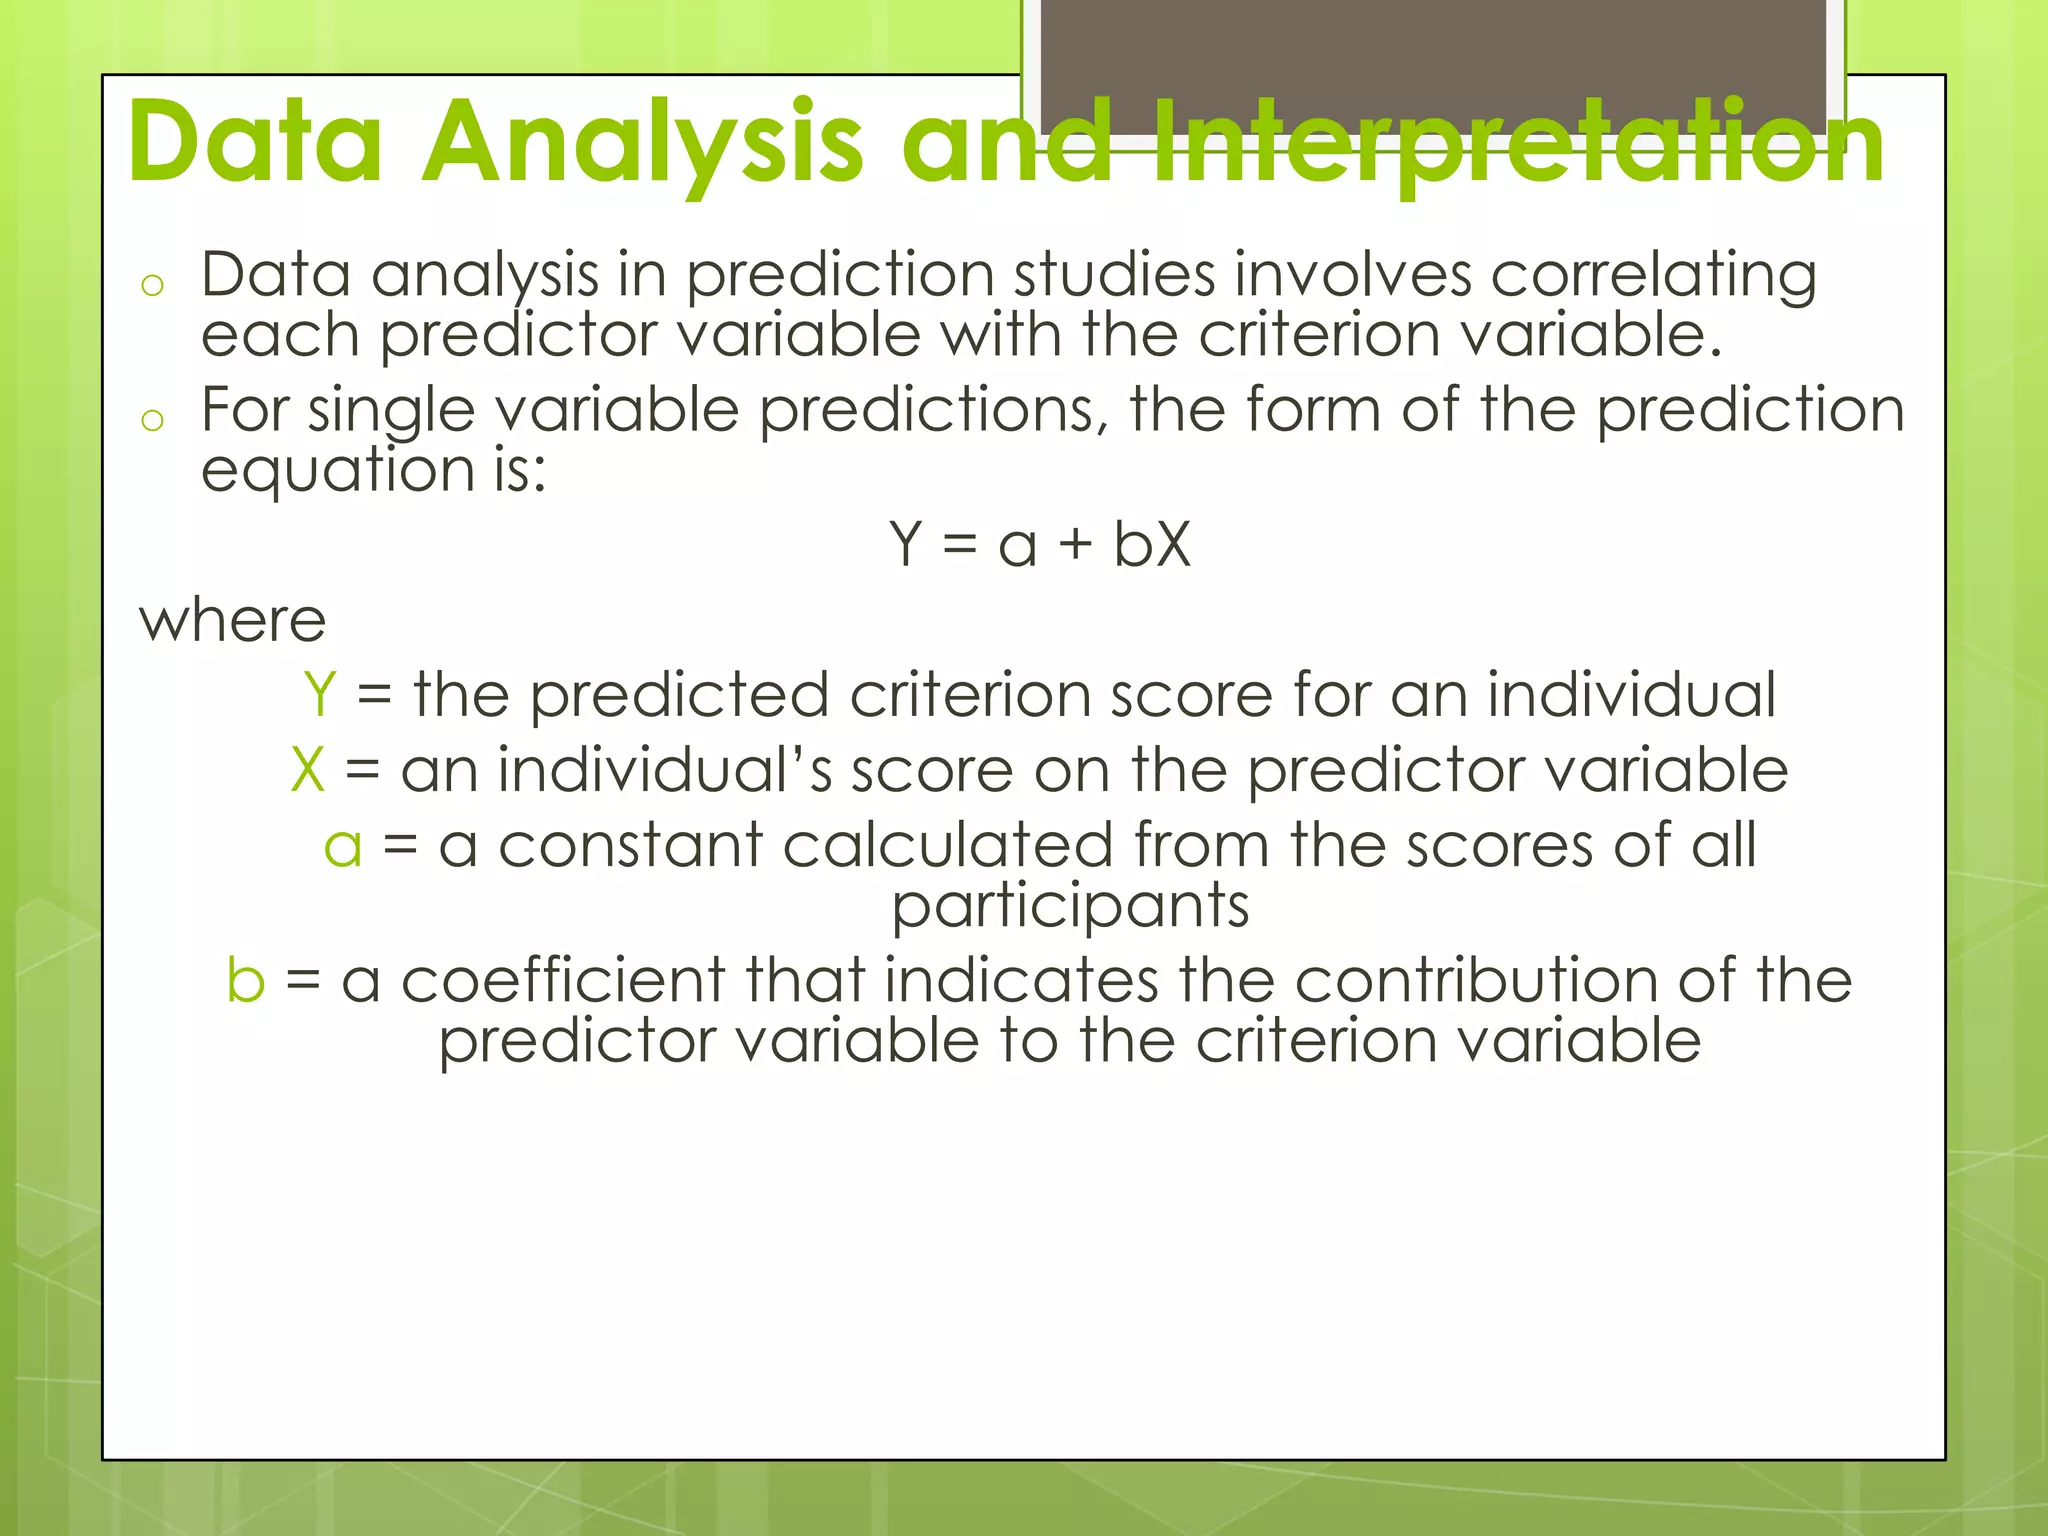
Data Analysis andInterpretation
Data analysis in prediction studies involves correlating
each predictor variable with the criterion variable.
o For single variable predictions, the form of the prediction
equation is:
Y = a + bX
where
Y = the predicted criterion score for an individual
X = an individual’s score on the predictor variable
a = a constant calculated from the scores of all
participants
b = a coefficient that indicates the contribution of the
predictor variable to the criterion variable
o
32.
Continued…
o
o
o
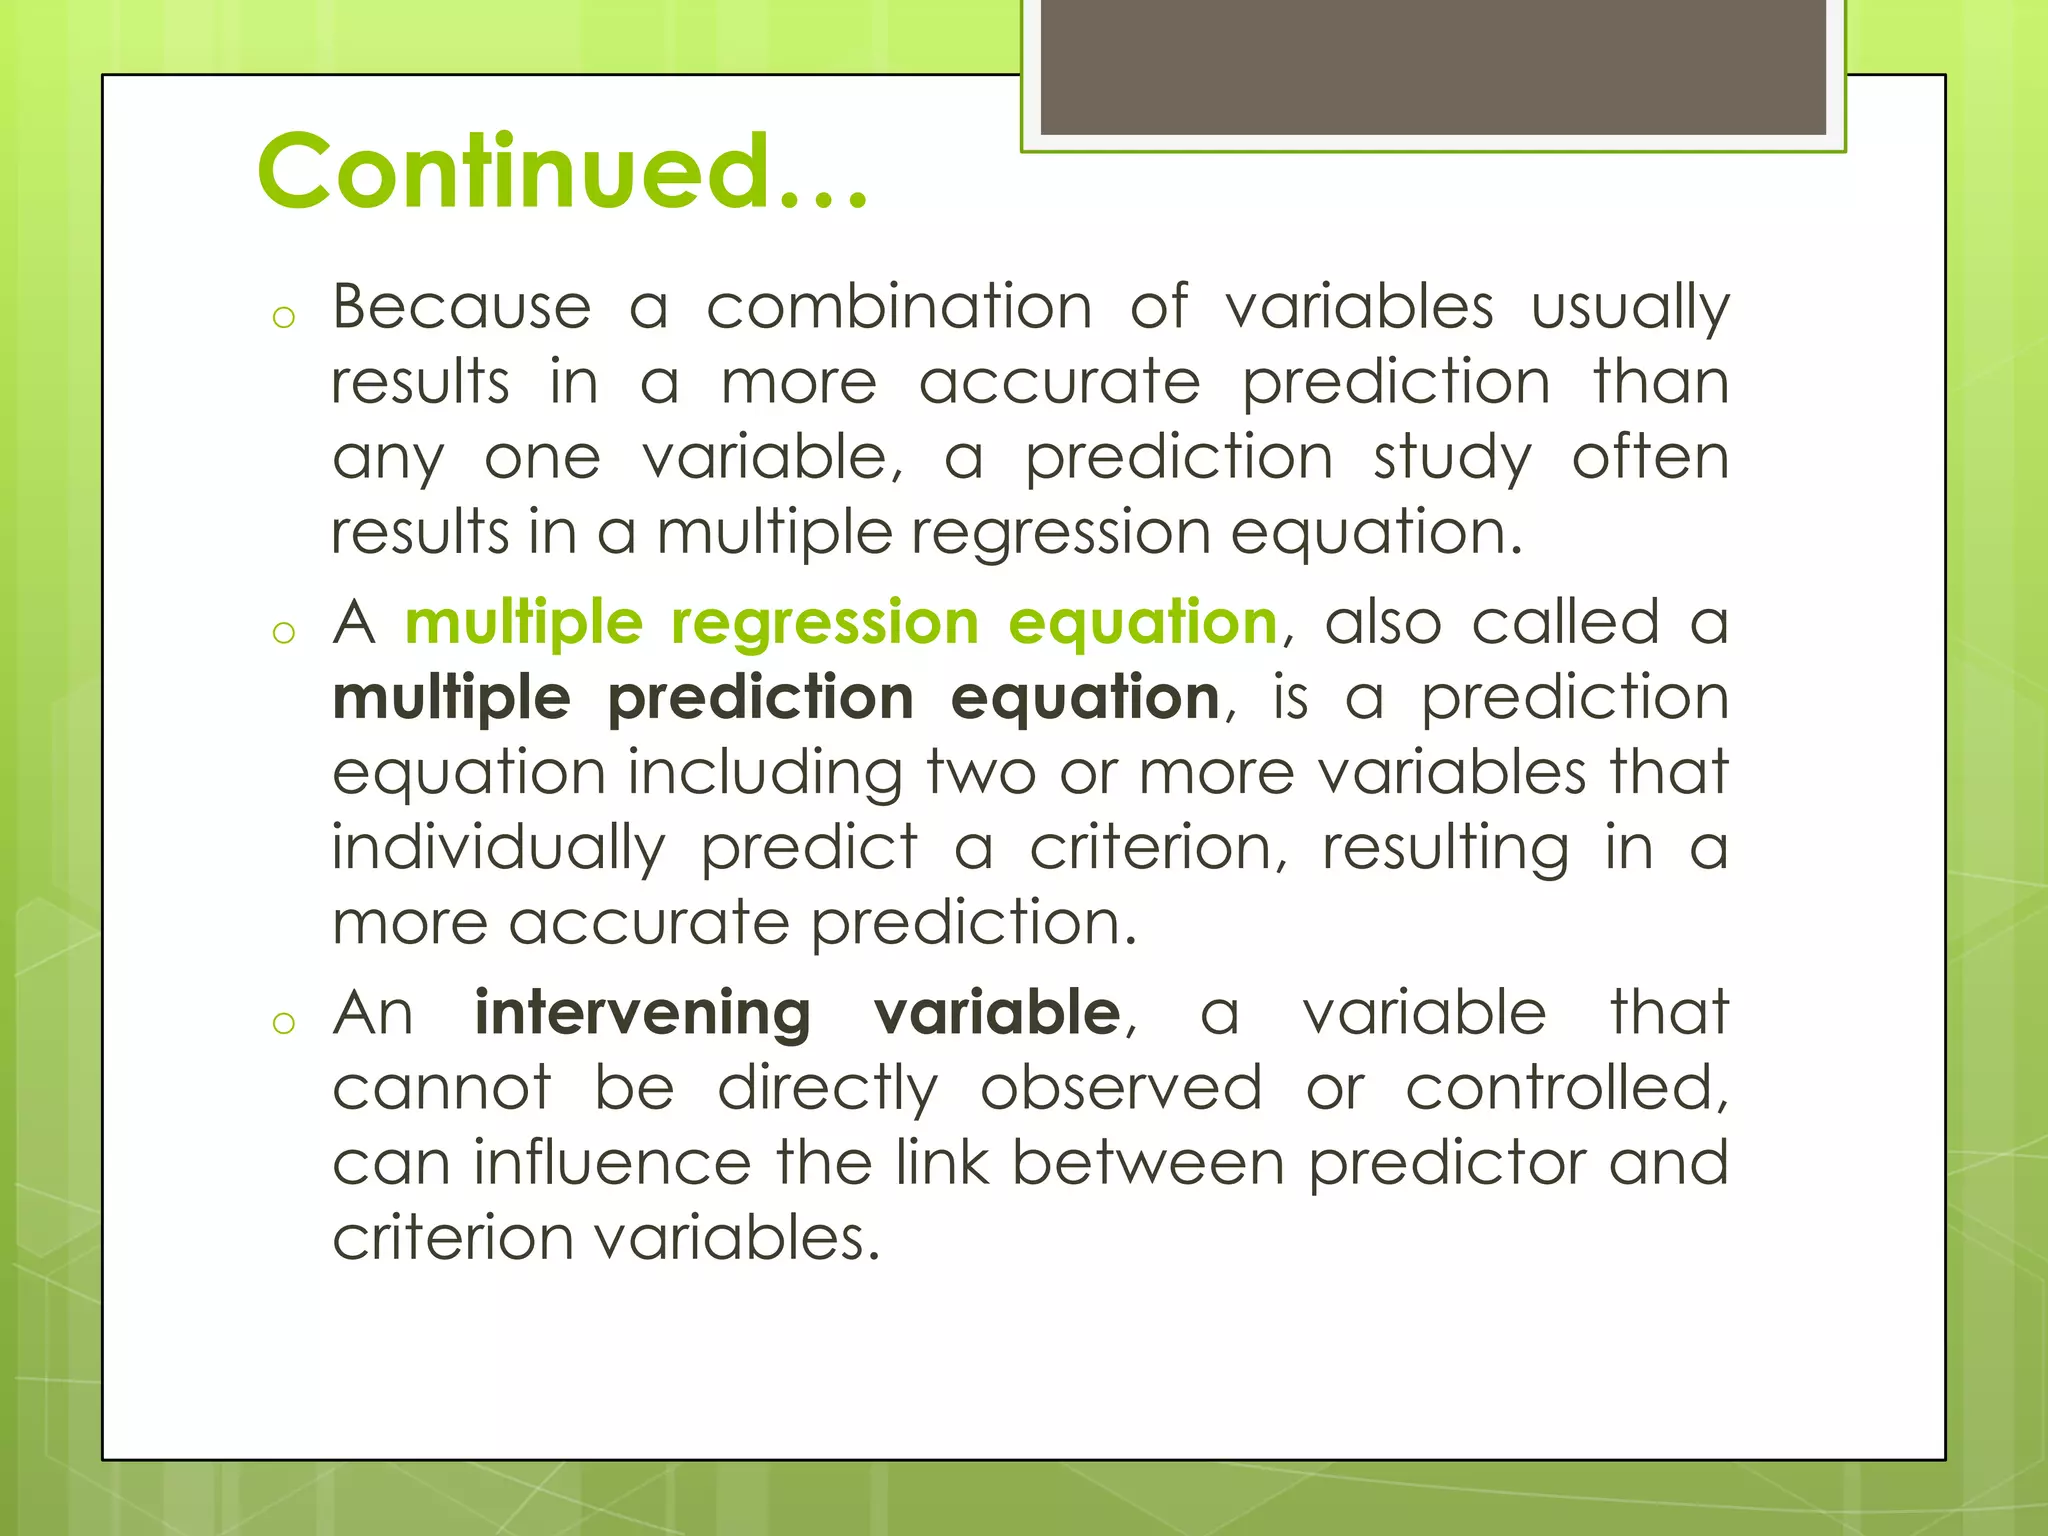
Because a combinationof variables usually
results in a more accurate prediction than
any one variable, a prediction study often
results in a multiple regression equation.
A multiple regression equation, also called a
multiple prediction equation, is a prediction
equation including two or more variables that
individually predict a criterion, resulting in a
more accurate prediction.
An intervening variable, a variable that
cannot be directly observed or controlled,
can influence the link between predictor and
criterion variables.
33.
OTHER CORRELATION-BASED
ANALYSES
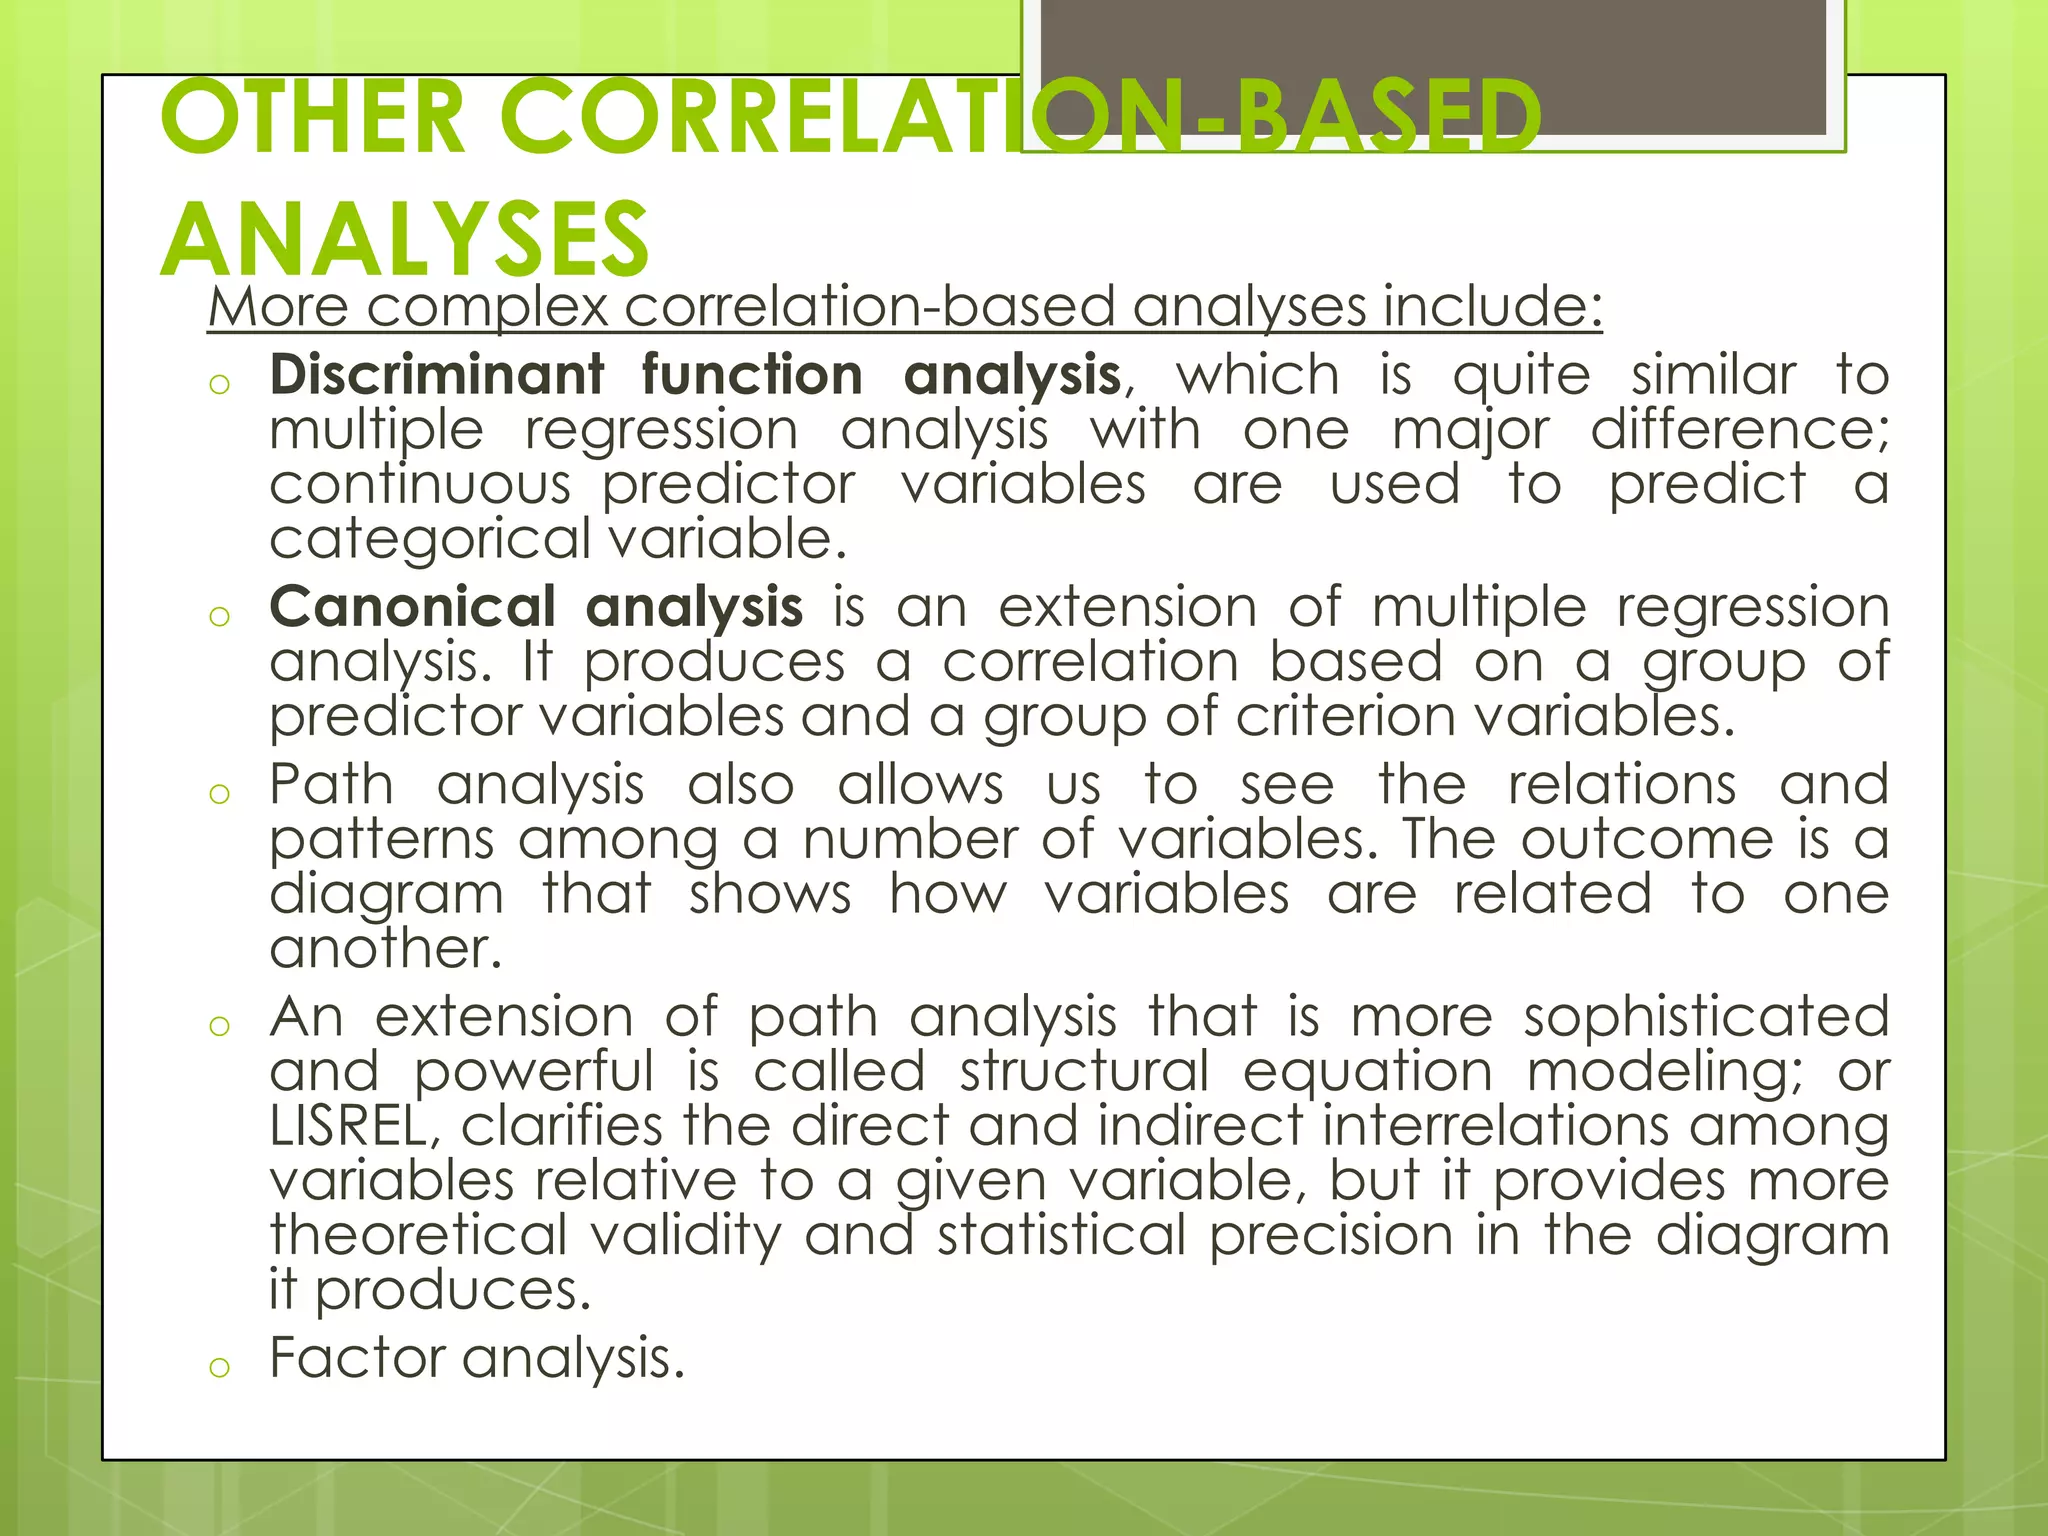
More complexcorrelation-based analyses include:
o
o
o
o
o
Discriminant function analysis, which is quite similar to
multiple regression analysis with one major difference;
continuous predictor variables are used to predict a
categorical variable.
Canonical analysis is an extension of multiple regression
analysis. It produces a correlation based on a group of
predictor variables and a group of criterion variables.
Path analysis also allows us to see the relations and
patterns among a number of variables. The outcome is a
diagram that shows how variables are related to one
another.
An extension of path analysis that is more sophisticated
and powerful is called structural equation modeling; or
LISREL, clarifies the direct and indirect interrelations among
variables relative to a given variable, but it provides more
theoretical validity and statistical precision in the diagram
it produces.
Factor analysis.
34.
PROBLEMS TO CONSIDERIN
INTERPRETING CORRELATION
COEFFICIENTS
o
1.
2.
3.
4.
5.
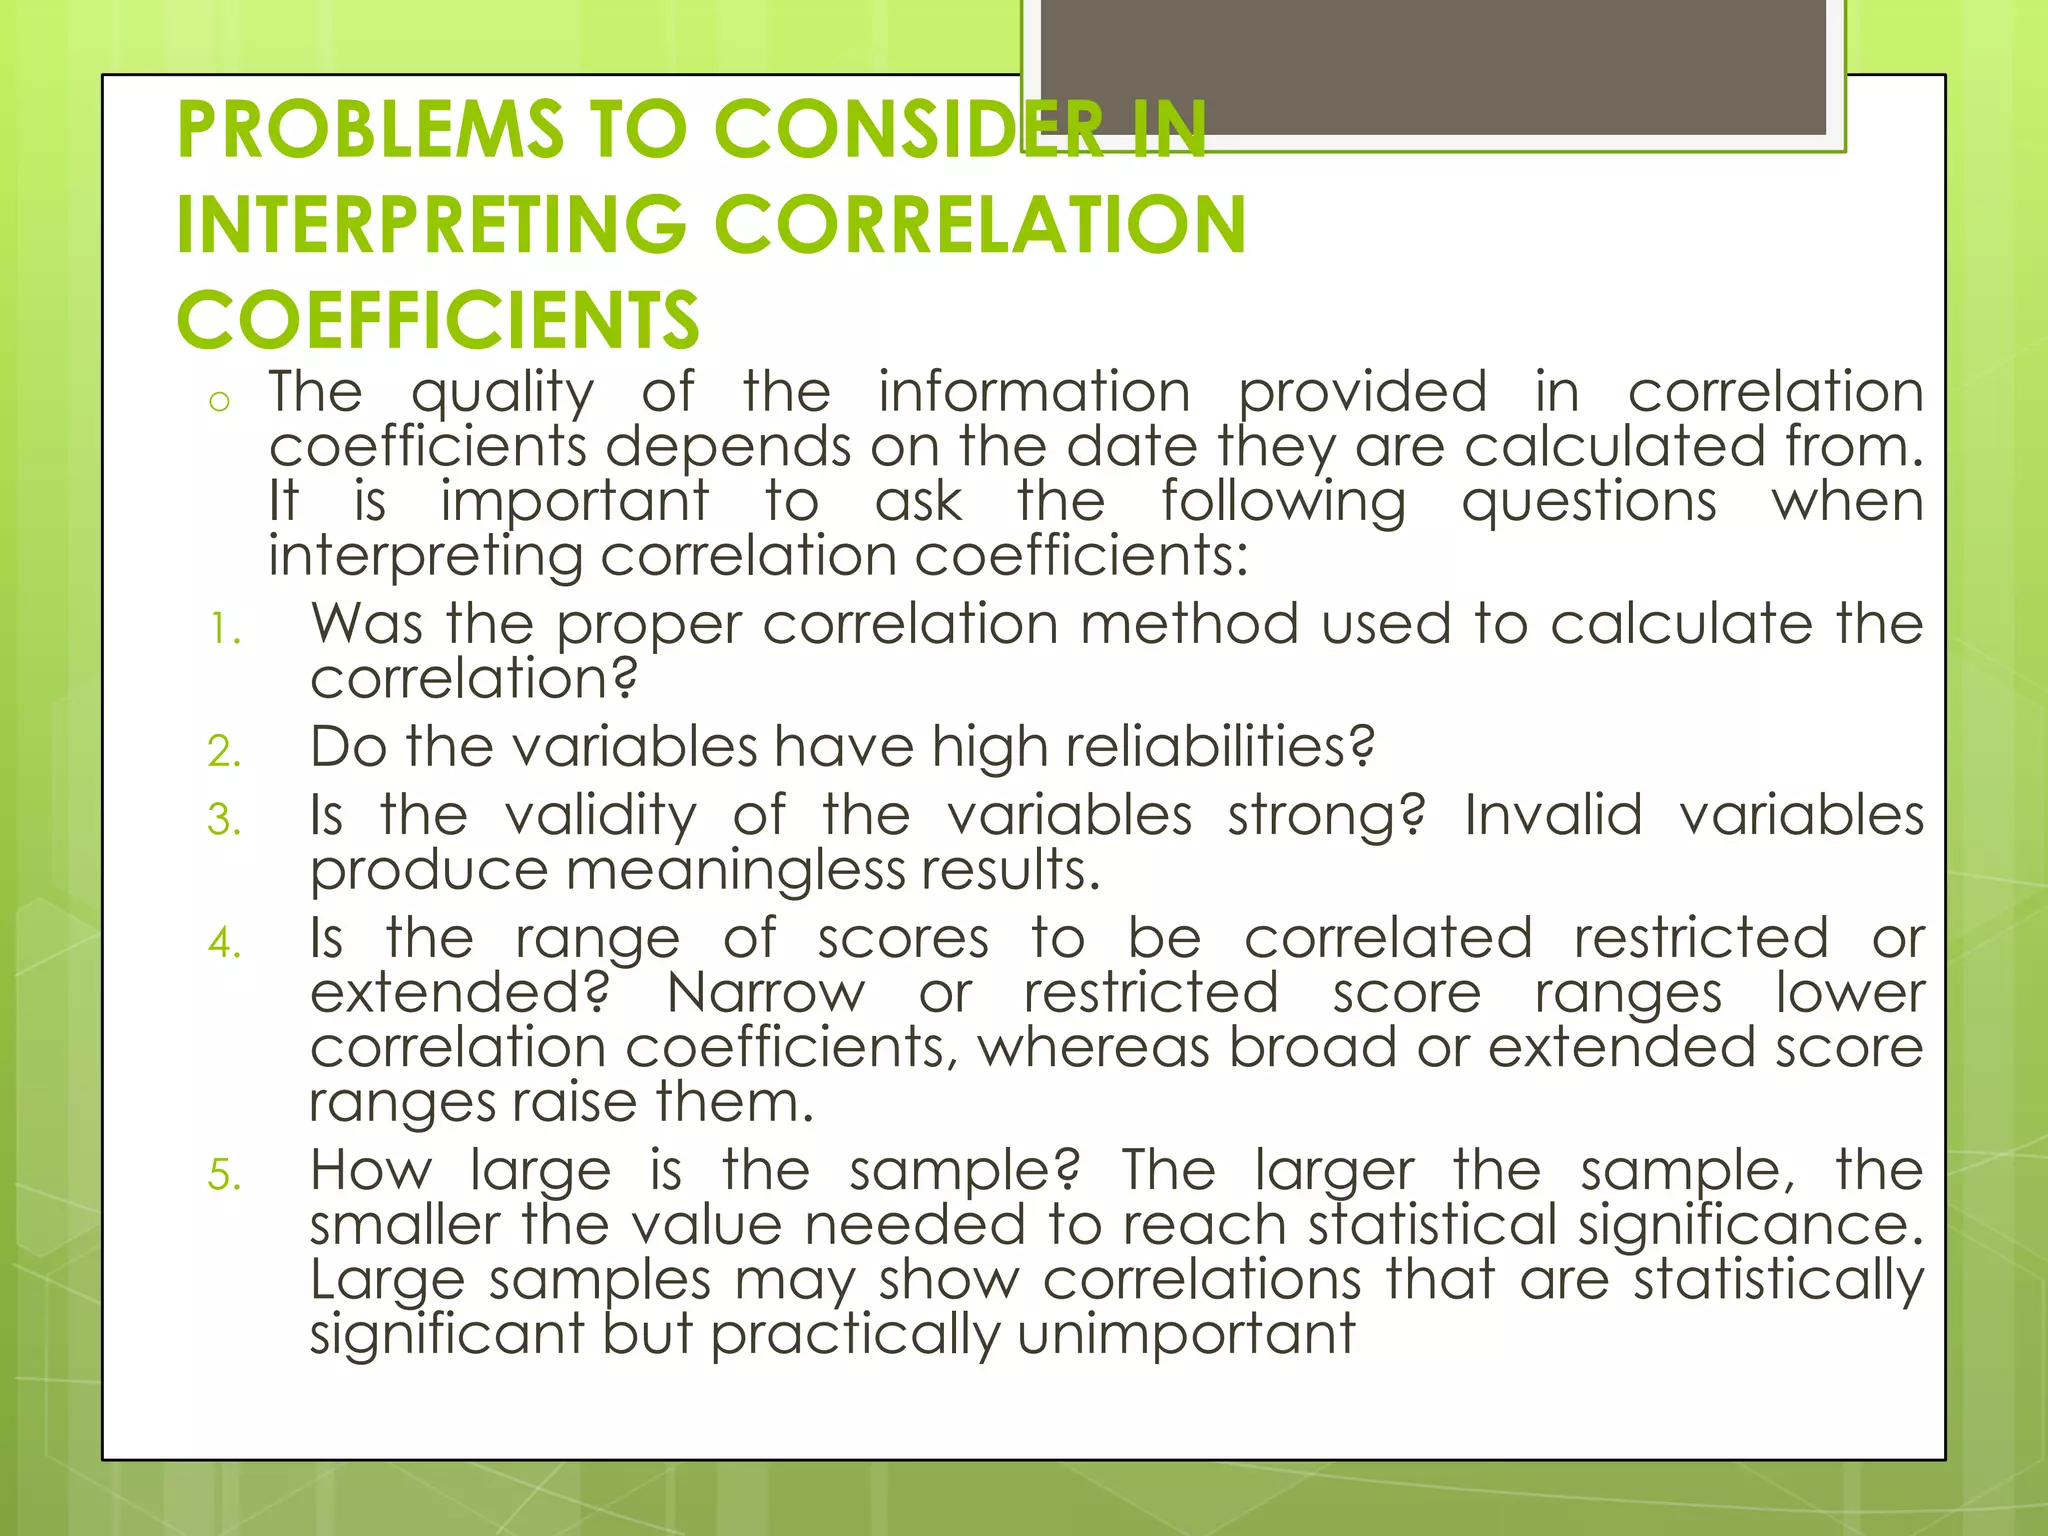
The quality of the information provided in correlation
coefficients depends on the date they are calculated from.
It is important to ask the following questions when
interpreting correlation coefficients:
Was the proper correlation method used to calculate the
correlation?
Do the variables have high reliabilities?
Is the validity of the variables strong? Invalid variables
produce meaningless results.
Is the range of scores to be correlated restricted or
extended? Narrow or restricted score ranges lower
correlation coefficients, whereas broad or extended score
ranges raise them.
How large is the sample? The larger the sample, the
smaller the value needed to reach statistical significance.
Large samples may show correlations that are statistically
significant but practically unimportant


![Conducting The Questionnaire
Select
participants: simple/stratified
random, cluster, systematic, nonrandom.
Distributing: mail, email, telephone.],
personal admin, interview. pg191
Conduct follow-up for reminder.
Rule of thumbs: must be more than 50%.
Dealing with nonresponse: get new
participants OR make assumptions by
generalization.
Analyzing Results: Select total sample size.](https://image.slidesharecdn.com/surveyandcorrelationalresearch1-131129044438-phpapp02/75/Survey-and-correlational-research-1-17-2048.jpg)

![Theoretical framewrk [Research Methodology]](https://cdn.slidesharecdn.com/ss_thumbnails/theoreticalframewrk-rm-131202130211-phpapp02-thumbnail.jpg?width=640&height=640&fit=bounds)


![Vibe Coding vs. Spec-Driven Development [Free Meetup]](https://cdn.slidesharecdn.com/ss_thumbnails/vibecodingvsspecdrivendevelopment-251209105622-43f455e7-thumbnail.jpg?width=640&height=640&fit=bounds)


