Downloaded 176 times


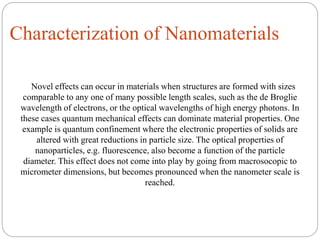
![UV -Visible Spectroscopy
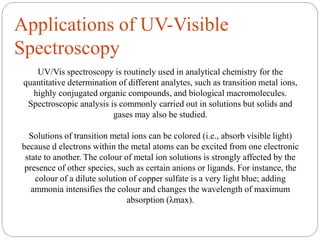
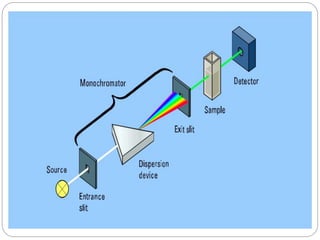
Ultraviolet–visible spectroscopy or ultraviolet-visible spectrophotometry (UV-Vis
or UV/Vis) refers to absorption spectroscopy or reflectance spectroscopy in the
ultraviolet-visible spectral region. This means it uses light in the visible and
adjacent (near-UV and near-infrared [NIR]) ranges. The absorption or reflectance
in the visible range directly affects the perceived color of the chemicals involved.
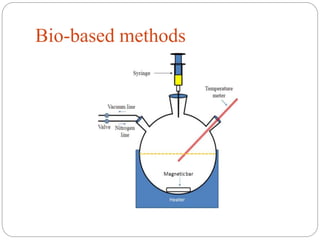
In this region of the electromagnetic spectrum, atoms and molecules undergo
electronic transitions. Absorption spectroscopy is complementary to fluorescence
spectroscopy, in that fluorescence deals with transitions from the excited state to
the ground state, while absorption measures transitions from the ground state to
the excited state.](https://image.slidesharecdn.com/nanoppt-171031050730/85/Nanomaterials-48-320.jpg)

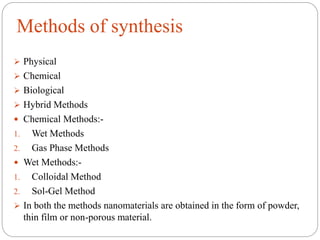
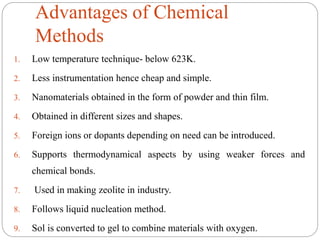
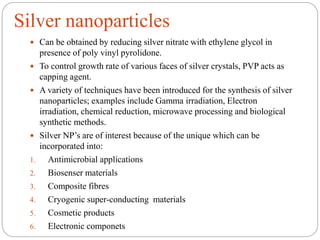
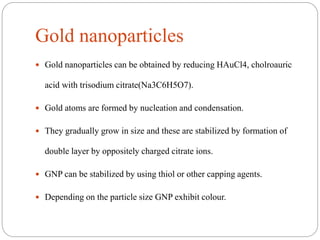
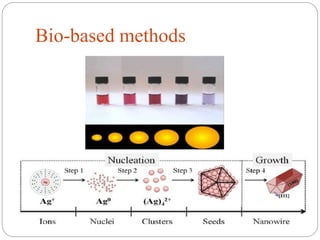
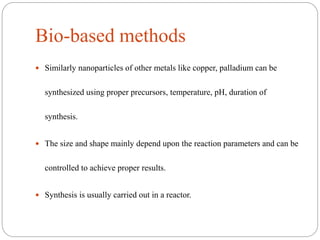
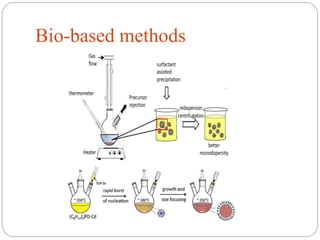
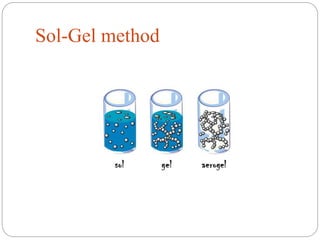
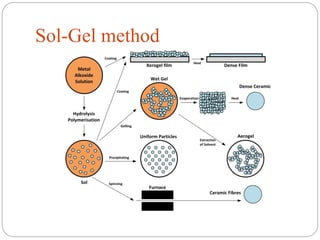
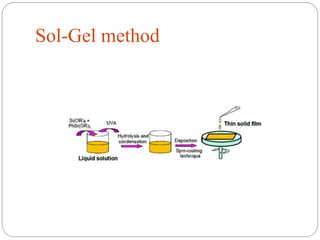
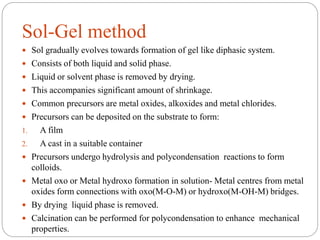
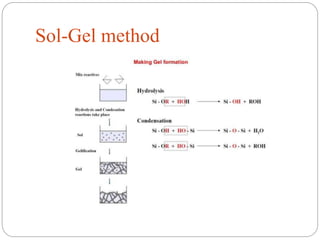
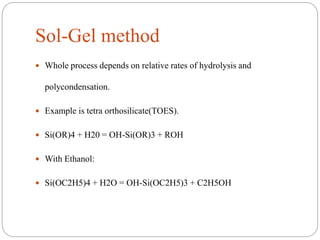
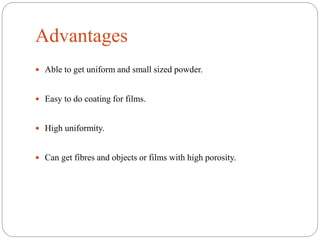
The document discusses nanomaterials, defined as particles ranging from 1nm to 100nm, and outlines various synthesis methods including physical, chemical, biological, and hybrid approaches. Key techniques, particularly chemical methods, include the colloidal route and sol-gel method, emphasizing their advantages in producing nanoparticles of different shapes and sizes. Additionally, the document highlights the characterization of nanomaterials using techniques like X-ray diffraction and UV-visible spectroscopy, which reveal unique properties at the nanoscale essential for various applications.


![谷歌留痕技术 [ 𝙩𝙤𝙥 𝟮𝟯𝟯. 𝙘 𝙤𝙢 ]](https://cdn.slidesharecdn.com/ss_thumbnails/top233-260130174328-3833018c-thumbnail.jpg?width=640&height=640&fit=bounds)


