Download to read offline

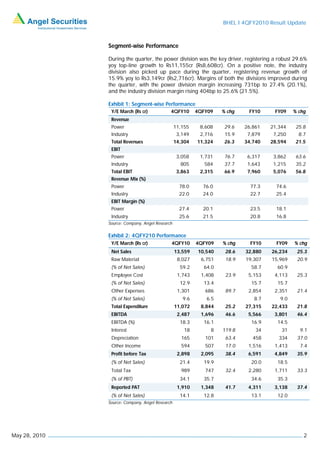
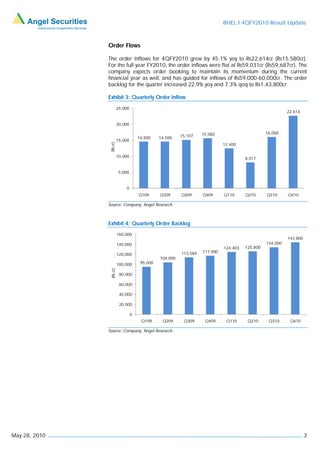
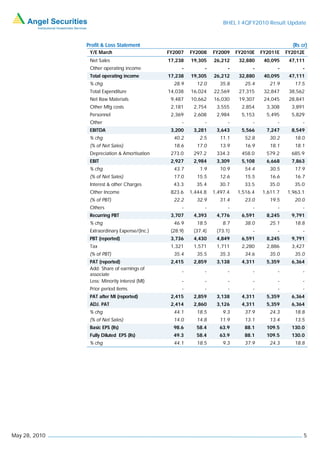

BHEL reported strong results for 4QFY2010 and FY2010, with revenues growing 28.6% and profits growing 41.7% for the quarter. Operating margins expanded due to lower raw material costs, though this was partially offset by higher other expenses. Order inflows grew 45.1% for the quarter. For FY2010-2012, revenues are expected to grow at a CAGR of 19.7% and profits at 21.5%. However, the analyst maintains a Neutral rating due to structural concerns in the industry.


