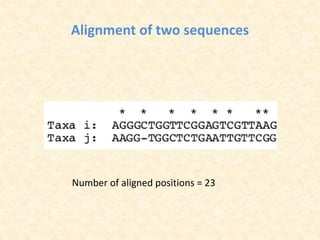
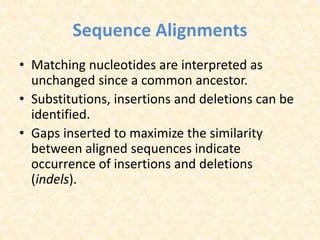
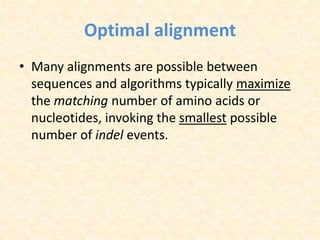
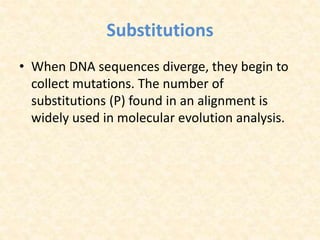
Molecular Evolution
Promila Sheoran
PhD Biotechnology
GJU S&T Hisar
Definition
•Molecular evolution is the process of change in the sequence
composition of cellular molecules such as DNA, RNA and
proteins across generations.
•The field of molecular evolution uses principles of
evolutionary biology and population genetics to explain
patterns in these changes.
History of molecular evolution
•The history of molecular evolution starts in the early 20th
century with "comparative biochemistry", but the field
of molecular evolution came into its own in the 1960s and
1970s, following the rise of molecular biology.
•The advent of protein sequencing allowed molecular biologists
to create phylogenies based on sequence comparison, and to
use the differences between homologous sequences as
a molecular clock to estimate the time since the last common
ancestor.
Cont..
•In the late 1960s, the Neutral Theory of Molecular
Evolution provided a theoretical basis for the molecular
clock.
• After the 1970s, nucleic acid sequencing allowed
molecular evolution to reach beyond proteins to highly
conserved ribosomal RNA sequences, the foundation of a
reconceptualization of the early history of life.
THE NEUTRAL THEORY OF MOLECULAR
EVOLUTION
 Genetic drift causes more substitutions than does natural
selection.
 Molecular evolution is a balance between drift and mutation.
Motoo Kimura (1968)
OBSERVATIONS THAT PROMPTED THE
NEUTRAL THEORY
 Observed rates of amino acid substitutions in
proteins were surprisingly high.
 The amount of heterozygosity in natural populations
seemed too high to be explained by selection.
MOLECULAR EVOLUTION
• Molecular evolution examines DNA and
proteins, addressing two types of questions:
– How do DNA and proteins evolve?
– How are genes and organisms evolutionarily
related?
Applications
• Reveal dynamics of evolutionary processes.
• Indicate chronology of change.
• Identify phylogenetic relationships.
Some basics:
Homology = refers to a structure, behavior or other character of
two taxa that is derived from the same or equivalent feature of
a common ancestor.
• Homology applies to nucleotide sequences
• Positional vs. character homology
GTACCT
G-ATCT
1. Four of six nucleotide positions have undergone no
change.
2. A substitution has occurred at position 4.
3. Insertion/deletion has occurred in one sequence at
position 2.
Alignment of two sequences
Number of aligned positions = 23
Sequence Alignments
• Matching nucleotides are interpreted as
unchanged since a common ancestor.
• Substitutions, insertions and deletions can be
identified.
• Gaps inserted to maximize the similarity
between aligned sequences indicate
occurrence of insertions and deletions
(indels).
Optimal alignment
• Many alignments are possible between
sequences and algorithms typically maximize
the matching number of amino acids or
nucleotides, invoking the smallest possible
number of indel events.
Substitutions
• When DNA sequences diverge, they begin to
collect mutations. The number of
substitutions (P) found in an alignment is
widely used in molecular evolution analysis.
An exemplary alignment
Number of aligned positions = 23
Number of different positions (P) = 8
Number of substitutions
• If the alignment shows few substitutions, a
simple count is used.
• If many substitutions occurred, it is likely that
a simple count will underestimate the
substitution events, due to the probability of
multiple changes at the same site.
Jukes and Cantor Model
• They assumed that each nucleotide is
equally likely to change into any other
nucleotide, and created a mathematical
model to describe multiple base
substitutions.
Jukes and Cantor model
• K =-3/4ln(1-4/3P)
– P= observed number of substitutions over the total
number of sites.
– K=distance between sequence x and sequence y
expressed as the number of changes per site corrected
for multiple substitutions at the same site
• natural log (ln) corrects for the underestimation of
substitutions.
• ¾ and 4/3 are terms reflect that there are four types of
nucleotides and three ways in which a second nucleotide may
be substituted with.
P = 8/23 = 0.348
K = -(3/4)*ln(1-4/3*P) = 0.467
Observed distance P = 0.348 increases when Jukes Cantor Model is used
to correct for the multiple substitutions.
Calculation of distance (K)
between sequences
Correction for multiple substitutions
• If two sequences are 95% identical, then P = 0.05;
and
– K =
– 0.0517-0.05 = 0.0017
• If two sequences are only 50% identical, then P =
0.5; and
– K =
– 0.824 – 0.5 = 0.324
Rates of nucleotide substitutions
• Substitutions accumulate independently and
simultaneously in different sequences.
• Substitution rate, R, can be calculated by
dividing the distance (K) between two
homologous sequences by 2T, where T is the
divergence time.
• R = K/(2T).
Example
• The following sequences represent an optimum
alignment of the first 50 nucleotides of human and
sheep preproinsulin genes, which last shared a
common ancestor 80 million years ago:
• Human: ATGGCCTGT GGATGCGCCT CCTGCCCCTG CTGGCGCTGC TGGCCCTCTG
• Sheep: ATGGCCTGT GGACACGCCT GGTGCCCCTG CTGGCCCTGC TGGCACTCTG
Example
• Human: ATGGCCTGT GGATGCGCCT CCTGCCCCTG CTGGCGCTGC TGGCCCTCTG
• Sheep: ATGGCCTGT GGACACGCCT GGTGCCCCTG CTGGCCCTGC TGGCACTCTG
• P = 6/50 = 0.12 (observed)
• K = -(3/4)ln(1-(4/3)(0.12)) = 0.1308
• Estimated number of substitutions = 50 x 0.1308 = 6.56
• R = K/(2T) = 0.1308/(2 x 80 x 106) = 8.175 x 10⁻¹⁰/year
Degenerate Code
• Codons are degenerate.
• Of 20 amino acids, 18 are encoded by more than
one codon.
• Met (AUG) and Trp (UGG) are the exceptions; all
other correspond to a set of two or more codons.
• Codon sets often show a pattern in their
sequences; variation at the third position is most
common.
Degenerate Code
• The code has start and stop signals. AUG, the start
signal for protein synthesis. Stop codons have no
corresponding tRNA (UAG, amber; UAA, ochre;
UGA, opal).
• Wobble occurs in the anticodon. The 3rd base in
the codon is able to base-pair less specifically,
because it is less constrained three dimensionally.
Patterns and Modes of Substitutions
• Patterns of variation within homologous genes
show that some amino acid substitutions are
found more frequently than others.
Patterns and Modes of Substitutions
• Substitutions often involve amino acids with
similar chemical characteristics, supporting two
evolutionary principles:
– Mutations are rare events
– Most dramatic changes are removed by natural
selection.
Patterns and Modes of Substitutions
• Chemically similar amino acids tend to have
similar codons and so may result from a single
mutation.
– Natural selection acting on this variation
produces proteins optimized for role and
environment.
– More substantial alterations of protein
structure are likely to be deleterious and
removed from gene pool.
Synonymous and non-Synonymous
Sites
• Synonymous changes, which do not alter the amino acids
in the protein, are found five times more often than non-
synonymous changes.
– Both types of change are equally likely to occur, but
non-synonymous changes are usually detrimental to
fitness and are eliminated by natural selection.
• Mutations are changes in nucleotide sequences due
to errors in replication or repair.
• Substitutions are mutations that have passed
through the filter of selection.
Variation in evolutionary rates
within genes
• Studies show that different regions of
genes evolve at different rates.
• Distinctions are seen between and within
coding and non-coding regions. Examples
of non-coding regions include introns,
leaders, non-transcribed flanking regions,
pseudogenes.
Relative rates of evolutionary
change in mammals
Sequence R (x 10-9)
Functional genes
5’ flanking region 2.36
CDS, synonymous 4.65
CDS, nonsynonymous 0.88
Intron 3.70
3’ flanking region 4.46
Pseudogenes 4.85
Flanking regions and introns
• Changes in 3’ sequences have no known effect on
the amino acid sequence; so most substitutions are
tolerated.
• Rate of substitutions are high in introns but not as
high as in synonymous of CDS.
• 5’ untranslated regions have low rates: they contain
regulatory regions for transcription.
• Highest rate of evolution is that of nonfunctional
pseudogenes, which no longer code for proteins.
Coding sequences with high rates
of nonsynonymous substitution
• Major Histocompatibility Complex (MHC) in
mammals
– If there is evolutionary pressure for diversity, substitutions
become advantageous.
– MHC is involved in immune function where diversity favors
fewer individuals vulnerable to an infection by any single
virus.
– Viruses utilize error-prone replication coupled with
diversifying selection.
– Both viruses and MHC complex rapidly evolves due to
natural selection for diversification.
Ribosomal RNAs
• Sequences of rRNA regions that interact and provide
for ribosomal function by pairing will be subject to
mutation at the same rates as sequences that do not
pair.
• However, mutations that disrupt pairing will be
selected against, since such mutations will alter
ribosomal function and become detrimental to
fitness.
Mitochondrial DNA (mtDNA)
• Mammalian mitochondrial genome contains a
circular, double-stranded mtDNA about 15000 bp
long (1/10000 of the nuclear genome, encoding 2
rRNAs, 22 tRNAs, and 13 proteins).
• The average synonymous substitution rate in
mammalian mitochondria is 5.7 x 10⁻⁸/site/year, 10
times higher than the synonymous substitutions in
nuclear genes.
Mitochondrial DNA (mtDNA)
• The higher rates of mutation in mtDNA are likely to
be due to:
– The higher error rate during mtDNA replication and repair. mtDNA
polymerases have no proofreading ability.
– Higher concentrations of mutagens such as free radicals resulting from
metabolic processes.
– Less selective pressure because there are many of them within the
cell; changes are less detrimental.
Maternal transmission
• Clonal inheritance from mother, when the mother’s
egg contributes to the zygote. So no meiosis occurs,
all offspring will have the same mtDNA from the
same mother.
• Study matriarchal lineages can be traced allowing
examination of family structure.
• Example: geographic variation in mtDNA sequences
of pocket gophers in south eastern USA.
mtDNA or nuclear DNA
• Suppose you are studying human migrational
patterns?
– Would you use mtDNA or nuclear genes to
estimate how long ago humans moved from a
particular place to another?
– Since the time scale is on the order of tens of
thousands years and mtDNA accumulate more
mutations than nuclear DNA, mtDNA will provide
more information about the differences between
human populations geographically separated.
Molecular Clock
• Suggests that rates of molecular evolution for
loci with similar functional constraints are
uniform during the time period after
divergence from a common ancestor (Fossil
record).
• Molecular clocks
 Can be used to estimate divergence time.
 “Clocks” tick differently in different proteins.
The molecular clock for alpha-globin:
Each point represents the number of substitutions separating each animal
from humans
0
20
40
60
80
100
0
100
200
300
400
500
Time to common ancestor (millions of years)
numberofsubstitutions
cow
platypus
chicken
carp
shark
The molecular clock for alpha-
globin
Rates of amino acid replacement in
different proteins
Protein Rate (mean replacements per site
per 10 9 years)
Fibrinopeptides 8.3
Insulin C 2.4
Ribonuclease 2.1
Haemoglobins 1.0
Cytochrome C 0.3
Histone H4 0.01
Rates of amino acid replacement
in proteins
Causes of fast/slow molecular substitution rates
• Substitution rates are expected to be related to germ line replication
(or generation time).
• Metabolic rate also is thought to be an important factor (correlates
with body size and generation time).
example: rodents are small, have a high metabolic rate, and have
short generation time/rodent rates are ~2x humans and apes.
• In addition to variation between and among genes, rates vary widely
among taxonomic groups.
• Other sources of variation:
• DNA repair mechanisms/efficiency
• Exposure to mutagens
• Opportunities to adapt to new environments, may lead to bursts
of rapid evolution.
Molecular Phylogeny
• Organisms are similar at the molecular level
are expected to be more closely related than
dissimilar organisms.
• Phylogenetic relationships among living things
are inferred from molecular similarity.
THANK YOU

Molecular evolution

  • 1.
    Molecular Evolution Promila Sheoran PhDBiotechnology GJU S&T Hisar
  • 2.
    Definition •Molecular evolution isthe process of change in the sequence composition of cellular molecules such as DNA, RNA and proteins across generations. •The field of molecular evolution uses principles of evolutionary biology and population genetics to explain patterns in these changes.
  • 3.
    History of molecularevolution •The history of molecular evolution starts in the early 20th century with "comparative biochemistry", but the field of molecular evolution came into its own in the 1960s and 1970s, following the rise of molecular biology. •The advent of protein sequencing allowed molecular biologists to create phylogenies based on sequence comparison, and to use the differences between homologous sequences as a molecular clock to estimate the time since the last common ancestor.
  • 4.
    Cont.. •In the late1960s, the Neutral Theory of Molecular Evolution provided a theoretical basis for the molecular clock. • After the 1970s, nucleic acid sequencing allowed molecular evolution to reach beyond proteins to highly conserved ribosomal RNA sequences, the foundation of a reconceptualization of the early history of life.
  • 5.
    THE NEUTRAL THEORYOF MOLECULAR EVOLUTION  Genetic drift causes more substitutions than does natural selection.  Molecular evolution is a balance between drift and mutation. Motoo Kimura (1968)
  • 6.
    OBSERVATIONS THAT PROMPTEDTHE NEUTRAL THEORY  Observed rates of amino acid substitutions in proteins were surprisingly high.  The amount of heterozygosity in natural populations seemed too high to be explained by selection.
  • 7.
    MOLECULAR EVOLUTION • Molecularevolution examines DNA and proteins, addressing two types of questions: – How do DNA and proteins evolve? – How are genes and organisms evolutionarily related?
  • 8.
    Applications • Reveal dynamicsof evolutionary processes. • Indicate chronology of change. • Identify phylogenetic relationships.
  • 9.
    Some basics: Homology =refers to a structure, behavior or other character of two taxa that is derived from the same or equivalent feature of a common ancestor. • Homology applies to nucleotide sequences • Positional vs. character homology GTACCT G-ATCT 1. Four of six nucleotide positions have undergone no change. 2. A substitution has occurred at position 4. 3. Insertion/deletion has occurred in one sequence at position 2.
  • 10.
    Alignment of twosequences Number of aligned positions = 23
  • 11.
    Sequence Alignments • Matchingnucleotides are interpreted as unchanged since a common ancestor. • Substitutions, insertions and deletions can be identified. • Gaps inserted to maximize the similarity between aligned sequences indicate occurrence of insertions and deletions (indels).
  • 12.
    Optimal alignment • Manyalignments are possible between sequences and algorithms typically maximize the matching number of amino acids or nucleotides, invoking the smallest possible number of indel events.
  • 13.
    Substitutions • When DNAsequences diverge, they begin to collect mutations. The number of substitutions (P) found in an alignment is widely used in molecular evolution analysis.
  • 14.
    An exemplary alignment Numberof aligned positions = 23 Number of different positions (P) = 8
  • 15.
    Number of substitutions •If the alignment shows few substitutions, a simple count is used. • If many substitutions occurred, it is likely that a simple count will underestimate the substitution events, due to the probability of multiple changes at the same site.
  • 16.
    Jukes and CantorModel • They assumed that each nucleotide is equally likely to change into any other nucleotide, and created a mathematical model to describe multiple base substitutions.
  • 17.
    Jukes and Cantormodel • K =-3/4ln(1-4/3P) – P= observed number of substitutions over the total number of sites. – K=distance between sequence x and sequence y expressed as the number of changes per site corrected for multiple substitutions at the same site • natural log (ln) corrects for the underestimation of substitutions. • ¾ and 4/3 are terms reflect that there are four types of nucleotides and three ways in which a second nucleotide may be substituted with.
  • 18.
    P = 8/23= 0.348 K = -(3/4)*ln(1-4/3*P) = 0.467 Observed distance P = 0.348 increases when Jukes Cantor Model is used to correct for the multiple substitutions. Calculation of distance (K) between sequences
  • 19.
    Correction for multiplesubstitutions • If two sequences are 95% identical, then P = 0.05; and – K = – 0.0517-0.05 = 0.0017 • If two sequences are only 50% identical, then P = 0.5; and – K = – 0.824 – 0.5 = 0.324
  • 20.
    Rates of nucleotidesubstitutions • Substitutions accumulate independently and simultaneously in different sequences. • Substitution rate, R, can be calculated by dividing the distance (K) between two homologous sequences by 2T, where T is the divergence time. • R = K/(2T).
  • 21.
    Example • The followingsequences represent an optimum alignment of the first 50 nucleotides of human and sheep preproinsulin genes, which last shared a common ancestor 80 million years ago: • Human: ATGGCCTGT GGATGCGCCT CCTGCCCCTG CTGGCGCTGC TGGCCCTCTG • Sheep: ATGGCCTGT GGACACGCCT GGTGCCCCTG CTGGCCCTGC TGGCACTCTG
  • 22.
    Example • Human: ATGGCCTGTGGATGCGCCT CCTGCCCCTG CTGGCGCTGC TGGCCCTCTG • Sheep: ATGGCCTGT GGACACGCCT GGTGCCCCTG CTGGCCCTGC TGGCACTCTG • P = 6/50 = 0.12 (observed) • K = -(3/4)ln(1-(4/3)(0.12)) = 0.1308 • Estimated number of substitutions = 50 x 0.1308 = 6.56 • R = K/(2T) = 0.1308/(2 x 80 x 106) = 8.175 x 10⁻¹⁰/year
  • 23.
    Degenerate Code • Codonsare degenerate. • Of 20 amino acids, 18 are encoded by more than one codon. • Met (AUG) and Trp (UGG) are the exceptions; all other correspond to a set of two or more codons. • Codon sets often show a pattern in their sequences; variation at the third position is most common.
  • 24.
    Degenerate Code • Thecode has start and stop signals. AUG, the start signal for protein synthesis. Stop codons have no corresponding tRNA (UAG, amber; UAA, ochre; UGA, opal). • Wobble occurs in the anticodon. The 3rd base in the codon is able to base-pair less specifically, because it is less constrained three dimensionally.
  • 25.
    Patterns and Modesof Substitutions • Patterns of variation within homologous genes show that some amino acid substitutions are found more frequently than others.
  • 26.
    Patterns and Modesof Substitutions • Substitutions often involve amino acids with similar chemical characteristics, supporting two evolutionary principles: – Mutations are rare events – Most dramatic changes are removed by natural selection.
  • 27.
    Patterns and Modesof Substitutions • Chemically similar amino acids tend to have similar codons and so may result from a single mutation. – Natural selection acting on this variation produces proteins optimized for role and environment. – More substantial alterations of protein structure are likely to be deleterious and removed from gene pool.
  • 28.
    Synonymous and non-Synonymous Sites •Synonymous changes, which do not alter the amino acids in the protein, are found five times more often than non- synonymous changes. – Both types of change are equally likely to occur, but non-synonymous changes are usually detrimental to fitness and are eliminated by natural selection. • Mutations are changes in nucleotide sequences due to errors in replication or repair. • Substitutions are mutations that have passed through the filter of selection.
  • 29.
    Variation in evolutionaryrates within genes • Studies show that different regions of genes evolve at different rates. • Distinctions are seen between and within coding and non-coding regions. Examples of non-coding regions include introns, leaders, non-transcribed flanking regions, pseudogenes.
  • 30.
    Relative rates ofevolutionary change in mammals Sequence R (x 10-9) Functional genes 5’ flanking region 2.36 CDS, synonymous 4.65 CDS, nonsynonymous 0.88 Intron 3.70 3’ flanking region 4.46 Pseudogenes 4.85
  • 31.
    Flanking regions andintrons • Changes in 3’ sequences have no known effect on the amino acid sequence; so most substitutions are tolerated. • Rate of substitutions are high in introns but not as high as in synonymous of CDS. • 5’ untranslated regions have low rates: they contain regulatory regions for transcription. • Highest rate of evolution is that of nonfunctional pseudogenes, which no longer code for proteins.
  • 32.
    Coding sequences withhigh rates of nonsynonymous substitution • Major Histocompatibility Complex (MHC) in mammals – If there is evolutionary pressure for diversity, substitutions become advantageous. – MHC is involved in immune function where diversity favors fewer individuals vulnerable to an infection by any single virus. – Viruses utilize error-prone replication coupled with diversifying selection. – Both viruses and MHC complex rapidly evolves due to natural selection for diversification.
  • 33.
    Ribosomal RNAs • Sequencesof rRNA regions that interact and provide for ribosomal function by pairing will be subject to mutation at the same rates as sequences that do not pair. • However, mutations that disrupt pairing will be selected against, since such mutations will alter ribosomal function and become detrimental to fitness.
  • 34.
    Mitochondrial DNA (mtDNA) •Mammalian mitochondrial genome contains a circular, double-stranded mtDNA about 15000 bp long (1/10000 of the nuclear genome, encoding 2 rRNAs, 22 tRNAs, and 13 proteins). • The average synonymous substitution rate in mammalian mitochondria is 5.7 x 10⁻⁸/site/year, 10 times higher than the synonymous substitutions in nuclear genes.
  • 35.
    Mitochondrial DNA (mtDNA) •The higher rates of mutation in mtDNA are likely to be due to: – The higher error rate during mtDNA replication and repair. mtDNA polymerases have no proofreading ability. – Higher concentrations of mutagens such as free radicals resulting from metabolic processes. – Less selective pressure because there are many of them within the cell; changes are less detrimental.
  • 36.
    Maternal transmission • Clonalinheritance from mother, when the mother’s egg contributes to the zygote. So no meiosis occurs, all offspring will have the same mtDNA from the same mother. • Study matriarchal lineages can be traced allowing examination of family structure. • Example: geographic variation in mtDNA sequences of pocket gophers in south eastern USA.
  • 37.
    mtDNA or nuclearDNA • Suppose you are studying human migrational patterns? – Would you use mtDNA or nuclear genes to estimate how long ago humans moved from a particular place to another? – Since the time scale is on the order of tens of thousands years and mtDNA accumulate more mutations than nuclear DNA, mtDNA will provide more information about the differences between human populations geographically separated.
  • 38.
    Molecular Clock • Suggeststhat rates of molecular evolution for loci with similar functional constraints are uniform during the time period after divergence from a common ancestor (Fossil record). • Molecular clocks  Can be used to estimate divergence time.  “Clocks” tick differently in different proteins.
  • 39.
    The molecular clockfor alpha-globin: Each point represents the number of substitutions separating each animal from humans 0 20 40 60 80 100 0 100 200 300 400 500 Time to common ancestor (millions of years) numberofsubstitutions cow platypus chicken carp shark The molecular clock for alpha- globin
  • 40.
    Rates of aminoacid replacement in different proteins Protein Rate (mean replacements per site per 10 9 years) Fibrinopeptides 8.3 Insulin C 2.4 Ribonuclease 2.1 Haemoglobins 1.0 Cytochrome C 0.3 Histone H4 0.01 Rates of amino acid replacement in proteins
  • 41.
    Causes of fast/slowmolecular substitution rates • Substitution rates are expected to be related to germ line replication (or generation time). • Metabolic rate also is thought to be an important factor (correlates with body size and generation time). example: rodents are small, have a high metabolic rate, and have short generation time/rodent rates are ~2x humans and apes. • In addition to variation between and among genes, rates vary widely among taxonomic groups. • Other sources of variation: • DNA repair mechanisms/efficiency • Exposure to mutagens • Opportunities to adapt to new environments, may lead to bursts of rapid evolution.
  • 42.
    Molecular Phylogeny • Organismsare similar at the molecular level are expected to be more closely related than dissimilar organisms. • Phylogenetic relationships among living things are inferred from molecular similarity.
  • 43.