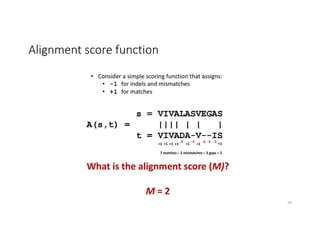
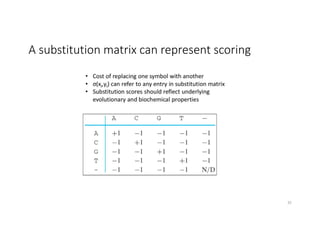
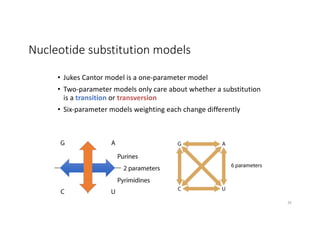
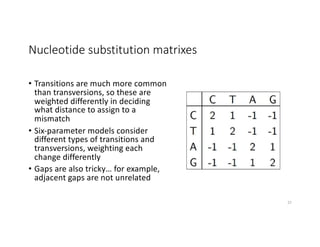
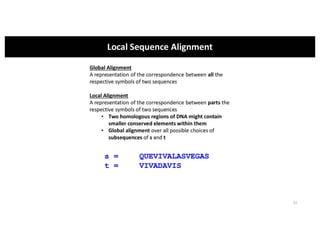
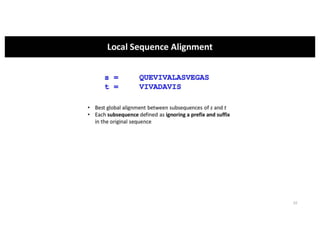
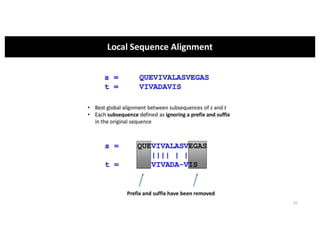
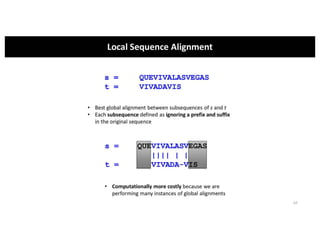
Download to read offline

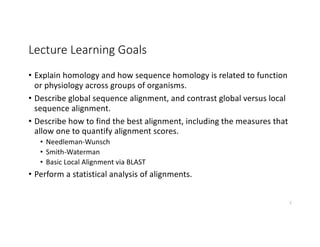
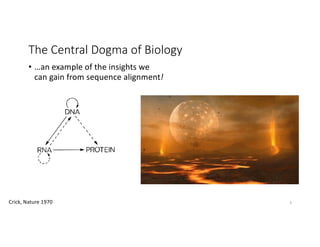
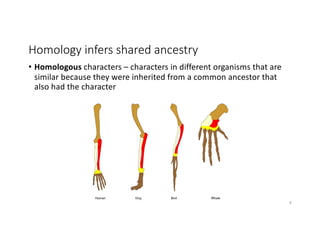
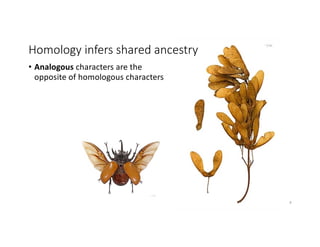
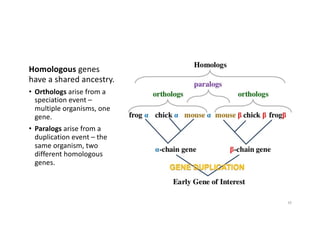
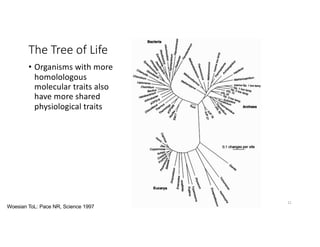
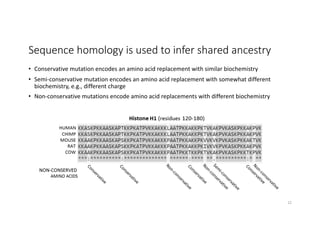
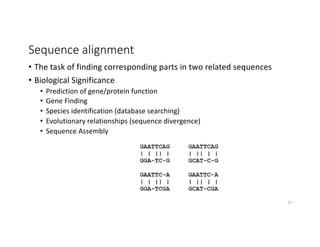
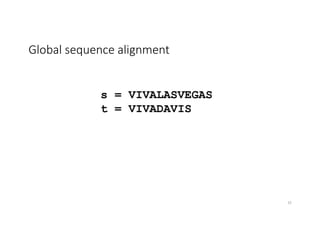
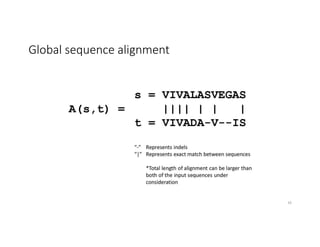
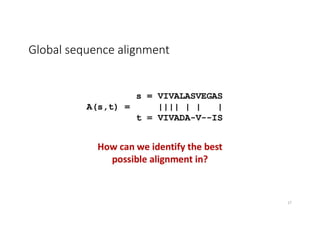
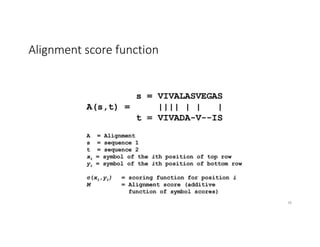
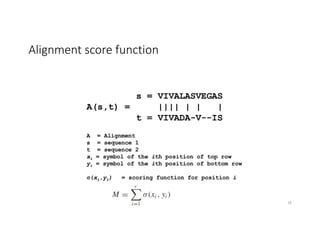
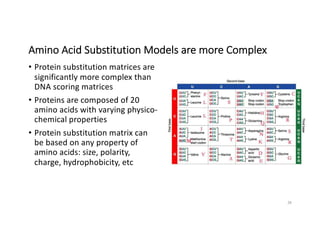
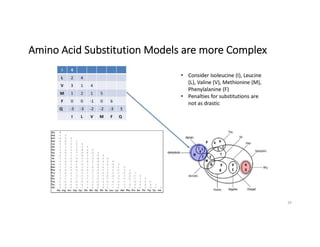
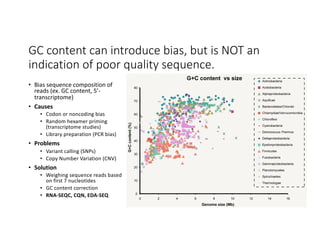
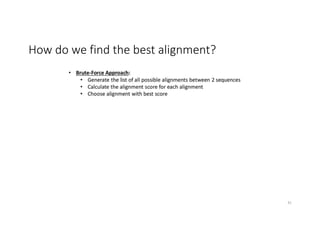
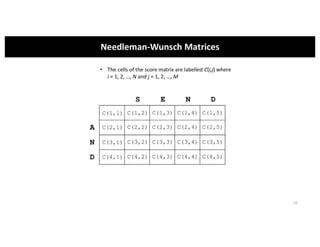
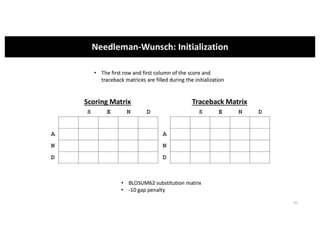
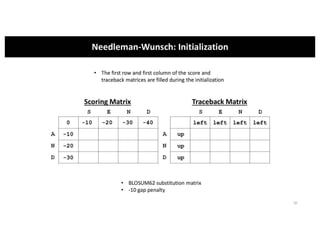
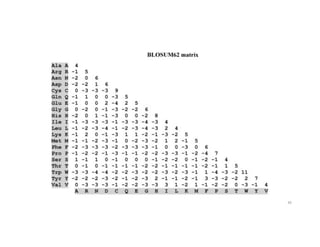
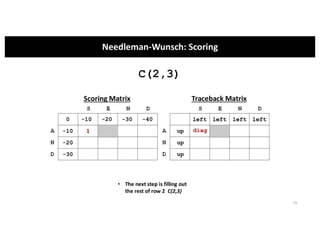
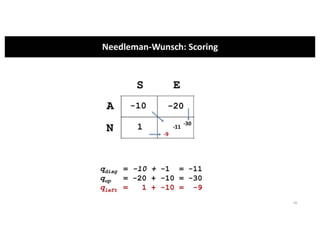
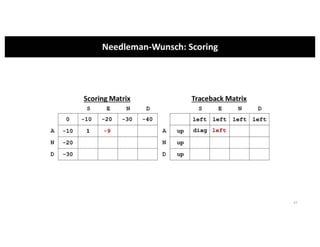
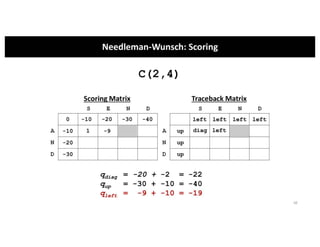
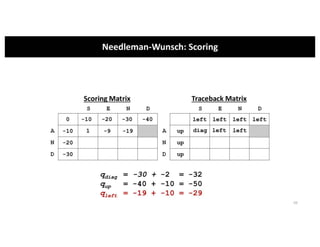
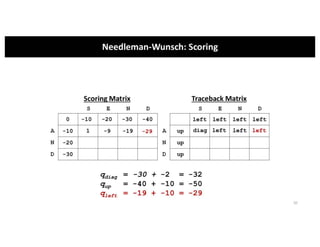
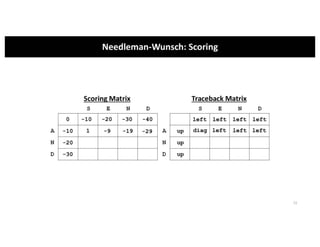
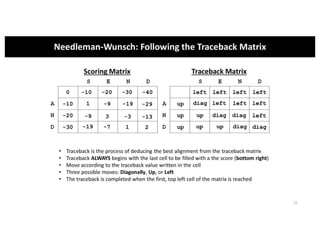
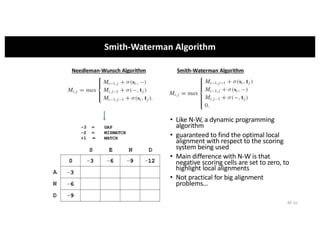

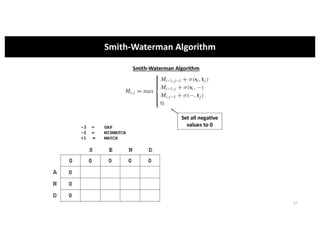


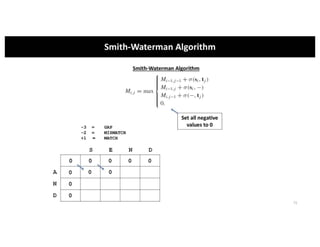
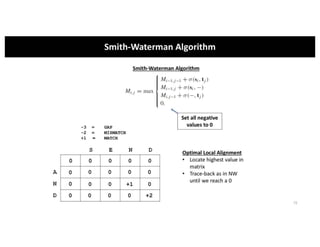
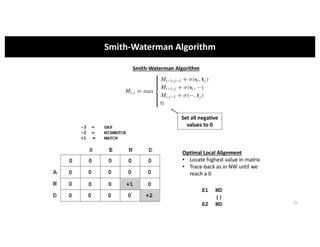
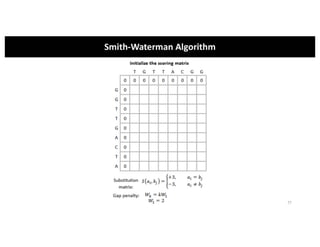
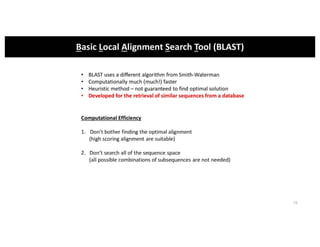
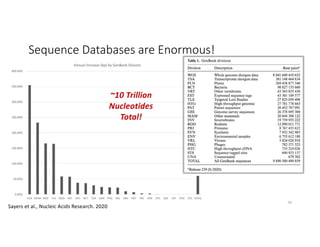
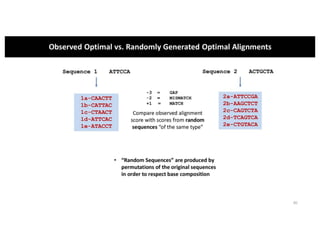
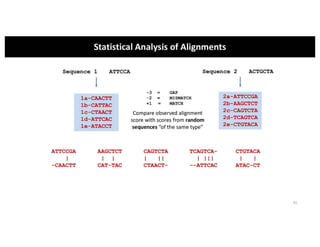
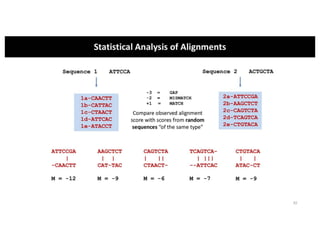
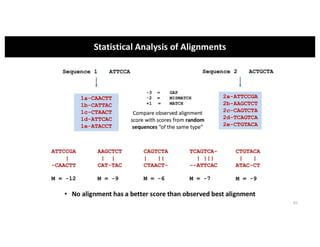
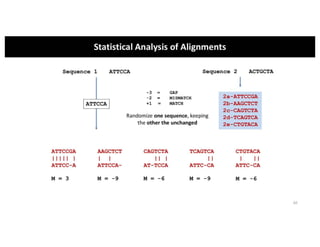
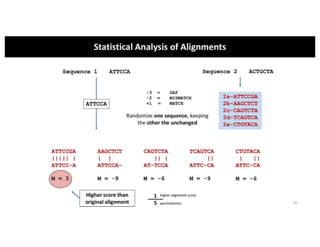
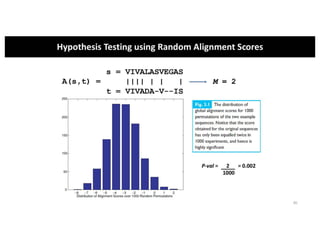
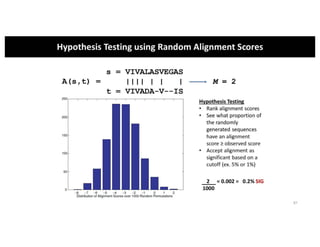
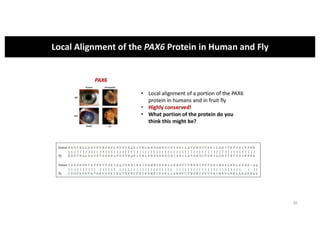
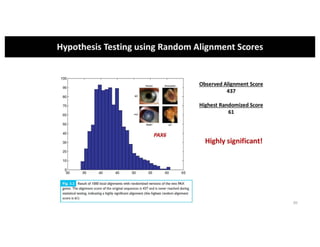


This document discusses sequence alignment and its applications in bioinformatics. It begins by explaining the goals of learning about homology and how sequence alignment relates to function across organisms. It then describes different types of sequence alignment including global, local, Needleman-Wunsch, Smith-Waterman, and BLAST. It explains how to quantify alignment scores and perform statistical analysis of alignments. The document provides examples of alignment matrices and algorithms for finding the best alignment between sequences.