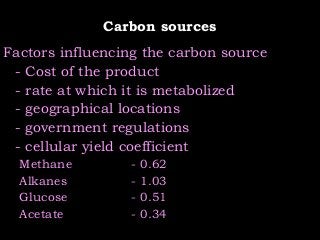
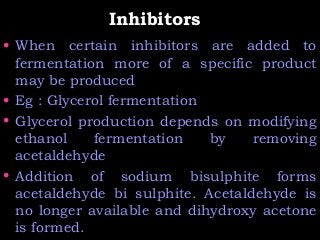
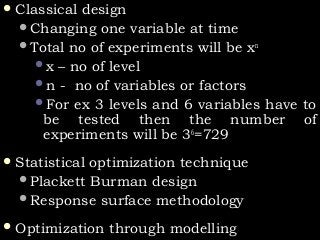

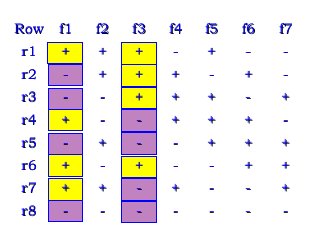
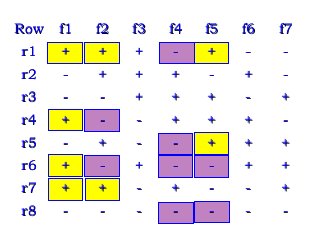
![Coding the variablesCoding the variables
Value of the variable - Middle pointValue of the variable - Middle point
Coding =Coding =
Difference/2Difference/2
Glucose = 10 – 30 g/lGlucose = 10 – 30 g/l
Coding 10 g/l glucose = [10-20]/(20/2) = -1Coding 10 g/l glucose = [10-20]/(20/2) = -1
Coding 30 g/l = ?Coding 30 g/l = ?
Coding 20 g/l ??Coding 20 g/l ??](https://image.slidesharecdn.com/fermentationtechnologypart2-160119052344/85/Media-Formulation-Media-Optimisation-56-320.jpg?cb=1727521017)
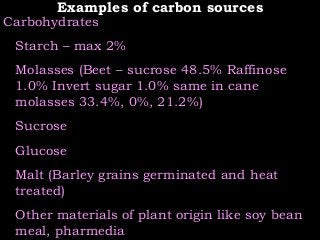
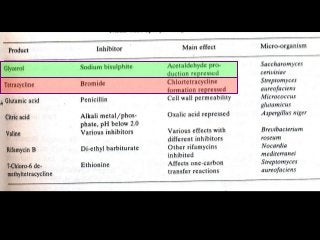
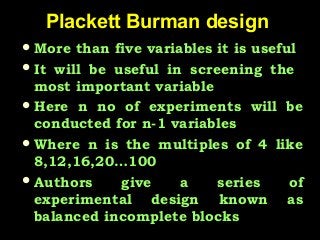
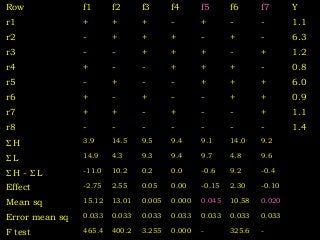
![Taylor seriesTaylor series
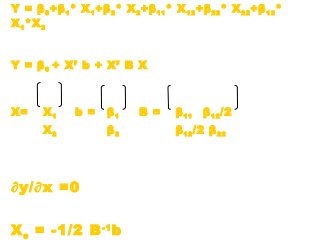
Yield Y =Yield Y = ββ00 ++ ββ11 XX11 ++ ββ1111 XX11
22
Constant term + Linear term + Quadratic termConstant term + Linear term + Quadratic term
Y=Y= ββ00 ++ ββ11 XX11 ++ ββ22 XX22 ++ ββ1111 XX11
22
++ ββ2222 XX22
22
++ ββ1212 XX11 XX22
αα = [2= [2nn
]]1/41/4](https://image.slidesharecdn.com/fermentationtechnologypart2-160119052344/85/Media-Formulation-Media-Optimisation-57-320.jpg?cb=1727521017)
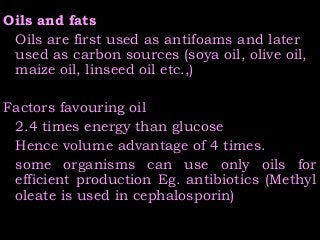
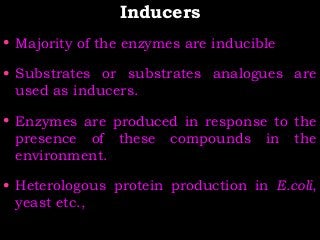
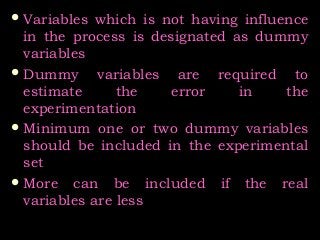
![Design of experimentsDesign of experiments
[0,0]
[-1,-1]
[+1,+1]
[+1,_1]
[-1,+1]
[-1.414,0] [+1.414,0]
[0,+1.414]
[0,-1.414,0]
Variable 1
Variable2](https://image.slidesharecdn.com/fermentationtechnologypart2-160119052344/85/Media-Formulation-Media-Optimisation-58-320.jpg?cb=1727521017)
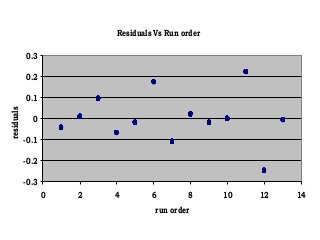
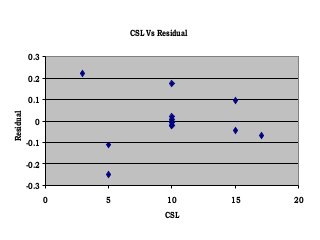
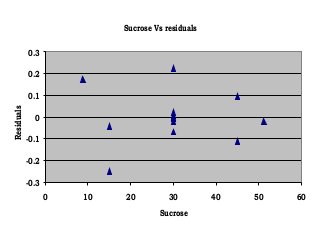
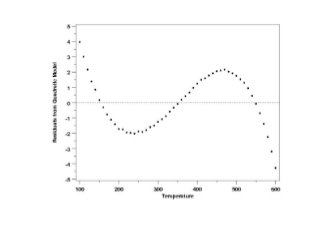

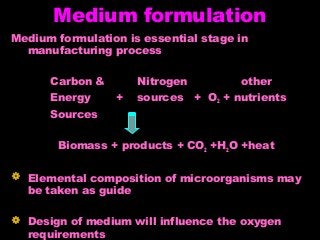
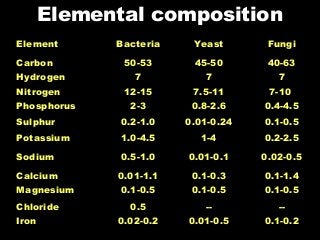
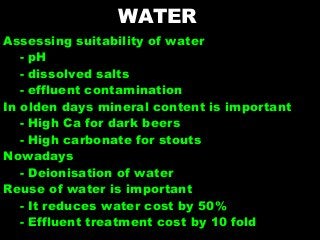
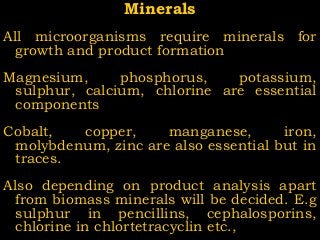
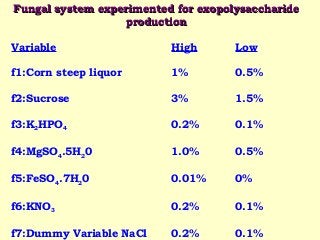
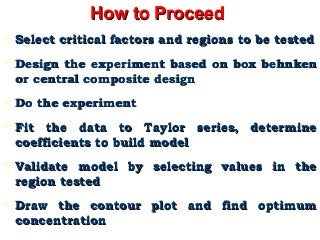
The document discusses the criteria and formulation of effective growth mediums for microbial production processes, emphasizing aspects like yield, consistency, and the influence of nutrients on biomass and product formation. It details the importance of optimizing medium composition including carbon, nitrogen, and mineral sources, as well as the role of growth factors and inhibitors in fermentation. Additionally, it addresses the complexity of scale-up challenges, the economic implications of medium costs, and optimization techniques for maximizing production efficiency.


![Solid state fermentation [fermentation type].pptx](https://cdn.slidesharecdn.com/ss_thumbnails/solidstatefermentation-240109180817-b91a86e4-thumbnail.jpg?width=640&height=640&fit=bounds)


