Downloaded 2,211 times

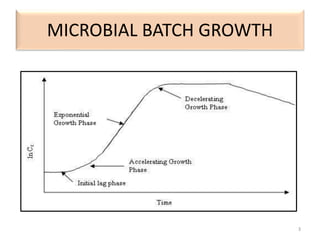
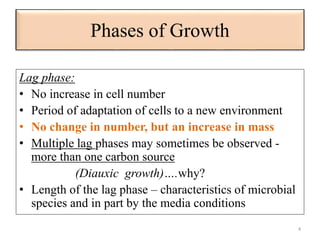

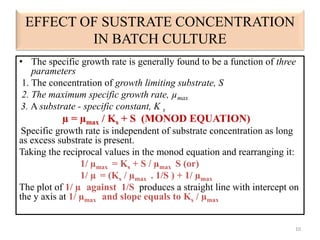
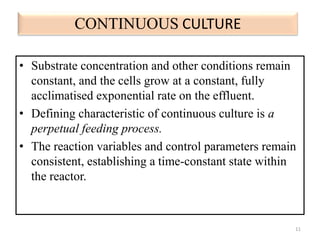
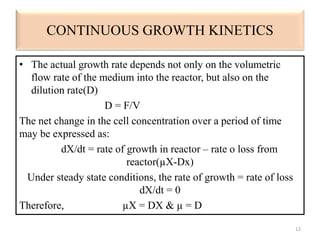
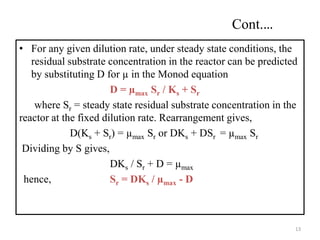
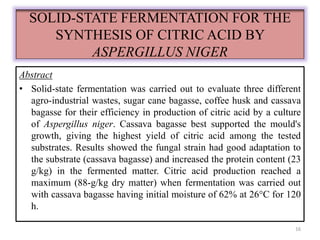
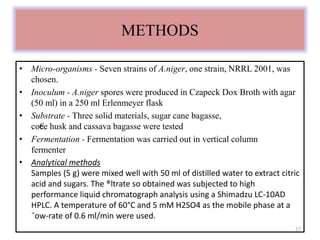


The document details microbial growth kinetics, outlining phases such as lag, log, stationary, and death phases, as well as factors affecting growth. It explains continuous culture systems, the significance of substrate concentration, and the Monod equation. Additionally, it discusses solid-state fermentation for citric acid production using different substrates, highlighting that cassava bagasse yielded the highest citric acid concentration.


