Downloaded 244 times

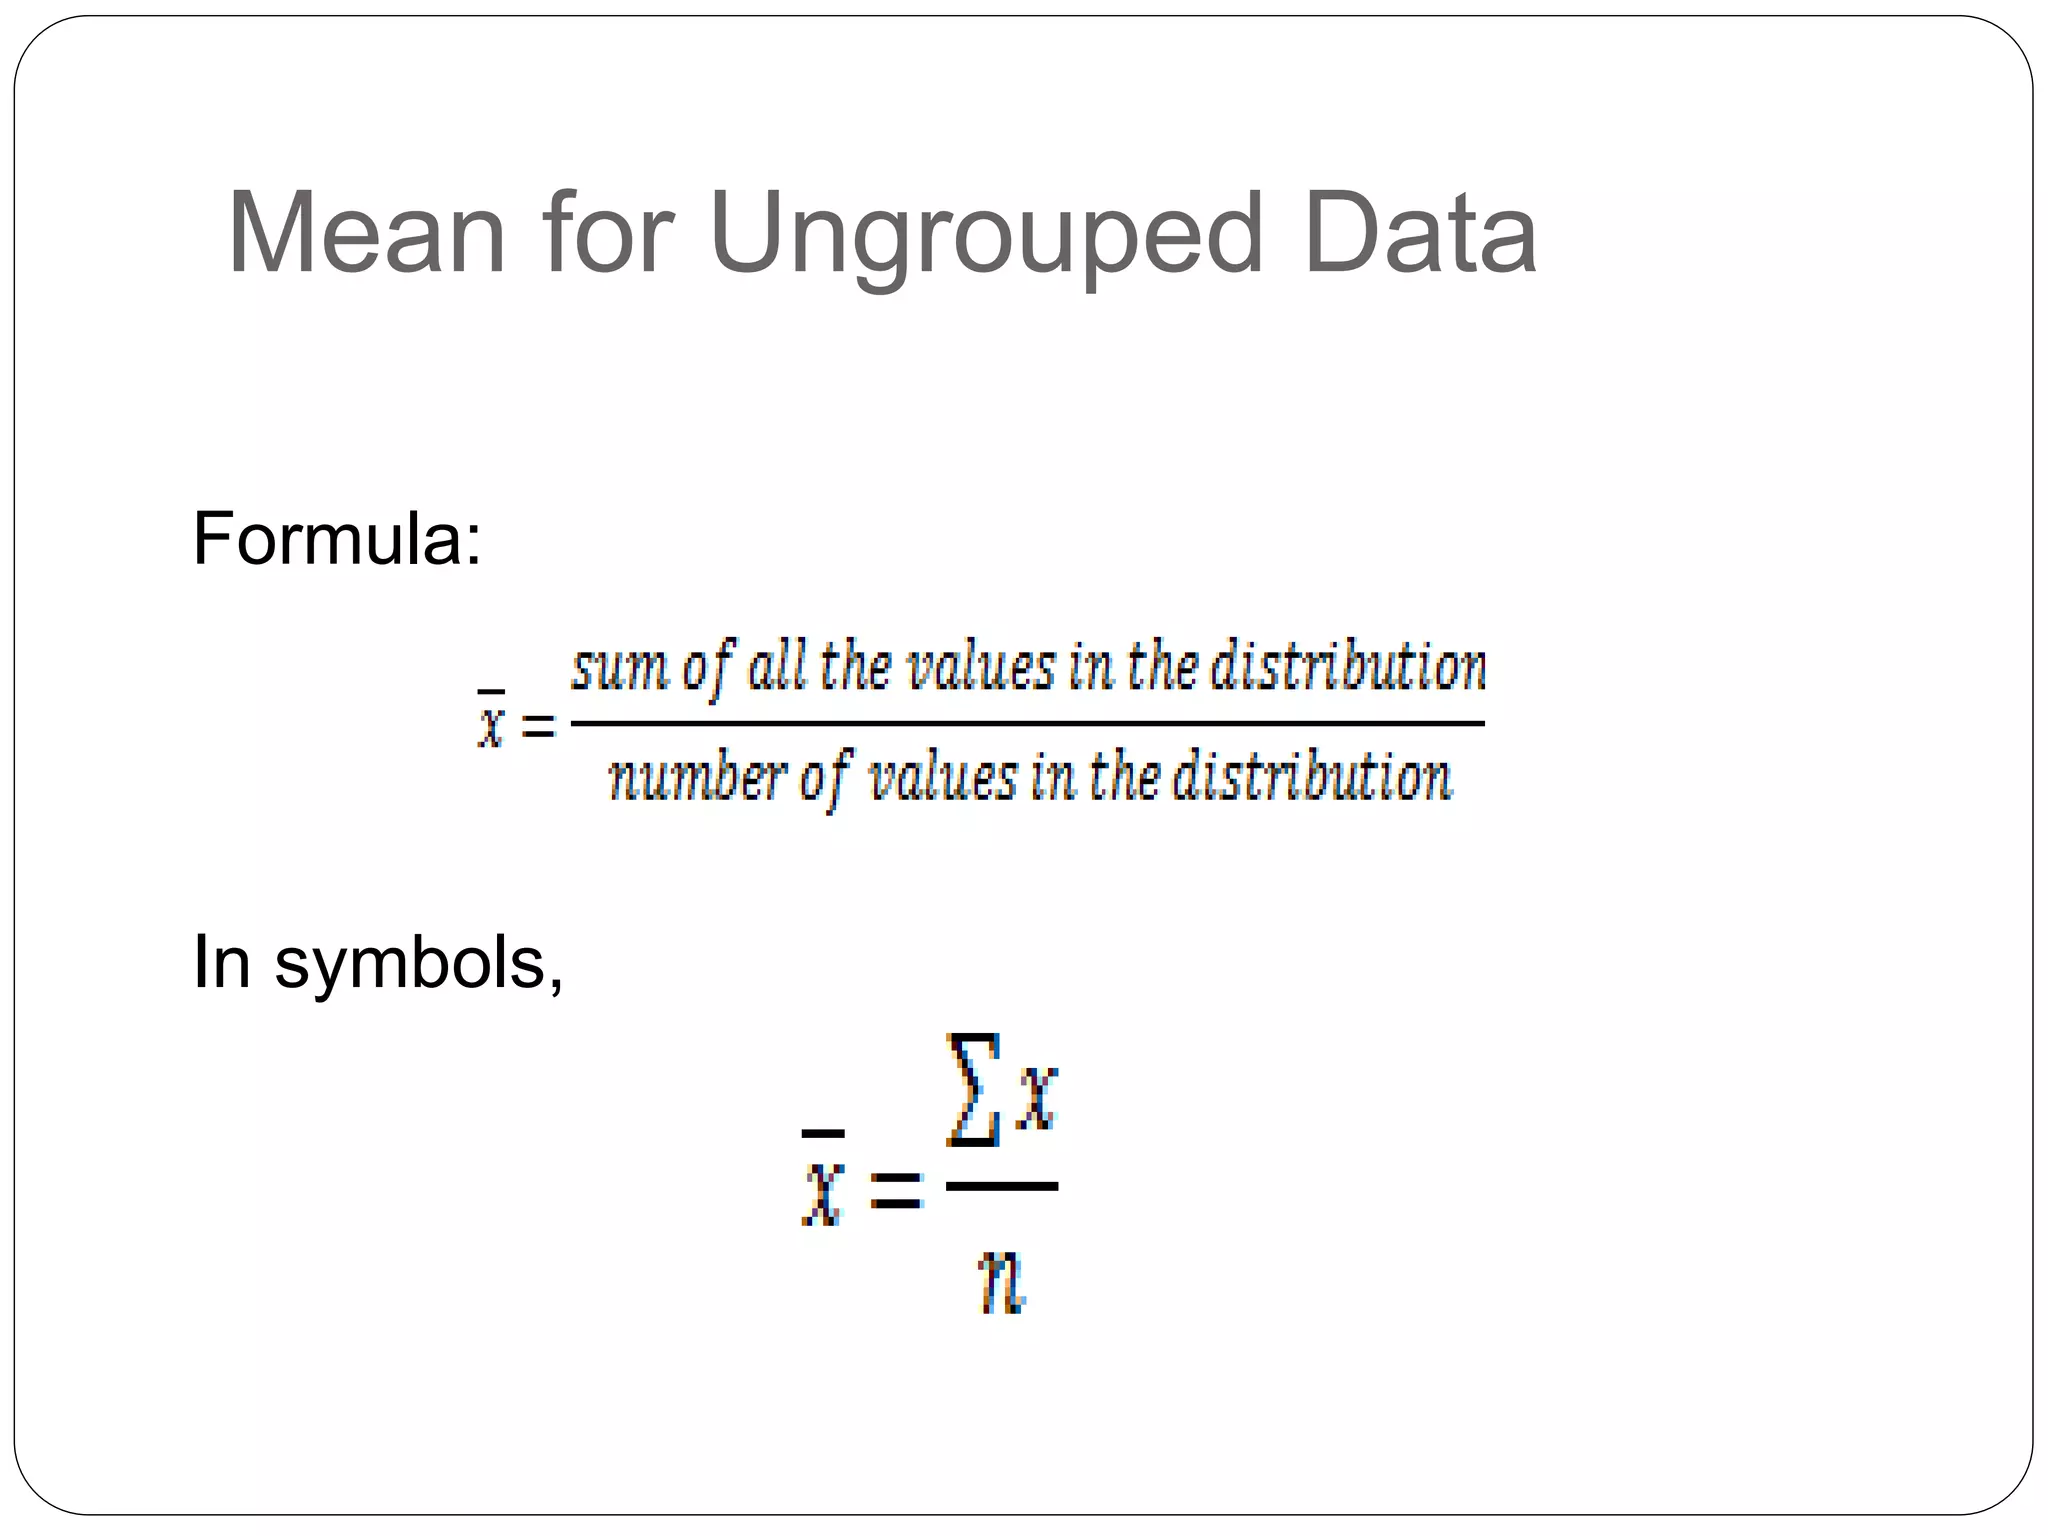


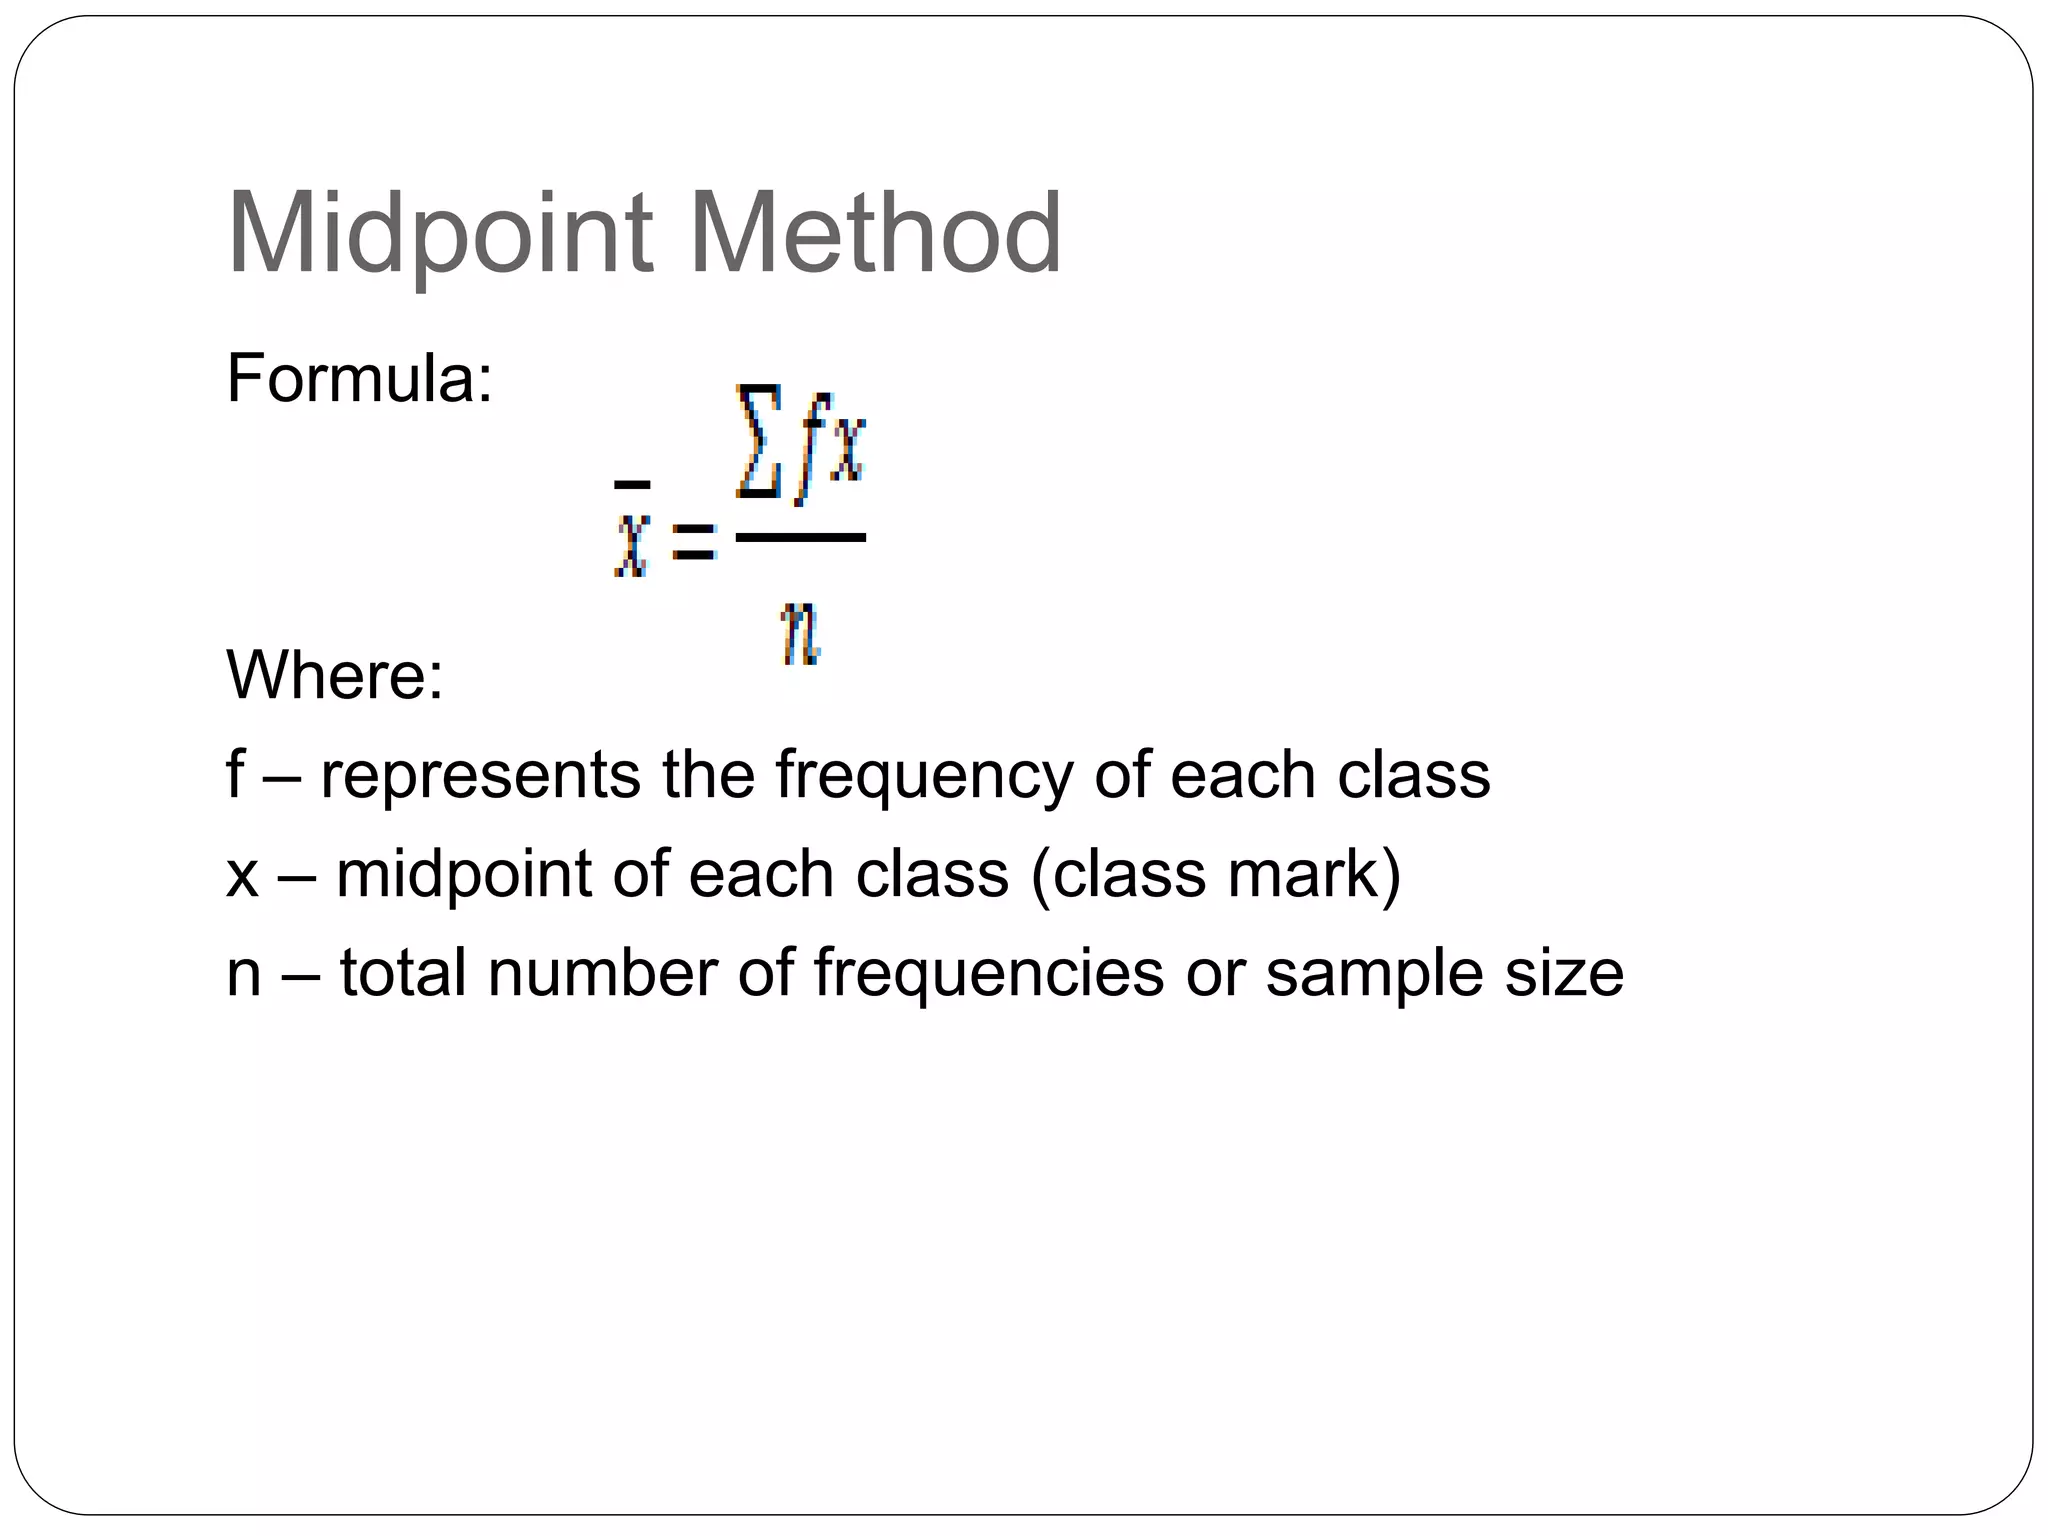


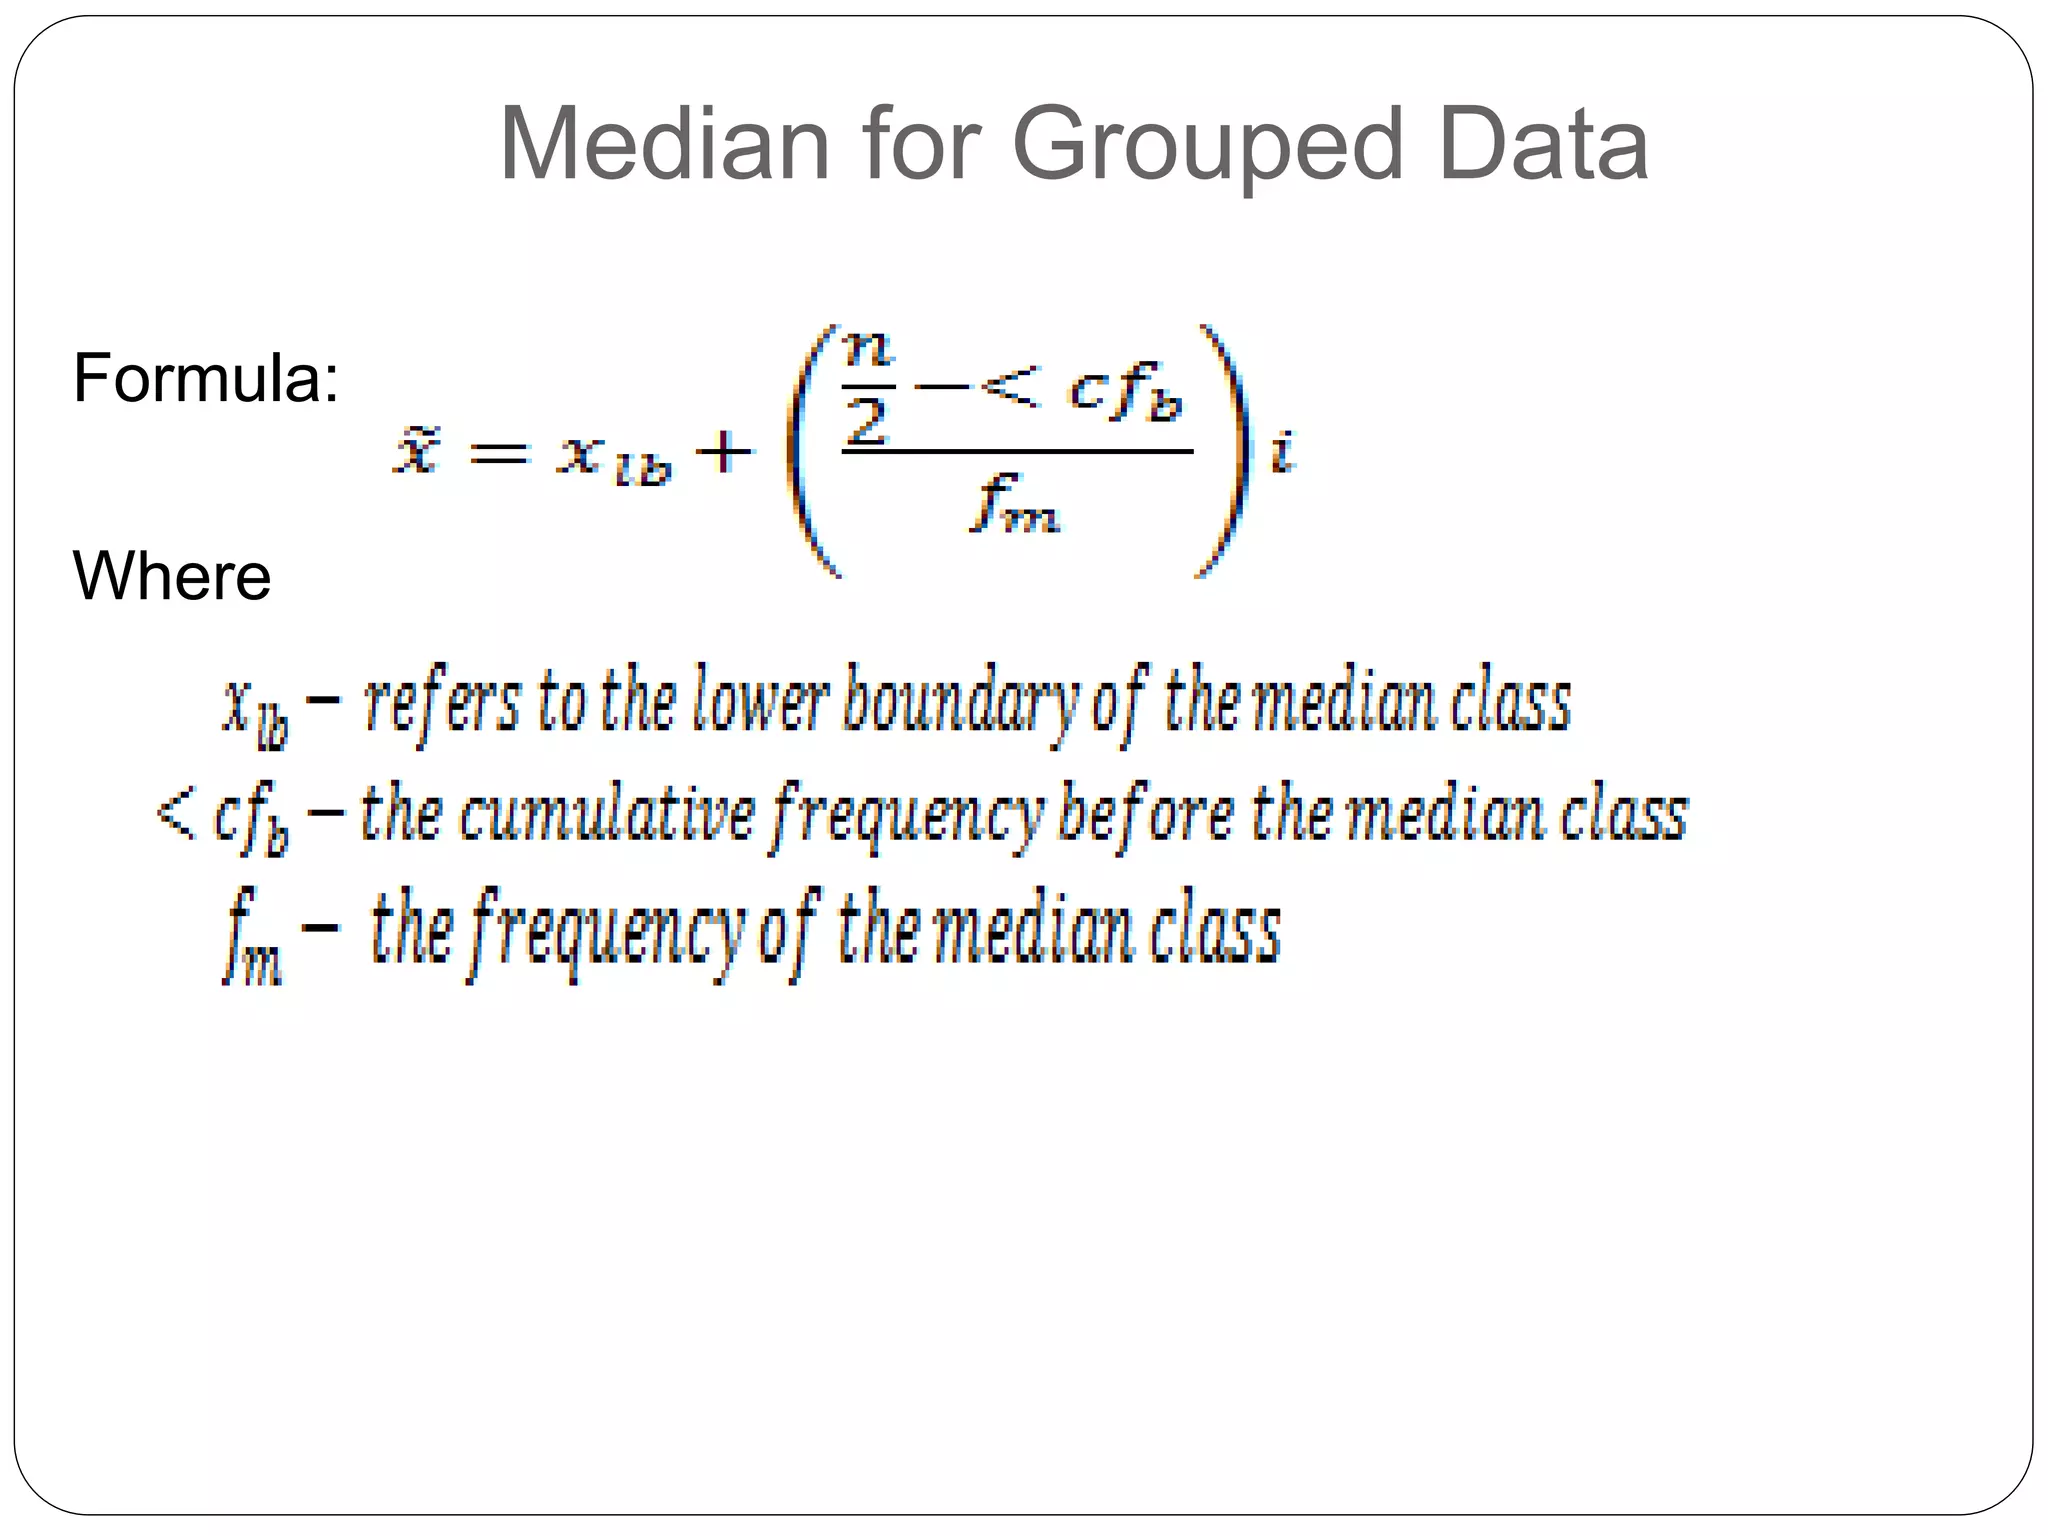


This document discusses different measures of central tendency including the mean, median, and mode. It provides formulas and step-by-step examples for calculating the mean, median, and mode for both ungrouped and grouped data. For the mean, it demonstrates how to calculate the weighted mean and the mean for grouped data using the midpoint and unit deviation methods. For the median and mode, it shows how to find the value for both ungrouped and grouped numerical data.


![MEASURES-OF-CENTRAL-TENDENCIES-1[1] [Autosaved].pptx](https://cdn.slidesharecdn.com/ss_thumbnails/measures-of-central-tendencies-11autosaved-220906145428-d730d0eb-thumbnail.jpg?width=640&height=640&fit=bounds)


