Downloaded 102 times
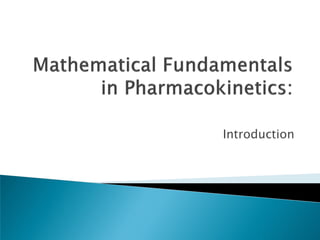


![Trapezoidal Rule
• The area between time intervals is the area of
a trapezoid and can be calculated with the
following formula:
1
1
21
nn
nnt
t tt
CC
AUC n
n
Where:
[AUC] = area under the curve.
tn = time of observation of drug concentration Cn
tn – 1 = time of prior observation of drug concentration
corresponding to C n – 1.](https://image.slidesharecdn.com/mathfundamentalsnew-170612094220/85/Math-fundamentals-18-320.jpg)


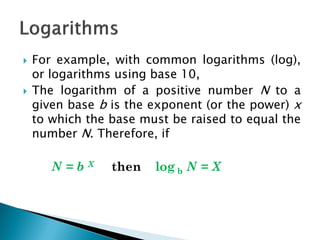
![Comparison
First Order Elimination
[drug] decreases
exponentially w/ time
Rate of elimination is
proportional to [drug]
Plot of log [drug] or
ln[drug] vs. time are
linear
t 1/2 is constant regardless
of [drug]
Zero Order Elimination
[drug] decreases linearly
with time
Rate of elimination is
constant
Rate of elimination is
independent of [drug]
No true t 1/2](https://image.slidesharecdn.com/mathfundamentalsnew-170612094220/85/Math-fundamentals-55-320.jpg)

This document provides an overview of key mathematical concepts used in pharmacokinetics, including: 1) Pharmacokinetics relies on principles of algebra, calculus, exponents and logarithms. Calculations can be done with pencil and paper. 2) Integral and differential calculus are used to model drug concentrations over time and cumulative responses in the body. 3) The trapezoidal rule is commonly used to calculate the area under the curve from plasma drug concentration versus time data.


