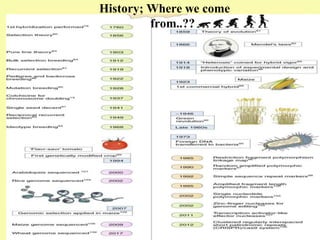
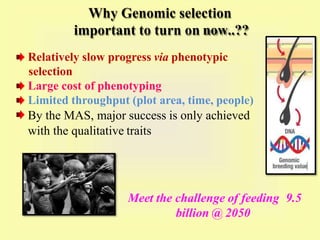
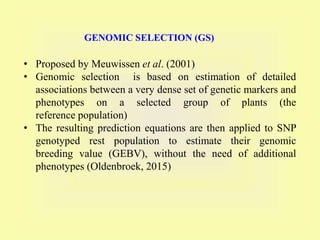
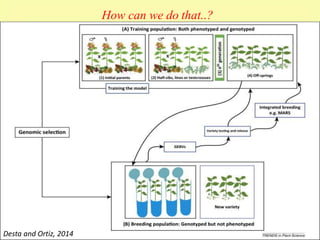
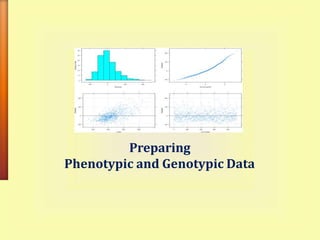
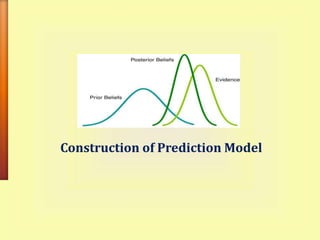
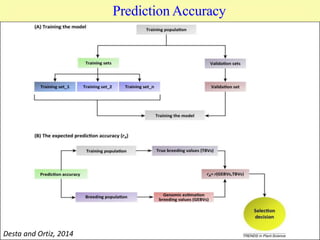
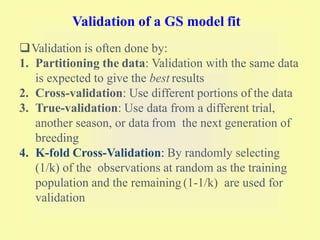
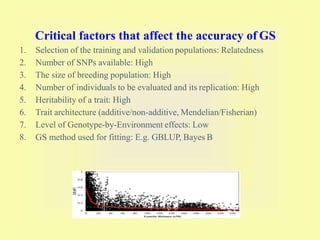
Introduction:
Proposed by Meuwissen et al. (2001)
GS is a specialized form of MAS, in which information from genotype data on marker alleles covering the entire genome forms the basis of selection.
The effects associated with all the marker loci, irrespective of whether the effects are significant or not, covering the entire genome are estimated.
The marker effect estimates are used to calculate the genomic estimated breeding values (GEBVs) of different individuals/lines, which form the basis of selection.
Why to go for genomic selection:
Marker-assisted selection (MAS) is well-suited for handling oligogenes and quantitative trait loci (QTLs) with large effects but not for minor QTLs.
MARS attempts to take into account small effect QTLs by combining trait phenotype data with marker genotype data into a combined selection index.
Based on markers showing significant association with the trait(s) and for this reason has been criticized as inefficient
The genomic selection (GS) scheme was to rectify the deficiency of MAS and MARS schemes. The GS scheme utilizes information from genome-wide marker data whether or not their associations with the concerned trait(s) are significant.
GEBV: GenomicEstimated Breeding Values-
The sum total of effects associated with all the marker alleles present in the individual and included in the GS model applied to the population under selection
Calculated on a single individual basis
Gene-assisted genomic selection:
A GS model that uses information about prior known QTLs, the targeted QTLs were accumulated in much higher frequencies than when the standard ridge regression was used
The sum total of effects associated with all the marker alleles present in the individual and included in the GS model applied to the population under selection
Calculated on a single individual basis
Population used:
Training population: used for training of the GS model and for obtaining estimates of the marker-associated effects needed for estimation of GEBVs of individuals/lines in the breeding population.
Breeding population: the population subjected to GS for achieving the desired improvement and isolation of superior lines for use as new varieties/parents of new improved hybrids.
Training population-
large enough: must be representative of the breeding population: max. trait variance with marker : by cluster analysis
should have either equal or comparable LD, LD decay rates with breeding populations
Updated by including individuals/lines from the breeding population
Training more than one generation
Low colinearity between markers is needed since high colinearity tends to reduce prediction accuracy of certain GS models. (colinearity disturbed by recombination)
Presentation delivered by Dr. Jesse Poland (Kansas State University, USA) at Borlaug Summit on Wheat for Food Security. March 25 - 28, 2014, Ciudad Obregon, Mexico.
http://www.borlaug100.org
Association genetics‟ or ‟association studies,” or ‟linkage disequilibrium mapping”.
Tool to resolve complex trait variation down to the sequence level by exploiting historical and evolutionary recombination events at the population level.
Natural population surveyed to determine MTA using LD.
Association mapping approaches for tagging quality traits in maizeSenthil Natesan
Association mapping has been widely used to study the genetic basis of complex traits in human and animal systems and is a very efficient and effective method for confirming candidate genes or for identifying new genes (Altshuler et al., 2008). Association mapping is now being increasingly used in a wide range of plants (Rafalski, 2010), where it appears to be more powerful than in humans or animals (Zhu et al., 2008). Unlike linkage mapping, association mapping can explore all the recombination events and mutations in a given population and with a higher resolution (Yu and Buckler, 2006). However, association mapping has a lower power to detect rare alleles in a population, even those with large effects, than linkage mapping (Hill et al., 2008). Yan et al., (2010) demonstrated that the gene encoding β-carotene hydroxylase 1 (crtRB1) underlies a principal quantitative trait locus associated with β-carotene concentration and conversion in maize kernels has been identified through candidate gene strategy of association mapping.
QTL is a gene or the chromosomal region that affects a quantitative trait, which should be polymorphic (have allelic variation) to have an effect in a population, must be linked to a polymorphic marker allele to be detected. The QTL mapping consists of 4 steps, like the development of mapping population, generation of polymorphic marker data set among the parents, construction of linkage map, and finally the QTL analysis
All the above steps are described in these slides very briefly along with two case studies.
Association mapping, also known as "linkage disequilibrium mapping", is a method of mapping quantitative trait loci (QTLs) that takes advantage of linkage disequilibrium to link phenotypes to genotypes.Varioius strategey involved in association mapping is discussed in this presentation
Multiple inbred founder lines are inter-mated for several generations prior to creating inbred lines, resulting in a diverse population whose genomes are fine scale mosaics of contributions from all founders.
Advanced biometrical and quantitative genetics akshayAkshay Deshmukh
Additive and Multiplicative Model
Shifted Multiplicative Model
Analysis and Selection of Genotype
Methods and steps to select the best model
Bioplot and mapping genotype
Potential for genomic selection in indigenous cattle breeds and results of GWAS in Gir dairy cattle of Gujrat by Dr.Pravin Kandhani and Dr. Vijay Trivedi KAMDHENU UNIVERSITY GANDHINAGAR
Genomic selection changing Breeding programe around the world, talk consist of concept of Breeding, breeding value, Genomic breeding value, Genotype imputation, male calf procurement on basis of GEBV under SAG PT Project and 1000 bull genome project.
Multi-trait modeling in polygenic scores
2022.03.02 Bioinformatics seminar at University of Osaka, Japan
複数の表現型を考慮したポリジェニック・スコア解析
2022.03.02 バイオインフォマティクスセミナー @ 大阪大学
Presented by Raphael Mrode, ILRI, at the workshop on Essential Knowledge for Effective Improvement and Dissemination of Genetics in Sheep and Goats, Addis Ababa, Ethiopia, 3–5 November 2020
Dr. Jack Dekkers - Using genetic selection and genomics to combat infectious ...John Blue
Using genetic selection and genomics to combat infectious disease - Dr. Jack Dekkers, Iowa State University, from the 2017 North American PRRS/National Swine Improvement Federation Joint Meeting, December 1‐3, 2017, Chicago, Illinois, USA.
More presentations at http://www.swinecast.com/2017-north-american-prrs-nsif-joint-meeting
Next-generation sequencing has enabled clinicians and researchers alike to identify novel genetic variants associated with rare Mendelian Diseases across the human genome. To help enable researchers and clinicians understand the role of CNVs in human health and disease, Golden Helix has integrated a specialized NGS-based CNV caller capable of detecting deletion and duplication events as small as single-exons and as large as whole chromosome aneuploidy events. In this webcast, we will present our workflows that integrates the NGS-based CNV caller into SVS.
Multiple factor analysis to compare expert opinions with conservation assessm...CWR Project
Using multiple factor analysis to compare expert opinions with conservation assessment results for the wild relatives of oat (Avena sativa L.) and pigeonpea (Cajanus cajan (L.) Millsp.)
Dr. Andres Perez - PRRS Epidemiology: Best Principles of Control at a Regiona...John Blue
PRRS Epidemiology: Best Principles of Control at a Regional Level - Dr. Andres Perez, University of Minnesota, from the 2015 North American PRRS Symposium, December 4 - 5, 2015, Chicago, IL, USA.
More presentations at http://www.swinecast.com/2015-north-american-prrs-symposium
Multi-source connectivity as the driver of solar wind variability in the heli...Sérgio Sacani
The ambient solar wind that flls the heliosphere originates from multiple
sources in the solar corona and is highly structured. It is often described
as high-speed, relatively homogeneous, plasma streams from coronal
holes and slow-speed, highly variable, streams whose source regions are
under debate. A key goal of ESA/NASA’s Solar Orbiter mission is to identify
solar wind sources and understand what drives the complexity seen in the
heliosphere. By combining magnetic feld modelling and spectroscopic
techniques with high-resolution observations and measurements, we show
that the solar wind variability detected in situ by Solar Orbiter in March
2022 is driven by spatio-temporal changes in the magnetic connectivity to
multiple sources in the solar atmosphere. The magnetic feld footpoints
connected to the spacecraft moved from the boundaries of a coronal hole
to one active region (12961) and then across to another region (12957). This
is refected in the in situ measurements, which show the transition from fast
to highly Alfvénic then to slow solar wind that is disrupted by the arrival of
a coronal mass ejection. Our results describe solar wind variability at 0.5 au
but are applicable to near-Earth observatories.
Cancer cell metabolism: special Reference to Lactate PathwayAADYARAJPANDEY1
Normal Cell Metabolism:
Cellular respiration describes the series of steps that cells use to break down sugar and other chemicals to get the energy we need to function.
Energy is stored in the bonds of glucose and when glucose is broken down, much of that energy is released.
Cell utilize energy in the form of ATP.
The first step of respiration is called glycolysis. In a series of steps, glycolysis breaks glucose into two smaller molecules - a chemical called pyruvate. A small amount of ATP is formed during this process.
Most healthy cells continue the breakdown in a second process, called the Kreb's cycle. The Kreb's cycle allows cells to “burn” the pyruvates made in glycolysis to get more ATP.
The last step in the breakdown of glucose is called oxidative phosphorylation (Ox-Phos).
It takes place in specialized cell structures called mitochondria. This process produces a large amount of ATP. Importantly, cells need oxygen to complete oxidative phosphorylation.
If a cell completes only glycolysis, only 2 molecules of ATP are made per glucose. However, if the cell completes the entire respiration process (glycolysis - Kreb's - oxidative phosphorylation), about 36 molecules of ATP are created, giving it much more energy to use.
IN CANCER CELL:
Unlike healthy cells that "burn" the entire molecule of sugar to capture a large amount of energy as ATP, cancer cells are wasteful.
Cancer cells only partially break down sugar molecules. They overuse the first step of respiration, glycolysis. They frequently do not complete the second step, oxidative phosphorylation.
This results in only 2 molecules of ATP per each glucose molecule instead of the 36 or so ATPs healthy cells gain. As a result, cancer cells need to use a lot more sugar molecules to get enough energy to survive.
introduction to WARBERG PHENOMENA:
WARBURG EFFECT Usually, cancer cells are highly glycolytic (glucose addiction) and take up more glucose than do normal cells from outside.
Otto Heinrich Warburg (; 8 October 1883 – 1 August 1970) In 1931 was awarded the Nobel Prize in Physiology for his "discovery of the nature and mode of action of the respiratory enzyme.
WARNBURG EFFECT : cancer cells under aerobic (well-oxygenated) conditions to metabolize glucose to lactate (aerobic glycolysis) is known as the Warburg effect. Warburg made the observation that tumor slices consume glucose and secrete lactate at a higher rate than normal tissues.
Nutraceutical market, scope and growth: Herbal drug technologyLokesh Patil
As consumer awareness of health and wellness rises, the nutraceutical market—which includes goods like functional meals, drinks, and dietary supplements that provide health advantages beyond basic nutrition—is growing significantly. As healthcare expenses rise, the population ages, and people want natural and preventative health solutions more and more, this industry is increasing quickly. Further driving market expansion are product formulation innovations and the use of cutting-edge technology for customized nutrition. With its worldwide reach, the nutraceutical industry is expected to keep growing and provide significant chances for research and investment in a number of categories, including vitamins, minerals, probiotics, and herbal supplements.
Richard's aventures in two entangled wonderlandsRichard Gill
Since the loophole-free Bell experiments of 2020 and the Nobel prizes in physics of 2022, critics of Bell's work have retreated to the fortress of super-determinism. Now, super-determinism is a derogatory word - it just means "determinism". Palmer, Hance and Hossenfelder argue that quantum mechanics and determinism are not incompatible, using a sophisticated mathematical construction based on a subtle thinning of allowed states and measurements in quantum mechanics, such that what is left appears to make Bell's argument fail, without altering the empirical predictions of quantum mechanics. I think however that it is a smoke screen, and the slogan "lost in math" comes to my mind. I will discuss some other recent disproofs of Bell's theorem using the language of causality based on causal graphs. Causal thinking is also central to law and justice. I will mention surprising connections to my work on serial killer nurse cases, in particular the Dutch case of Lucia de Berk and the current UK case of Lucy Letby.
The increased availability of biomedical data, particularly in the public domain, offers the opportunity to better understand human health and to develop effective therapeutics for a wide range of unmet medical needs. However, data scientists remain stymied by the fact that data remain hard to find and to productively reuse because data and their metadata i) are wholly inaccessible, ii) are in non-standard or incompatible representations, iii) do not conform to community standards, and iv) have unclear or highly restricted terms and conditions that preclude legitimate reuse. These limitations require a rethink on data can be made machine and AI-ready - the key motivation behind the FAIR Guiding Principles. Concurrently, while recent efforts have explored the use of deep learning to fuse disparate data into predictive models for a wide range of biomedical applications, these models often fail even when the correct answer is already known, and fail to explain individual predictions in terms that data scientists can appreciate. These limitations suggest that new methods to produce practical artificial intelligence are still needed.
In this talk, I will discuss our work in (1) building an integrative knowledge infrastructure to prepare FAIR and "AI-ready" data and services along with (2) neurosymbolic AI methods to improve the quality of predictions and to generate plausible explanations. Attention is given to standards, platforms, and methods to wrangle knowledge into simple, but effective semantic and latent representations, and to make these available into standards-compliant and discoverable interfaces that can be used in model building, validation, and explanation. Our work, and those of others in the field, creates a baseline for building trustworthy and easy to deploy AI models in biomedicine.
Bio
Dr. Michel Dumontier is the Distinguished Professor of Data Science at Maastricht University, founder and executive director of the Institute of Data Science, and co-founder of the FAIR (Findable, Accessible, Interoperable and Reusable) data principles. His research explores socio-technological approaches for responsible discovery science, which includes collaborative multi-modal knowledge graphs, privacy-preserving distributed data mining, and AI methods for drug discovery and personalized medicine. His work is supported through the Dutch National Research Agenda, the Netherlands Organisation for Scientific Research, Horizon Europe, the European Open Science Cloud, the US National Institutes of Health, and a Marie-Curie Innovative Training Network. He is the editor-in-chief for the journal Data Science and is internationally recognized for his contributions in bioinformatics, biomedical informatics, and semantic technologies including ontologies and linked data.
Seminar of U.V. Spectroscopy by SAMIR PANDASAMIR PANDA
Spectroscopy is a branch of science dealing the study of interaction of electromagnetic radiation with matter.
Ultraviolet-visible spectroscopy refers to absorption spectroscopy or reflect spectroscopy in the UV-VIS spectral region.
Ultraviolet-visible spectroscopy is an analytical method that can measure the amount of light received by the analyte.
1. Genomic Selection in Plants
PRAKASH N. TIWARI
PhD Scholar
Biotechnology Centre
JNKVV, Jabalpur
2. Presentation Overview
Introduction (GS)
Preparation of phenotypic and
genotypic data
Construction of GS model
Fitting and evaluation of GS model
GS in breeding programs
Case study
4. Why Genomic selection
important to turn on now..??
Relatively slow progress via phenotypic
selection
Large cost of phenotyping
Limited throughput (plot area, time, people)
By the MAS, major success is only achieved
with the qualitative traits
Meet the challenge of feeding 9.5
billion @ 2050
5. GENOMIC SELECTION (GS)
• Proposed by Meuwissen et al. (2001)
• Genomic selection is based on estimation of detailed
associations between a very dense set of genetic markers and
phenotypes on a selected group of plants (the
reference population)
• The resulting prediction equations are then applied to SNP
genotyped rest population to estimate their genomic
breeding value (GEBV), without the need of additional
phenotypes (Oldenbroek, 2015)
8. • Phenotypic data often comes messy and unbalanced, and needs to be pre-
processed prior to be used in fitting any GS model
• Often it is a two-stage process: 1) obtain single observation foreach
genotype as mean, 2) fit a GS model
• Most genotypic data used in GS comes as large datasets with thousand of
SNPs
• Molecular matrix for GBLUP is prepared by inversing molecular-based
genomic matrix (GA)
10. Range: -0.0190 ~ 0
Mean: -0.00021
SD: 0.00380
Model construction:
Breeding Value (BV) + Molecular Markers
p
o Using the current breeding population phenotype and molecular markers
capturing most of the quantitative variation
Quantitative phenotypic information Genotypic information
Construction of Prediction Models
Where, y is a vector of trait phenotype, μ is an overall phenotype mean, k represents the locus, xk is the allelic state at
the locus k, βk is marker effect at the locus k, and e is the vector of random residual effects
In xk, the allelic state of individuals can be coded as a matrix of 1, 0, or 1 to a diploid genotype value of AA, AB, or BB,
respectively
Breeding value = h2 (crop production - average)
yk xkk e
1
11. Select most significant markers on the basis of arbitrary
significant thresholds and non significant markers effect
equals to zero
A. Stepwise Regression (SR)
B. Ridge Regression BLUP (RR-BLUP)
Simultaneously select all marker effects rather than
categorizing into significant or having no effect
C. Bayesian Regression (BR)
Marker variance treated more realistically specified
prior distribution
Types of prediction models
13. SOFTWARE FOR GBLUP
GA Matrix Preparation
1. TASSEL (Bradbury et al. 2007)
2. rr-BLUP R package (Endelman 2011)
3. GenoMatrix (Nazarian and Gezan, 2015)
Performs quality control of marker data
Constructs and manipulates GA and Arelationship matrices
Fitting GBLUPModel
• ASReml-R package (Butler et al. 2007)
Package that fits linear mixed models to moderately large data
sets
Useful for analysis of large and complex dataset
Reads GA (or its inverse)
16. Validation of a GS model fit
Validation is often done by:
1. Partitioning the data: Validation with the same data
is expected to give the best results
2. Cross-validation: Use different portions of the data
3. True-validation: Use data from a different trial,
another season, or data from the next generation of
breeding
4. K-fold Cross-Validation: By randomly selecting
(1/k) of the observations at random as the training
population and the remaining (1-1/k) are used for
validation
17. Critical factors that affect the accuracy of GS
1. Selection of the training and validation populations: Relatedness
2. Number of SNPs available: High
3. The size of breeding population: High
4. Number of individuals to be evaluated and its replication: High
5. Heritability of a trait: High
6. Trait architecture (additive/non-additive, Mendelian/Fisherian)
7. Level of Genotype-by-Environment effects: Low
8. GS method used for fitting: E.g. GBLUP, Bayes B
20. Standard Genomic Assisted Breeding Scheme Showing
one cross Using Barley Double Haploid Lines
Triangles indicate steps where material is selected and reduced using genomic selection. P1 = Parent
one, P2 = Parent 2, F1 = offspring/hybrid, DH = Double Haploids, PYT = Preliminary Yield Trial, AYT =
Advanced Yield Trial, YET = Elite Yield Trial
21. Genomic Selection Across Generations
Red curved arrows show how information for GS could be used across generations. DH=Double Haploids,
PYT = Preliminary Yield Trial, AYT = Advanced Yield Trial, YET = Elite Yield Trial, Yr = Year
26. Result
Using a breeding index combining 10 traits, they identified the top and
bottom 200 predicted hybrids
This will increase the opportunity of selecting true superior hybrids
with
SNP genotypes of the training population and parameters estimated
from this training population are available for general uses and further
validation in genomic hybrid prediction of all potential hybrids
generated from all varieties of rice
29. Result
Genomic selection with TS and OCS led to a 25 ± 12% and 34 ± 6.4%
increase in wheat grain fructan content, respectively
Although positive gains from selection were observed for both
populations, OCS populations exhibited these gains while
simultaneously retaining greater genetic variance and lower
inbreeding levels relative to TS populations
Selection for wheat grain fructan content did not change plant height
but significantly decreased days to heading in OCS populations
In this study, GS effectively improved the nutritional quality of wheat,
and OCS controlled the rate of inbreeding