Download as PDF, PPTX

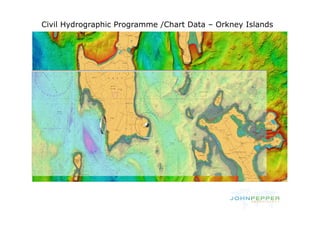
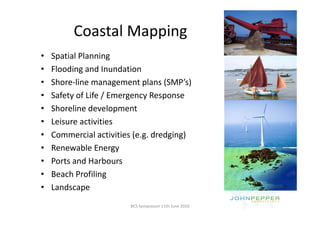
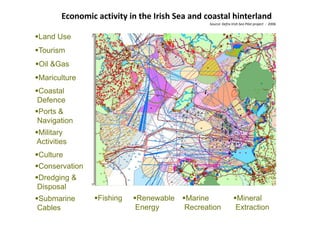
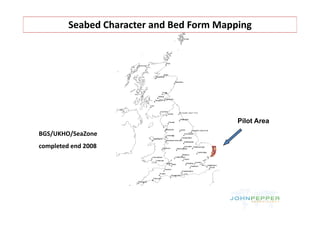
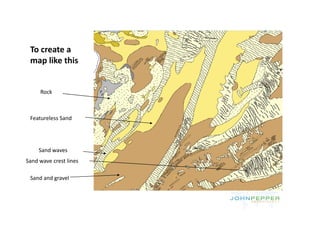
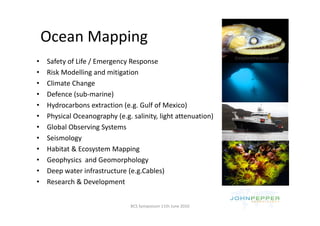
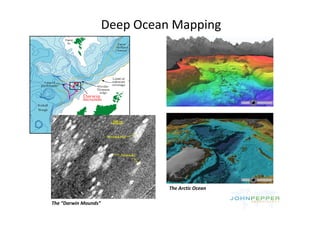
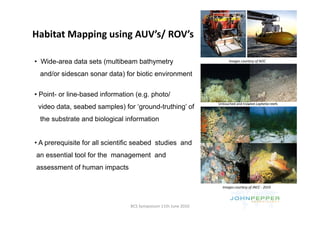
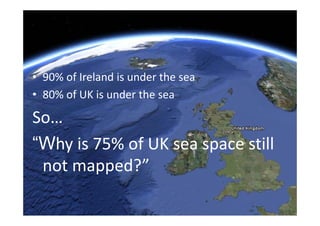


Mapping UK Sea Space involves creating accurate maps of the seafloor and coastal areas through technologies like sonar, LiDAR and aerial imagery. These maps are important for navigation safety, managing human activities like fishing and offshore energy, and understanding the marine environment. While some areas have been mapped, most of the seafloor remains unexplored. New mapping techniques and tools are needed to address this challenge and support uses of the ocean, from infrastructure planning to habitat protection.


![Aerospace Engineering IIG Presentation[1]](https://cdn.slidesharecdn.com/ss_thumbnails/aerospaceengineeringiigpresentation1-091210084337-phpapp01-thumbnail.jpg?width=640&height=640&fit=bounds)


