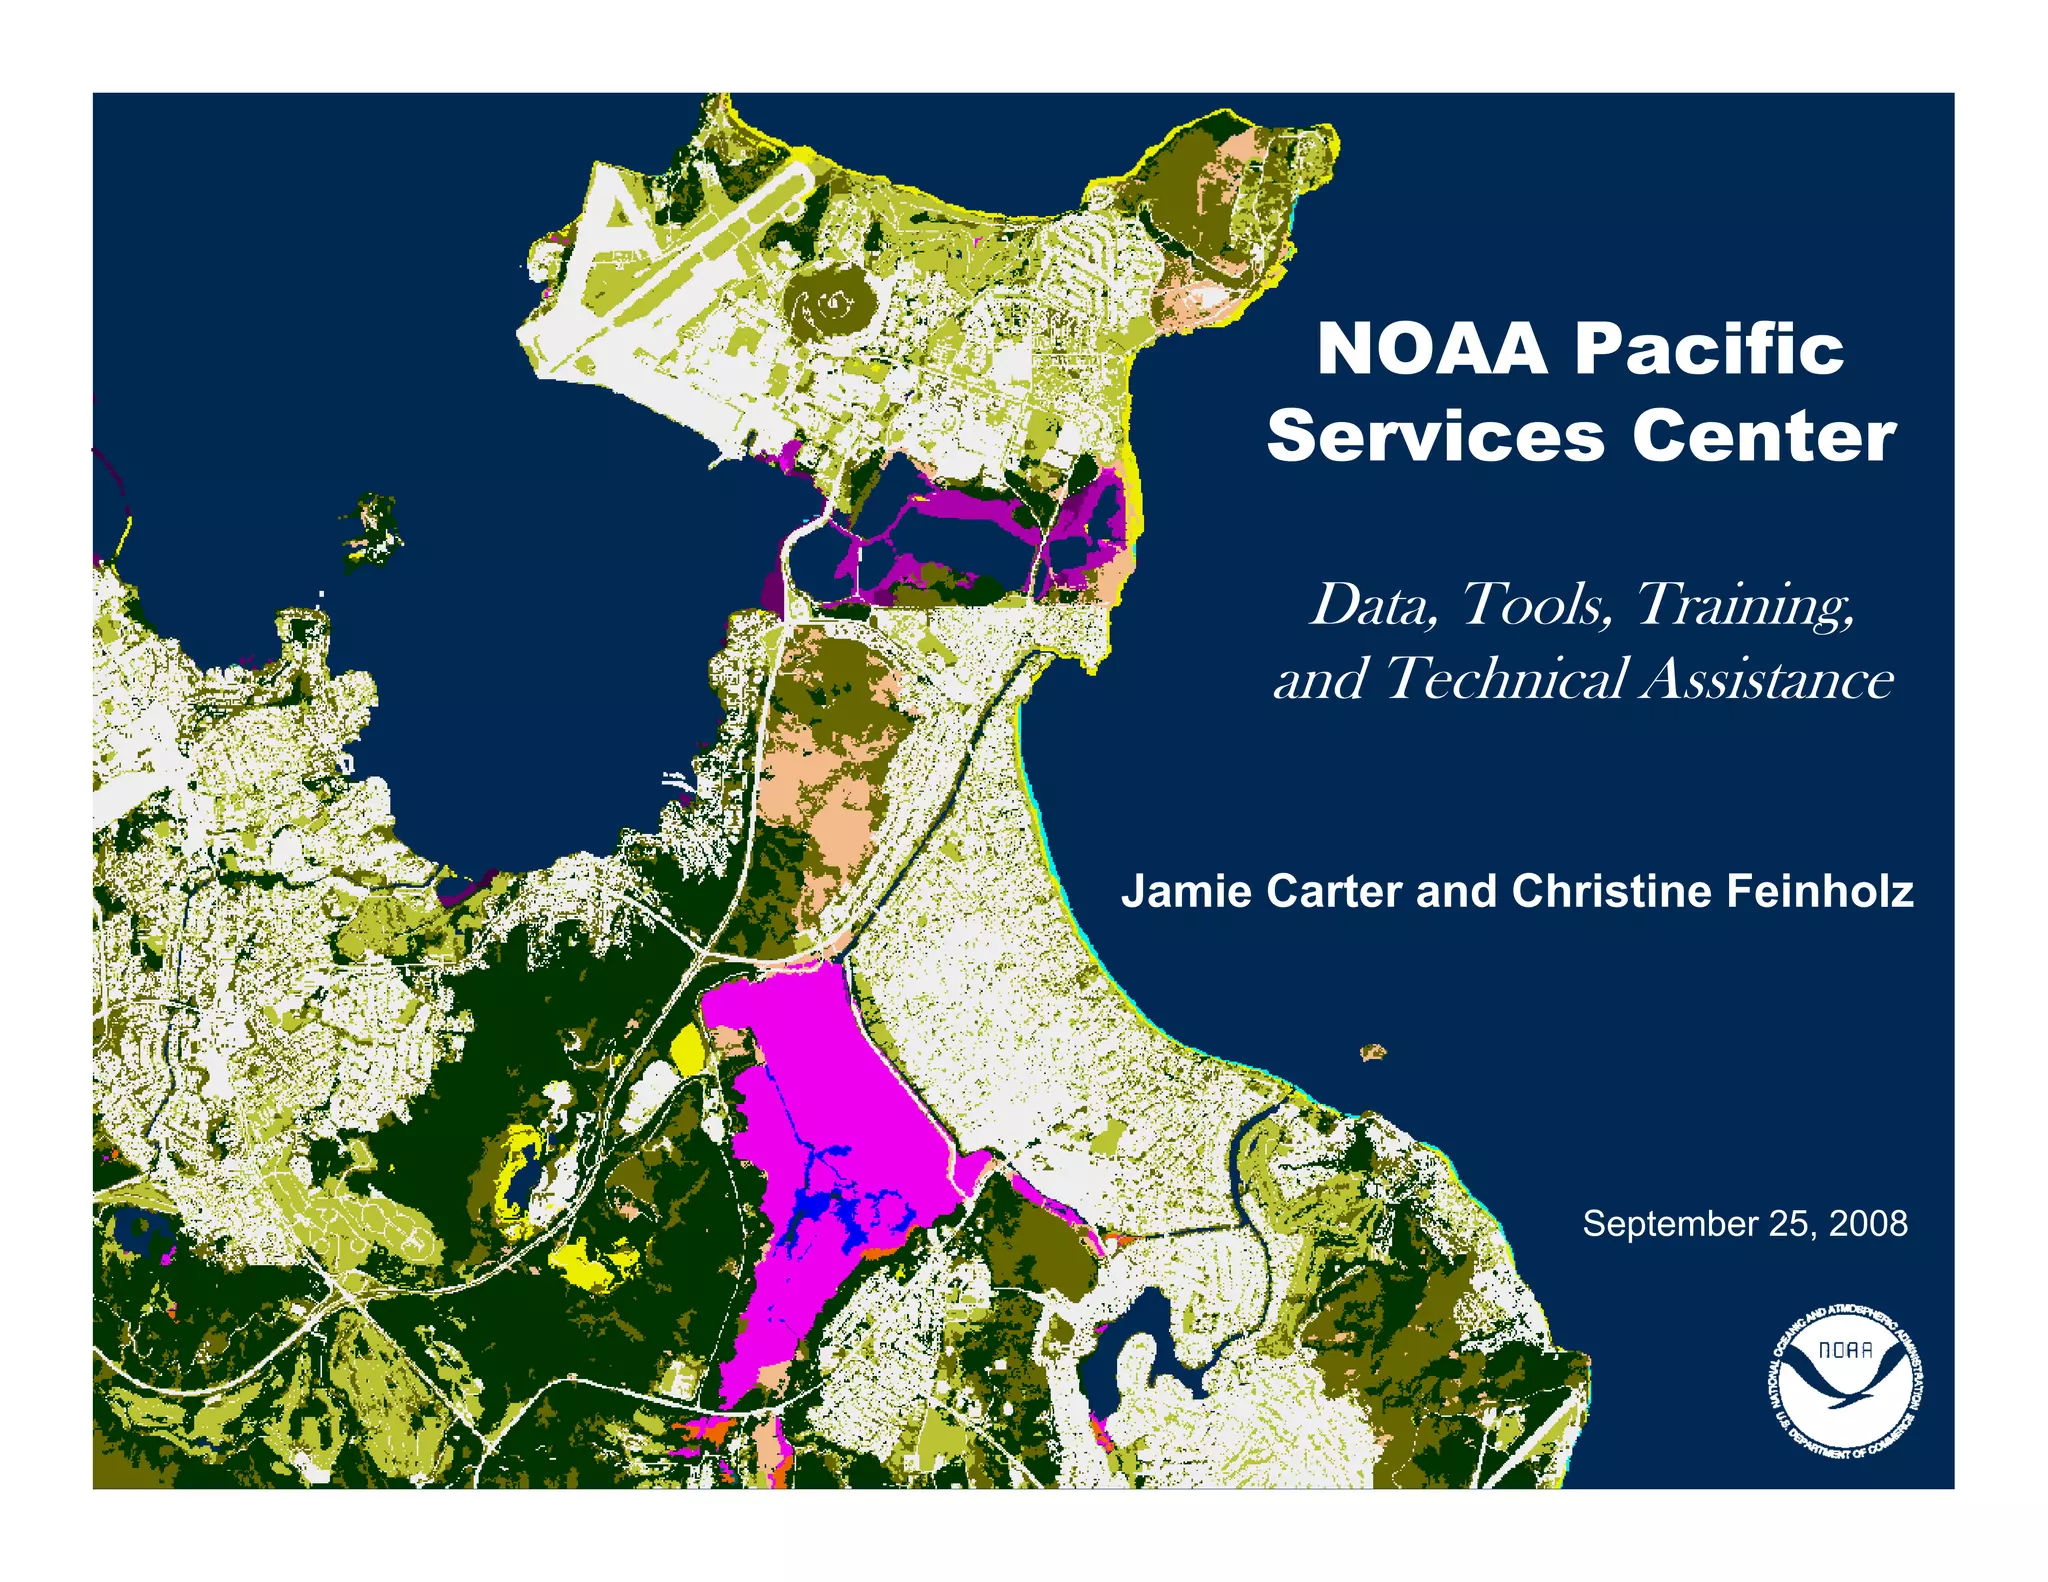
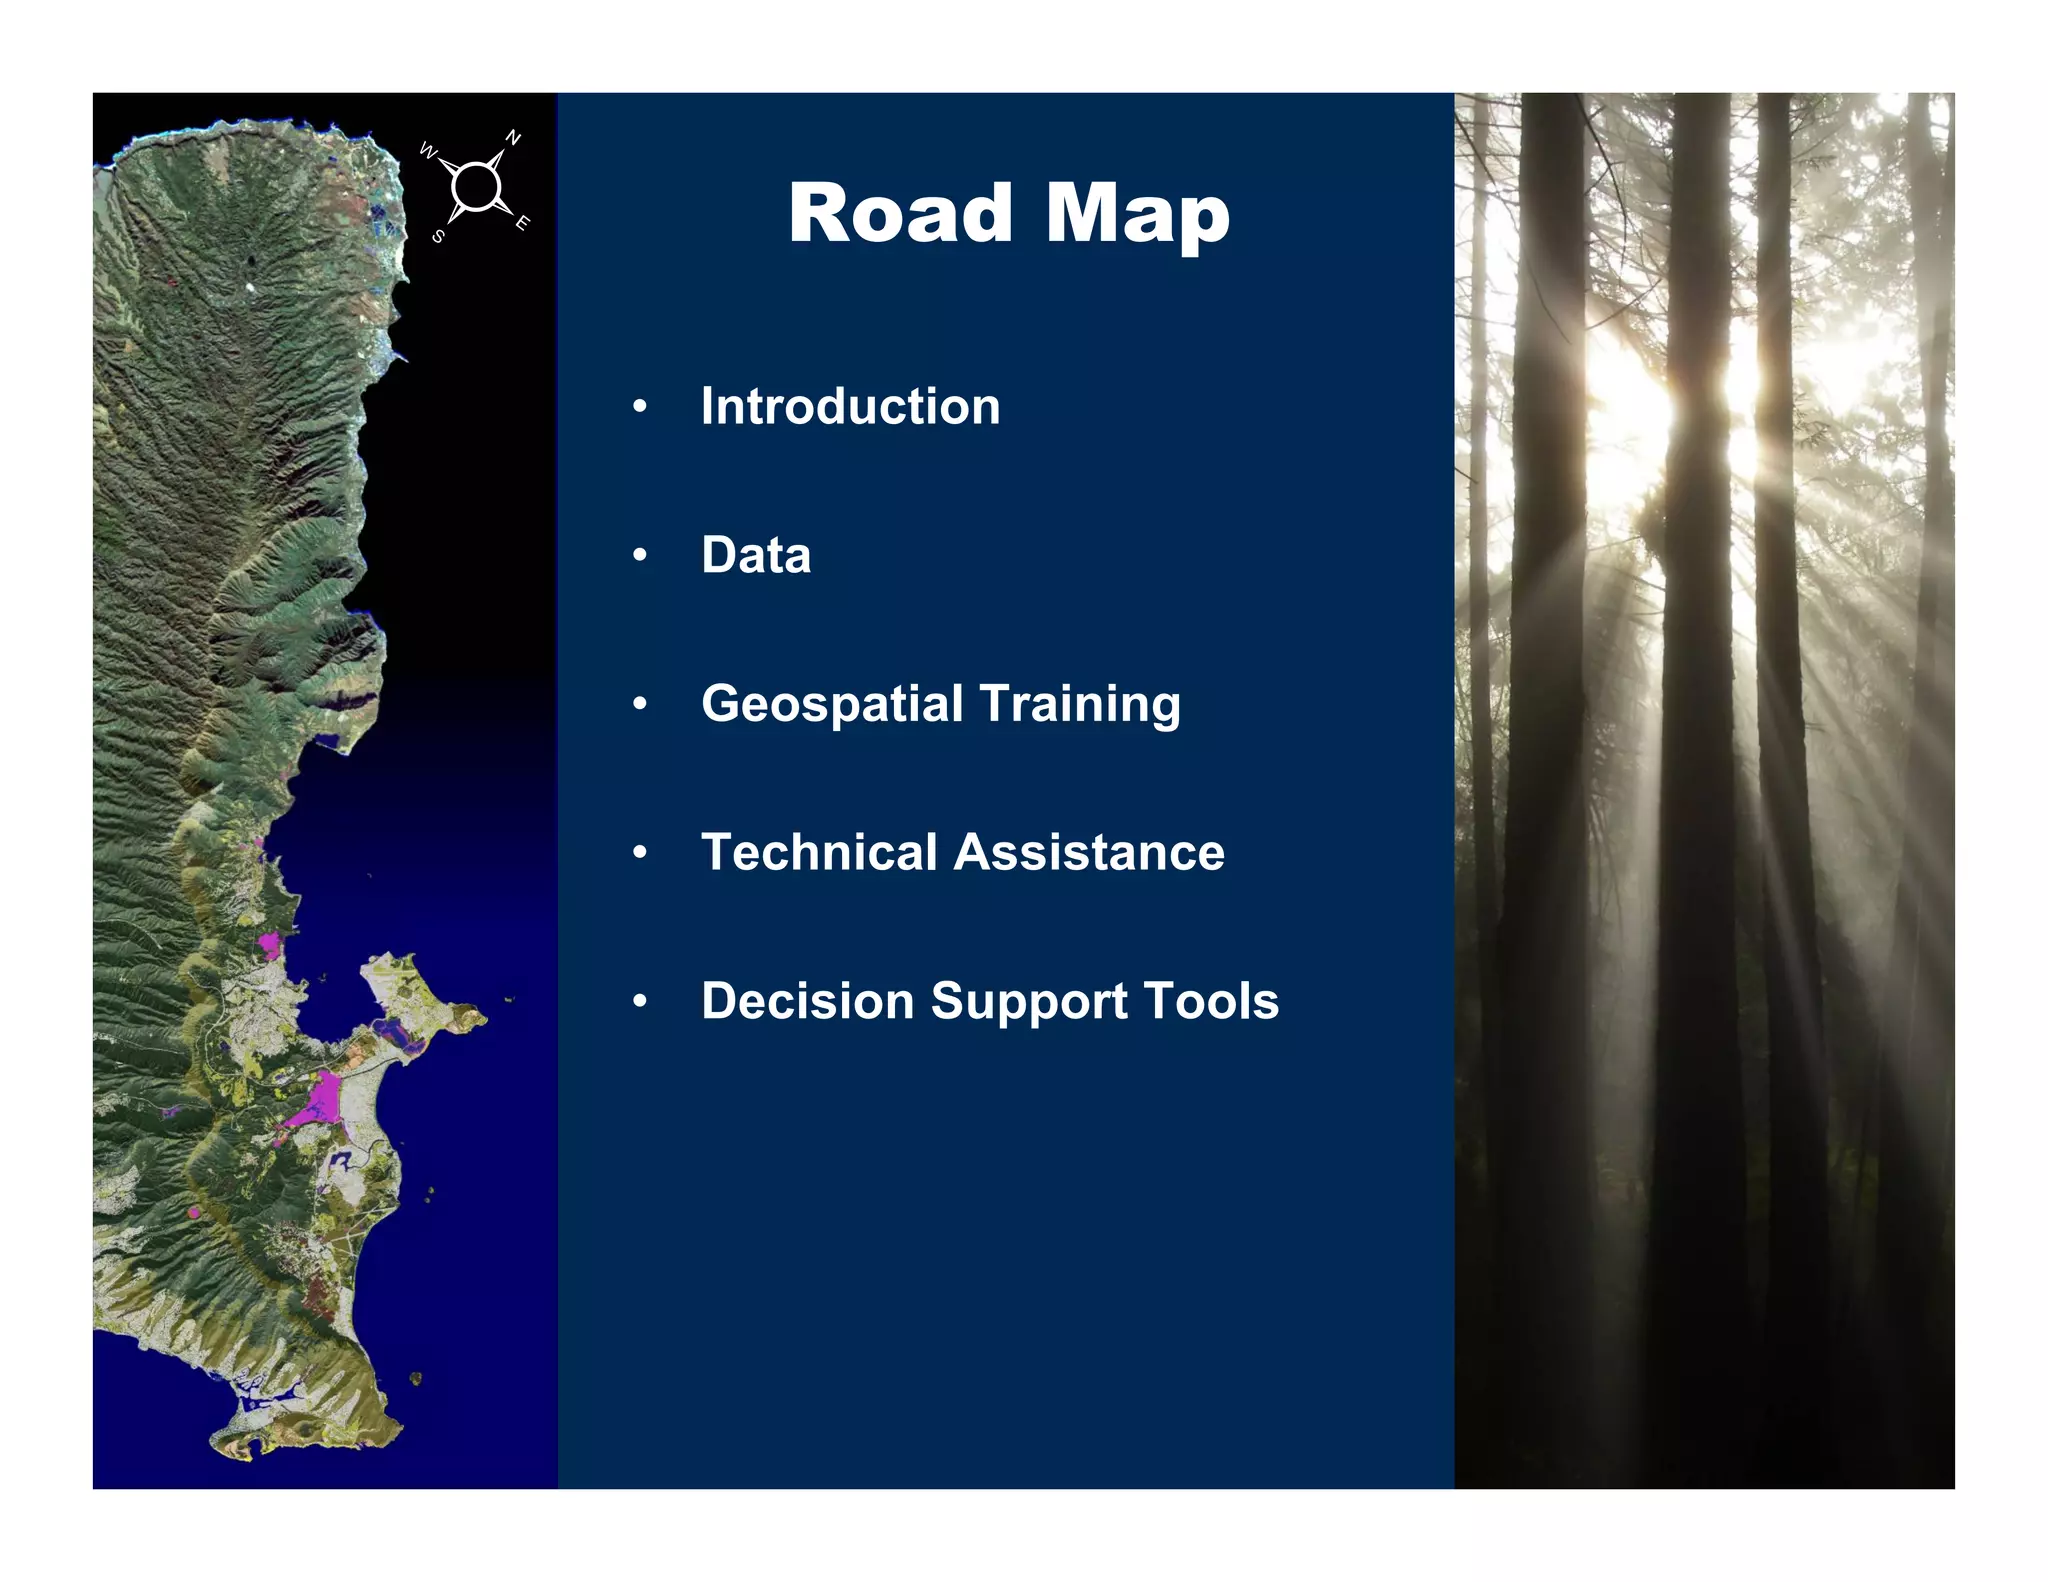
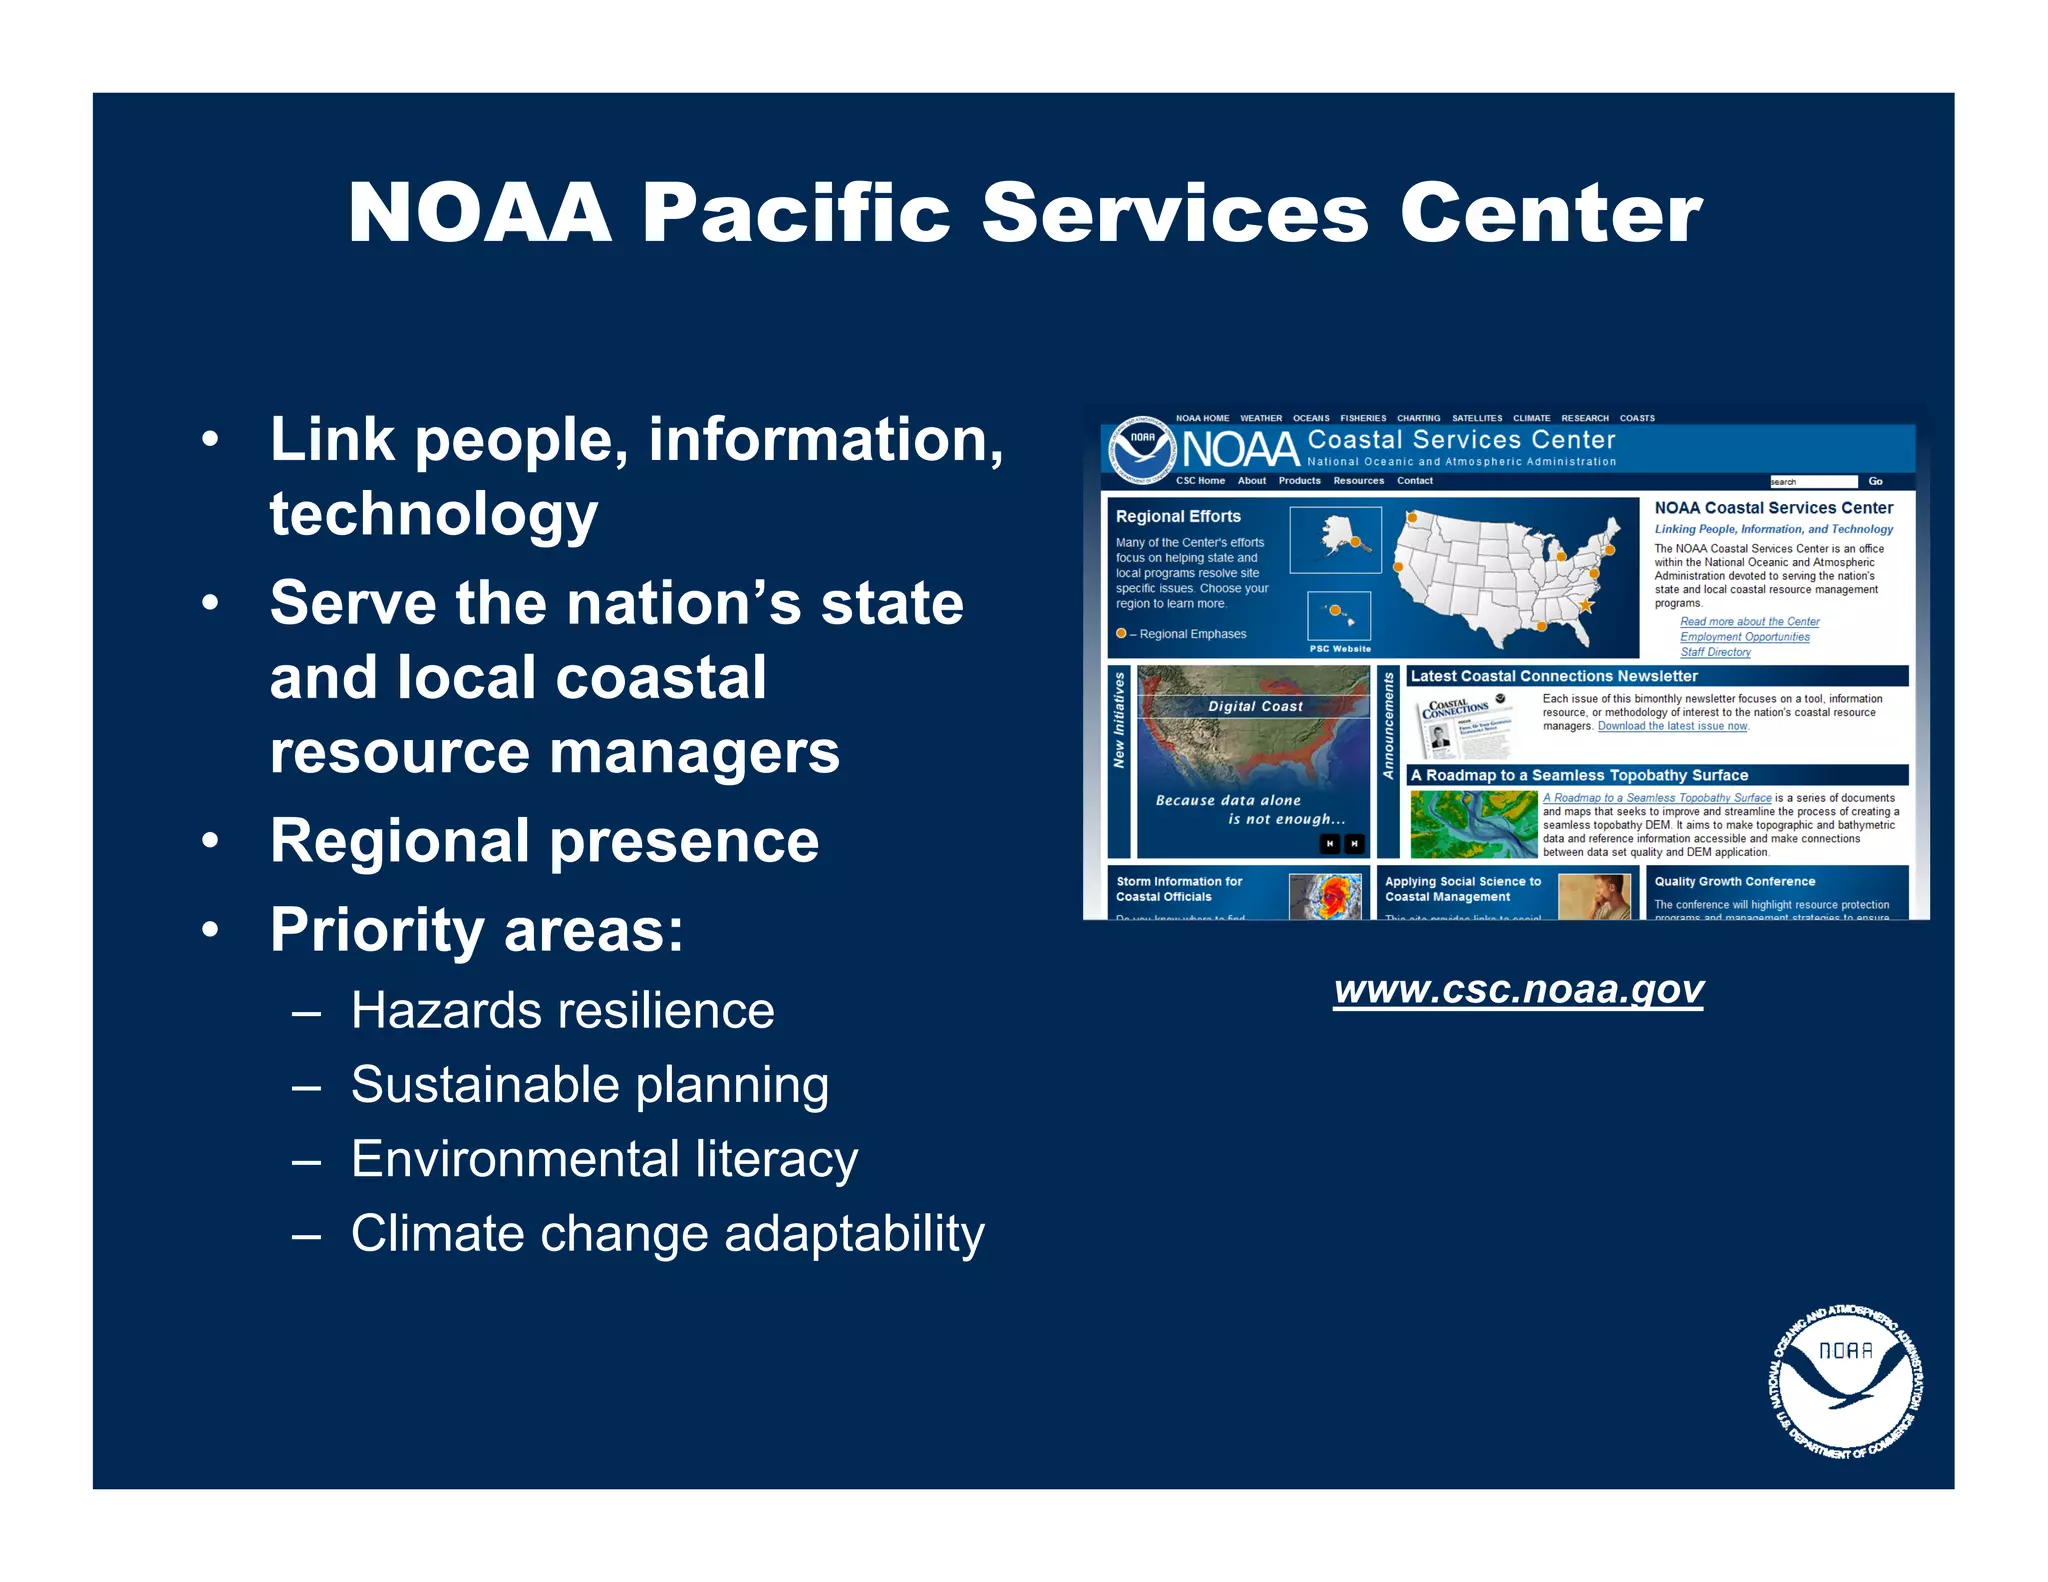
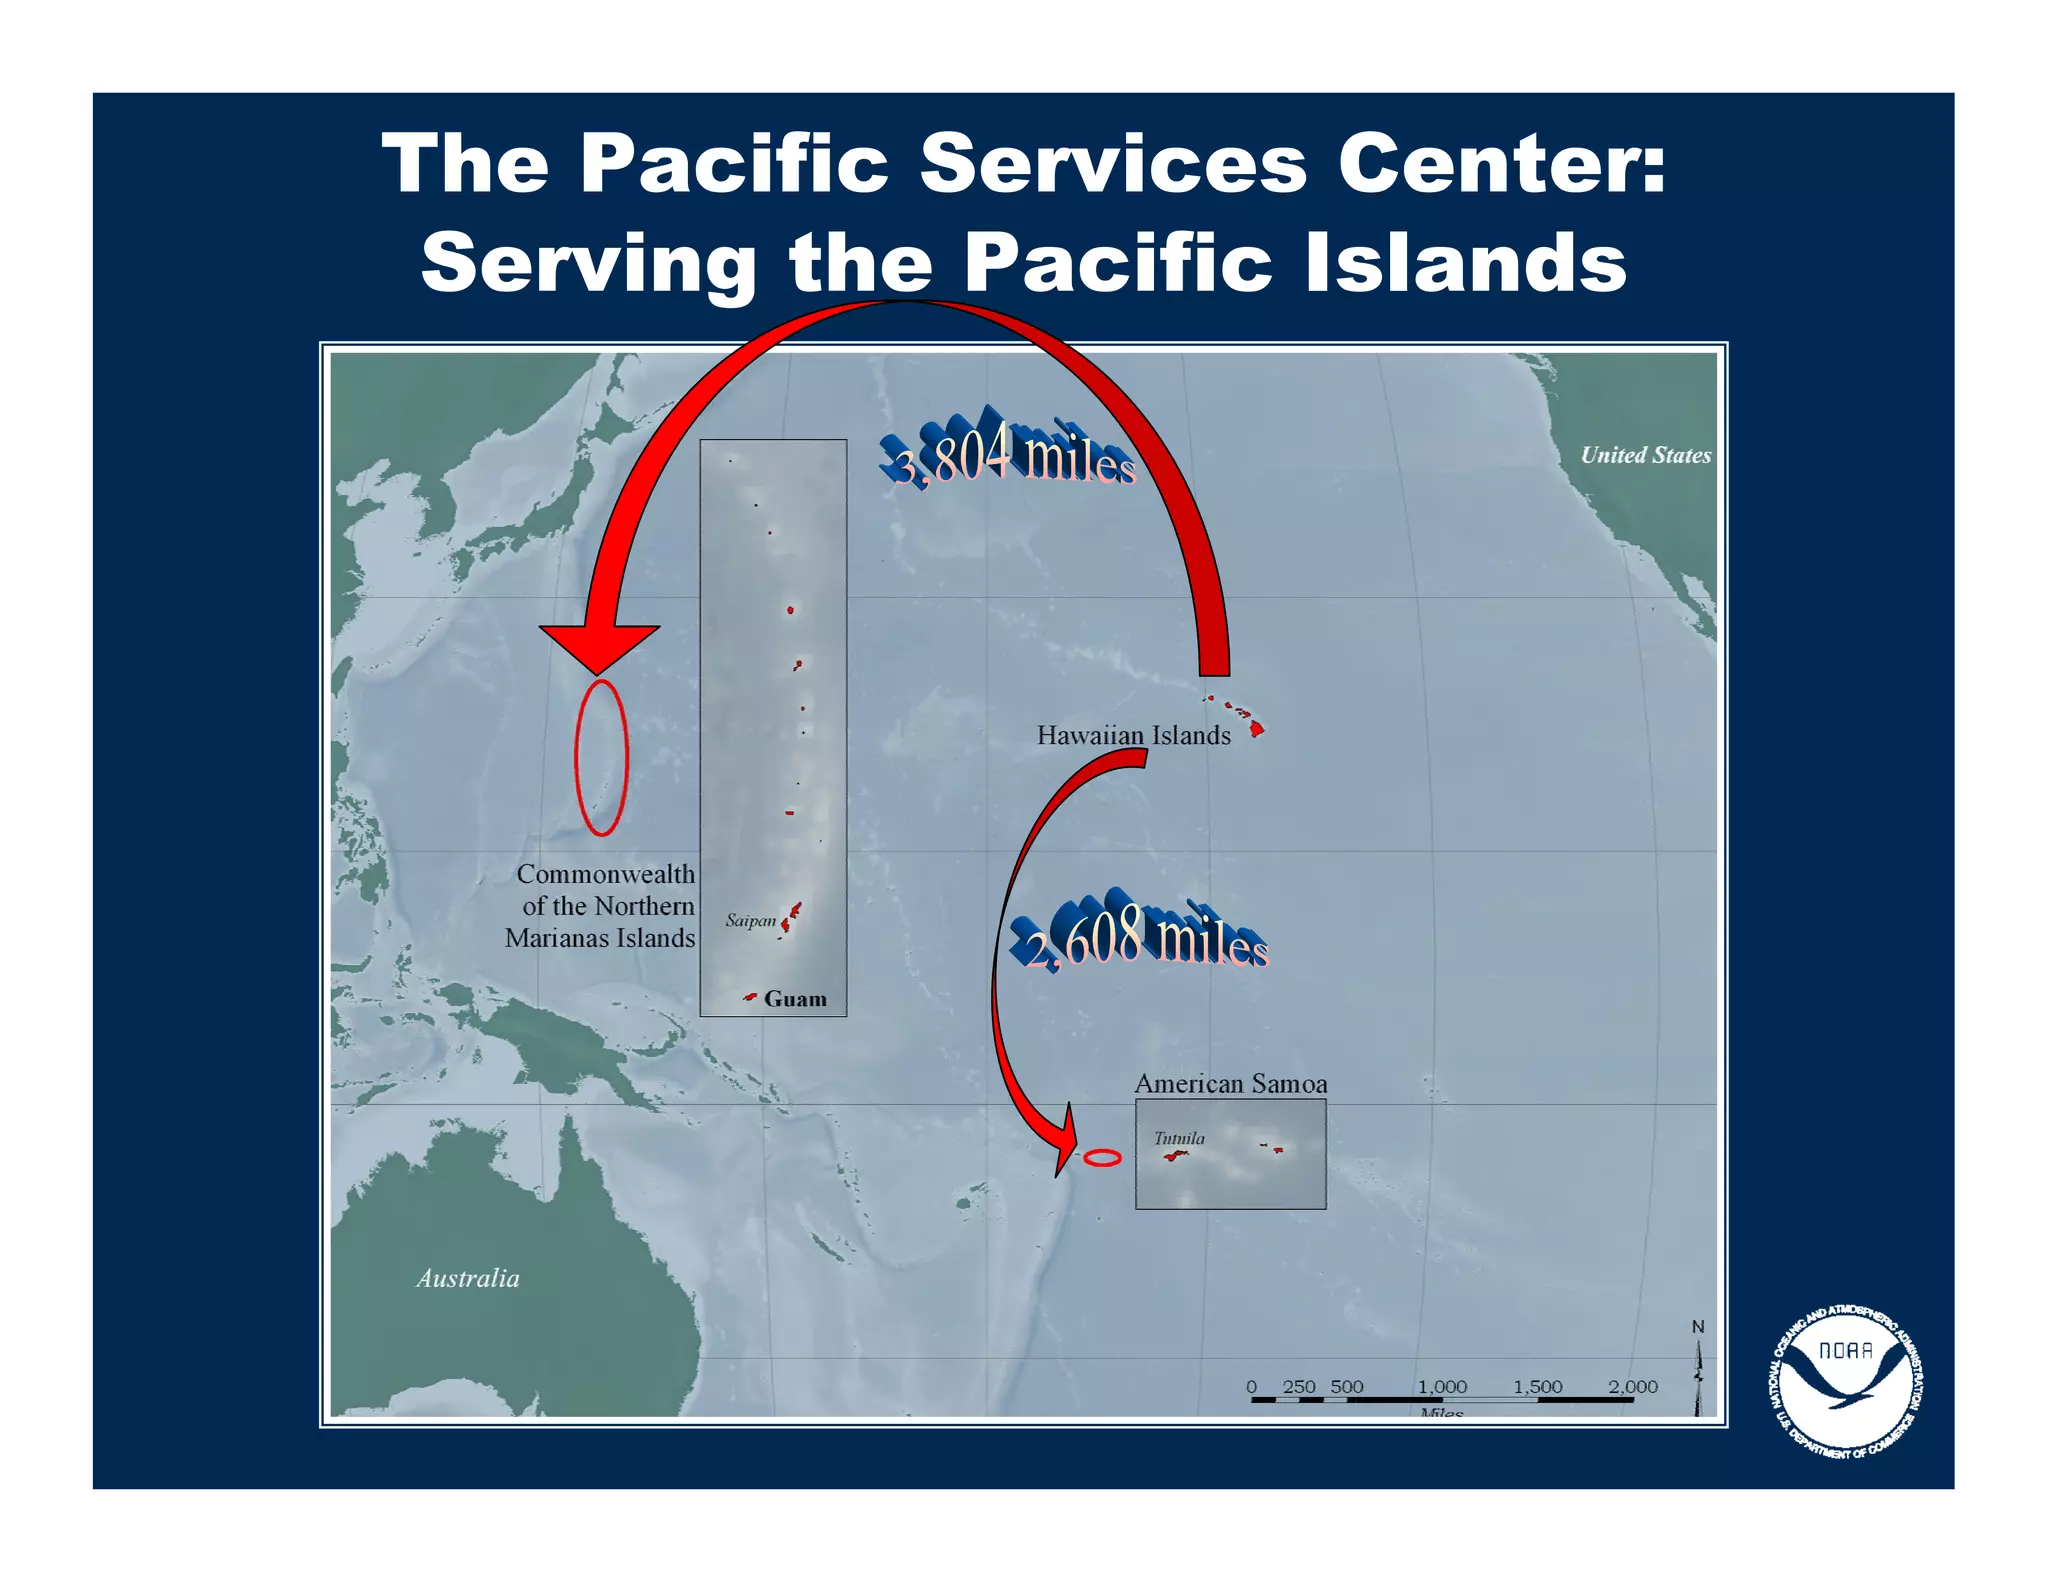
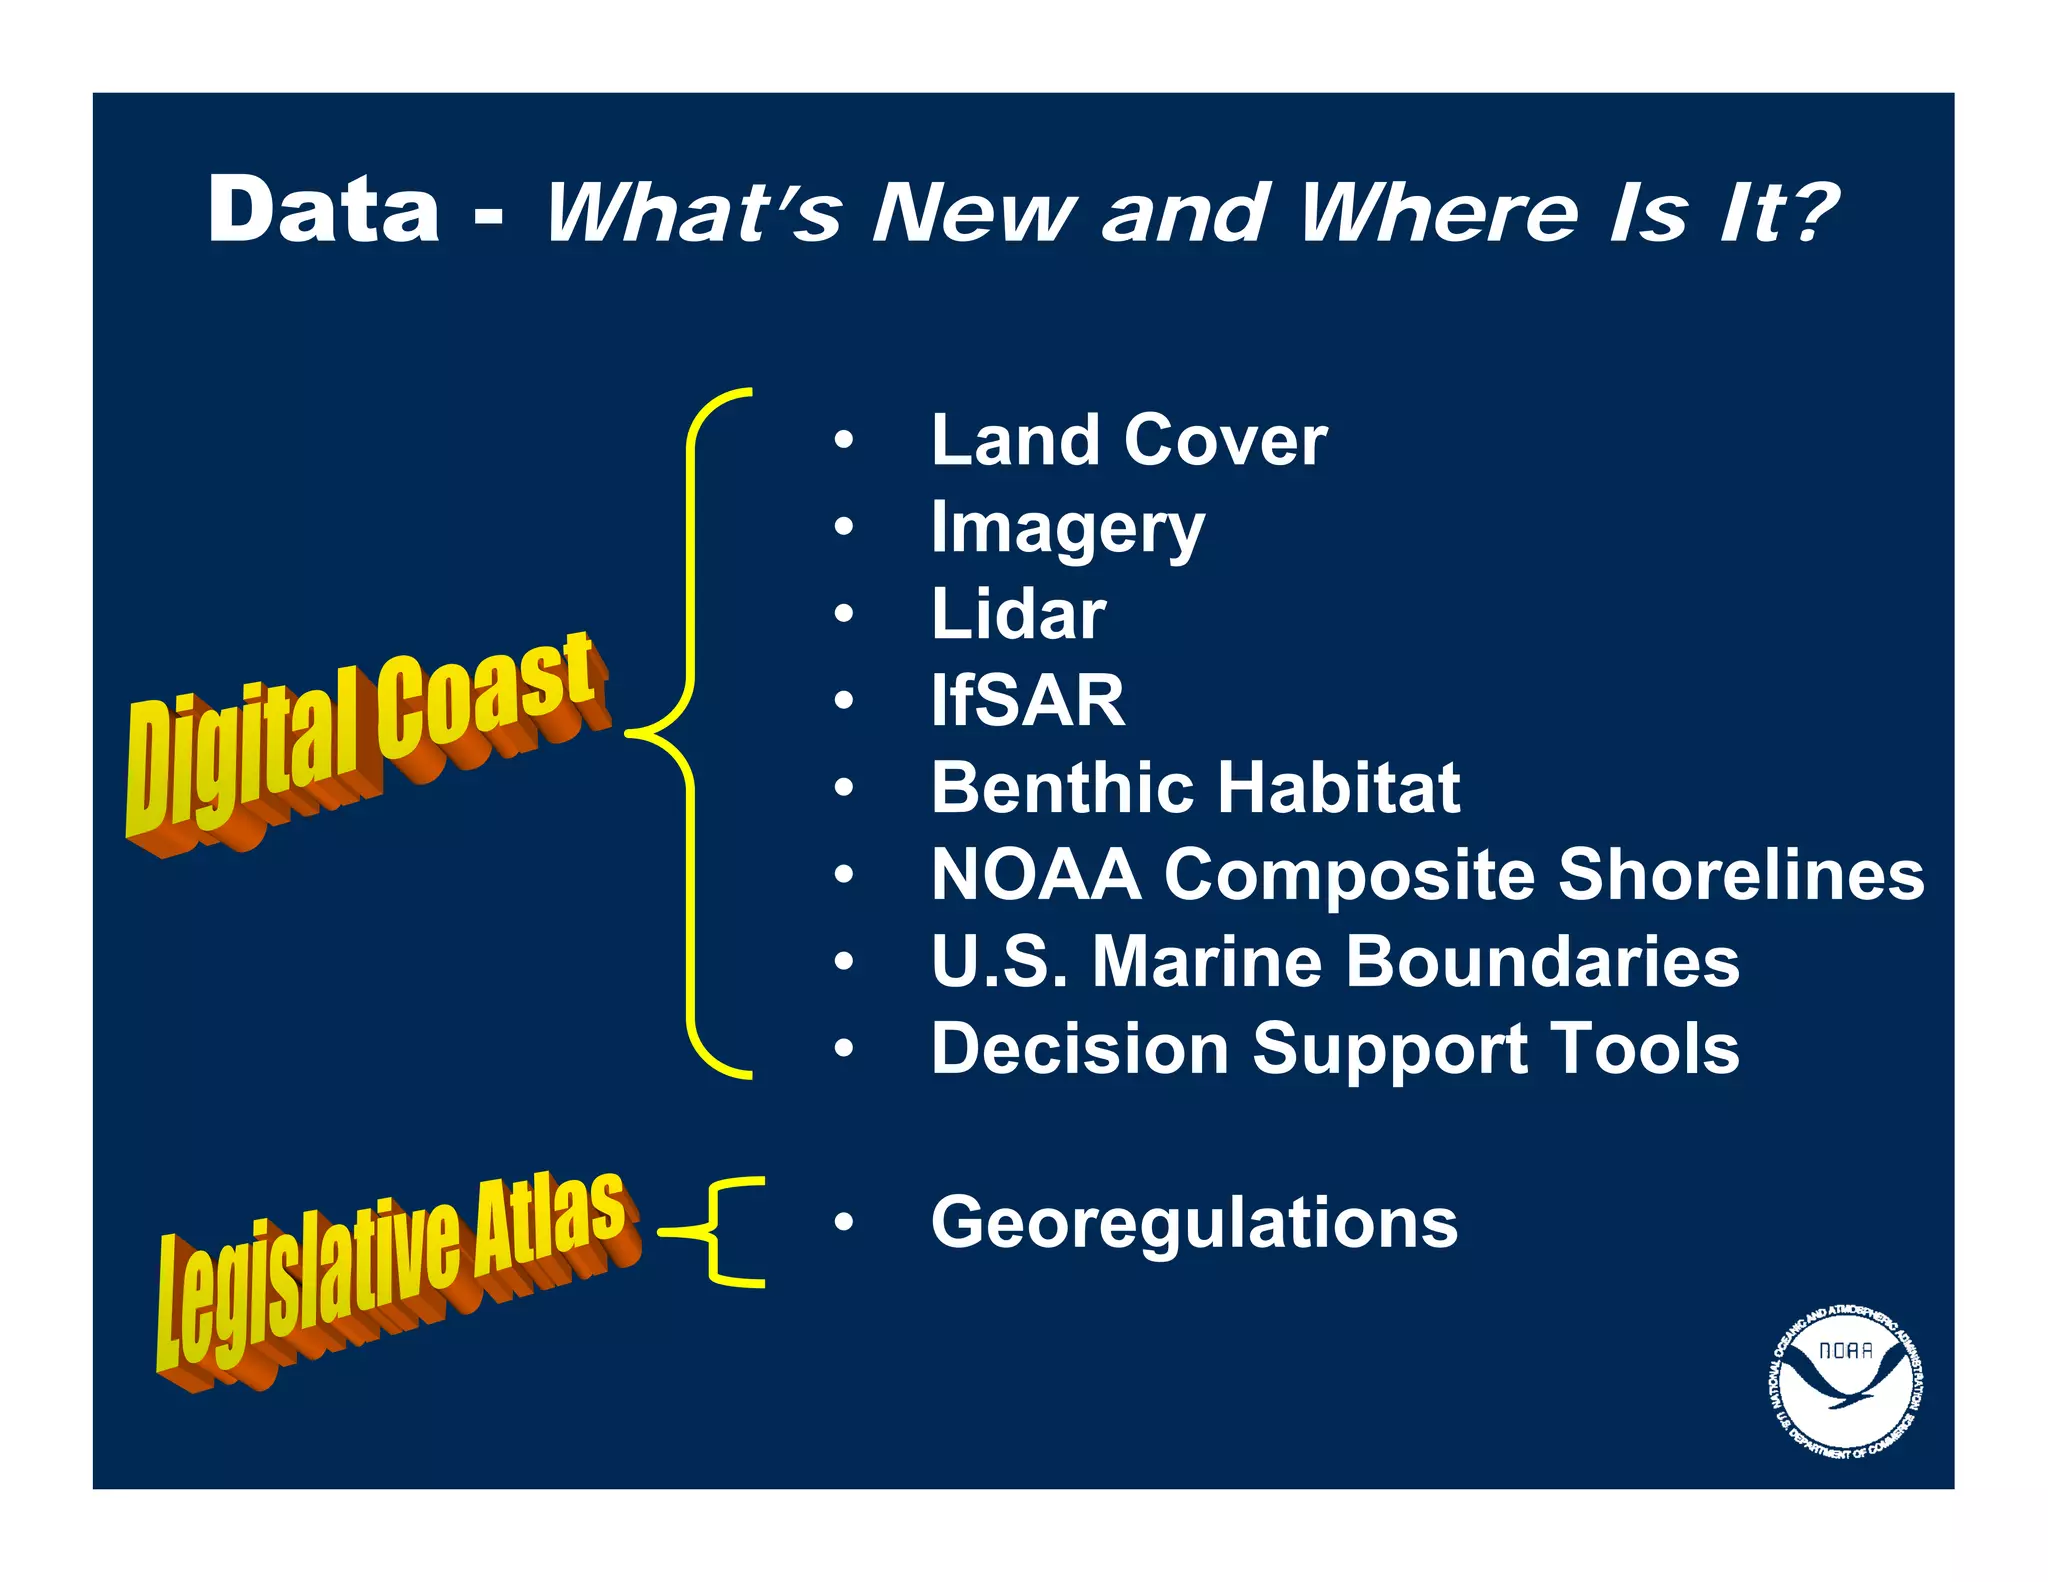
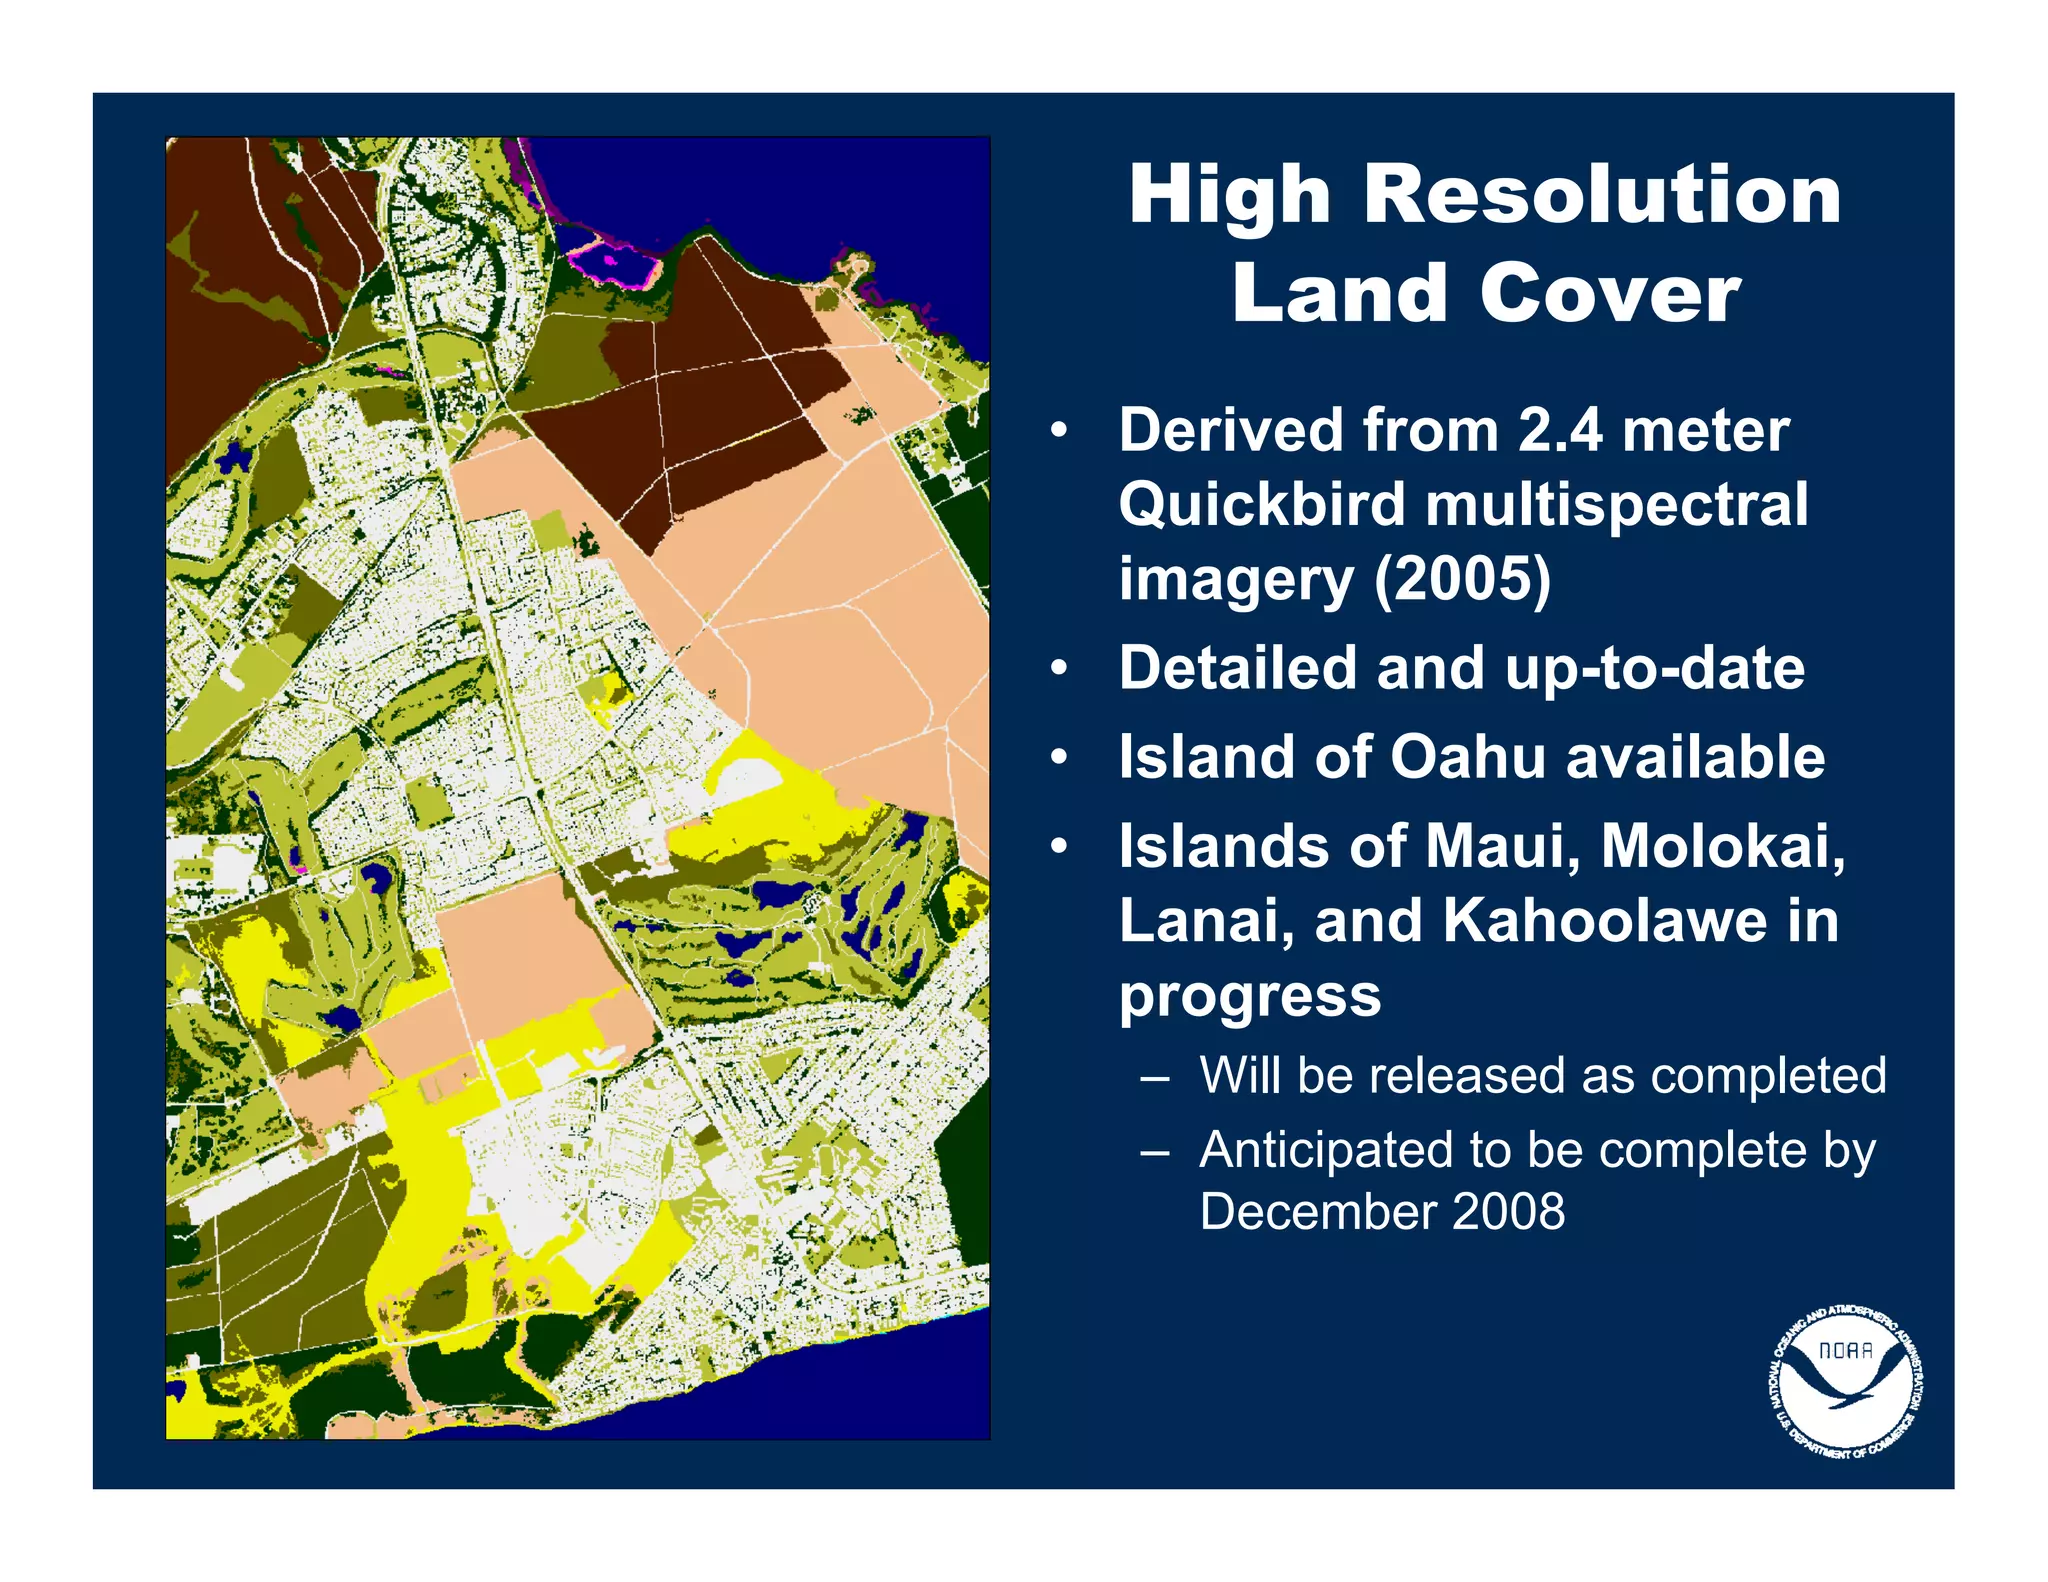
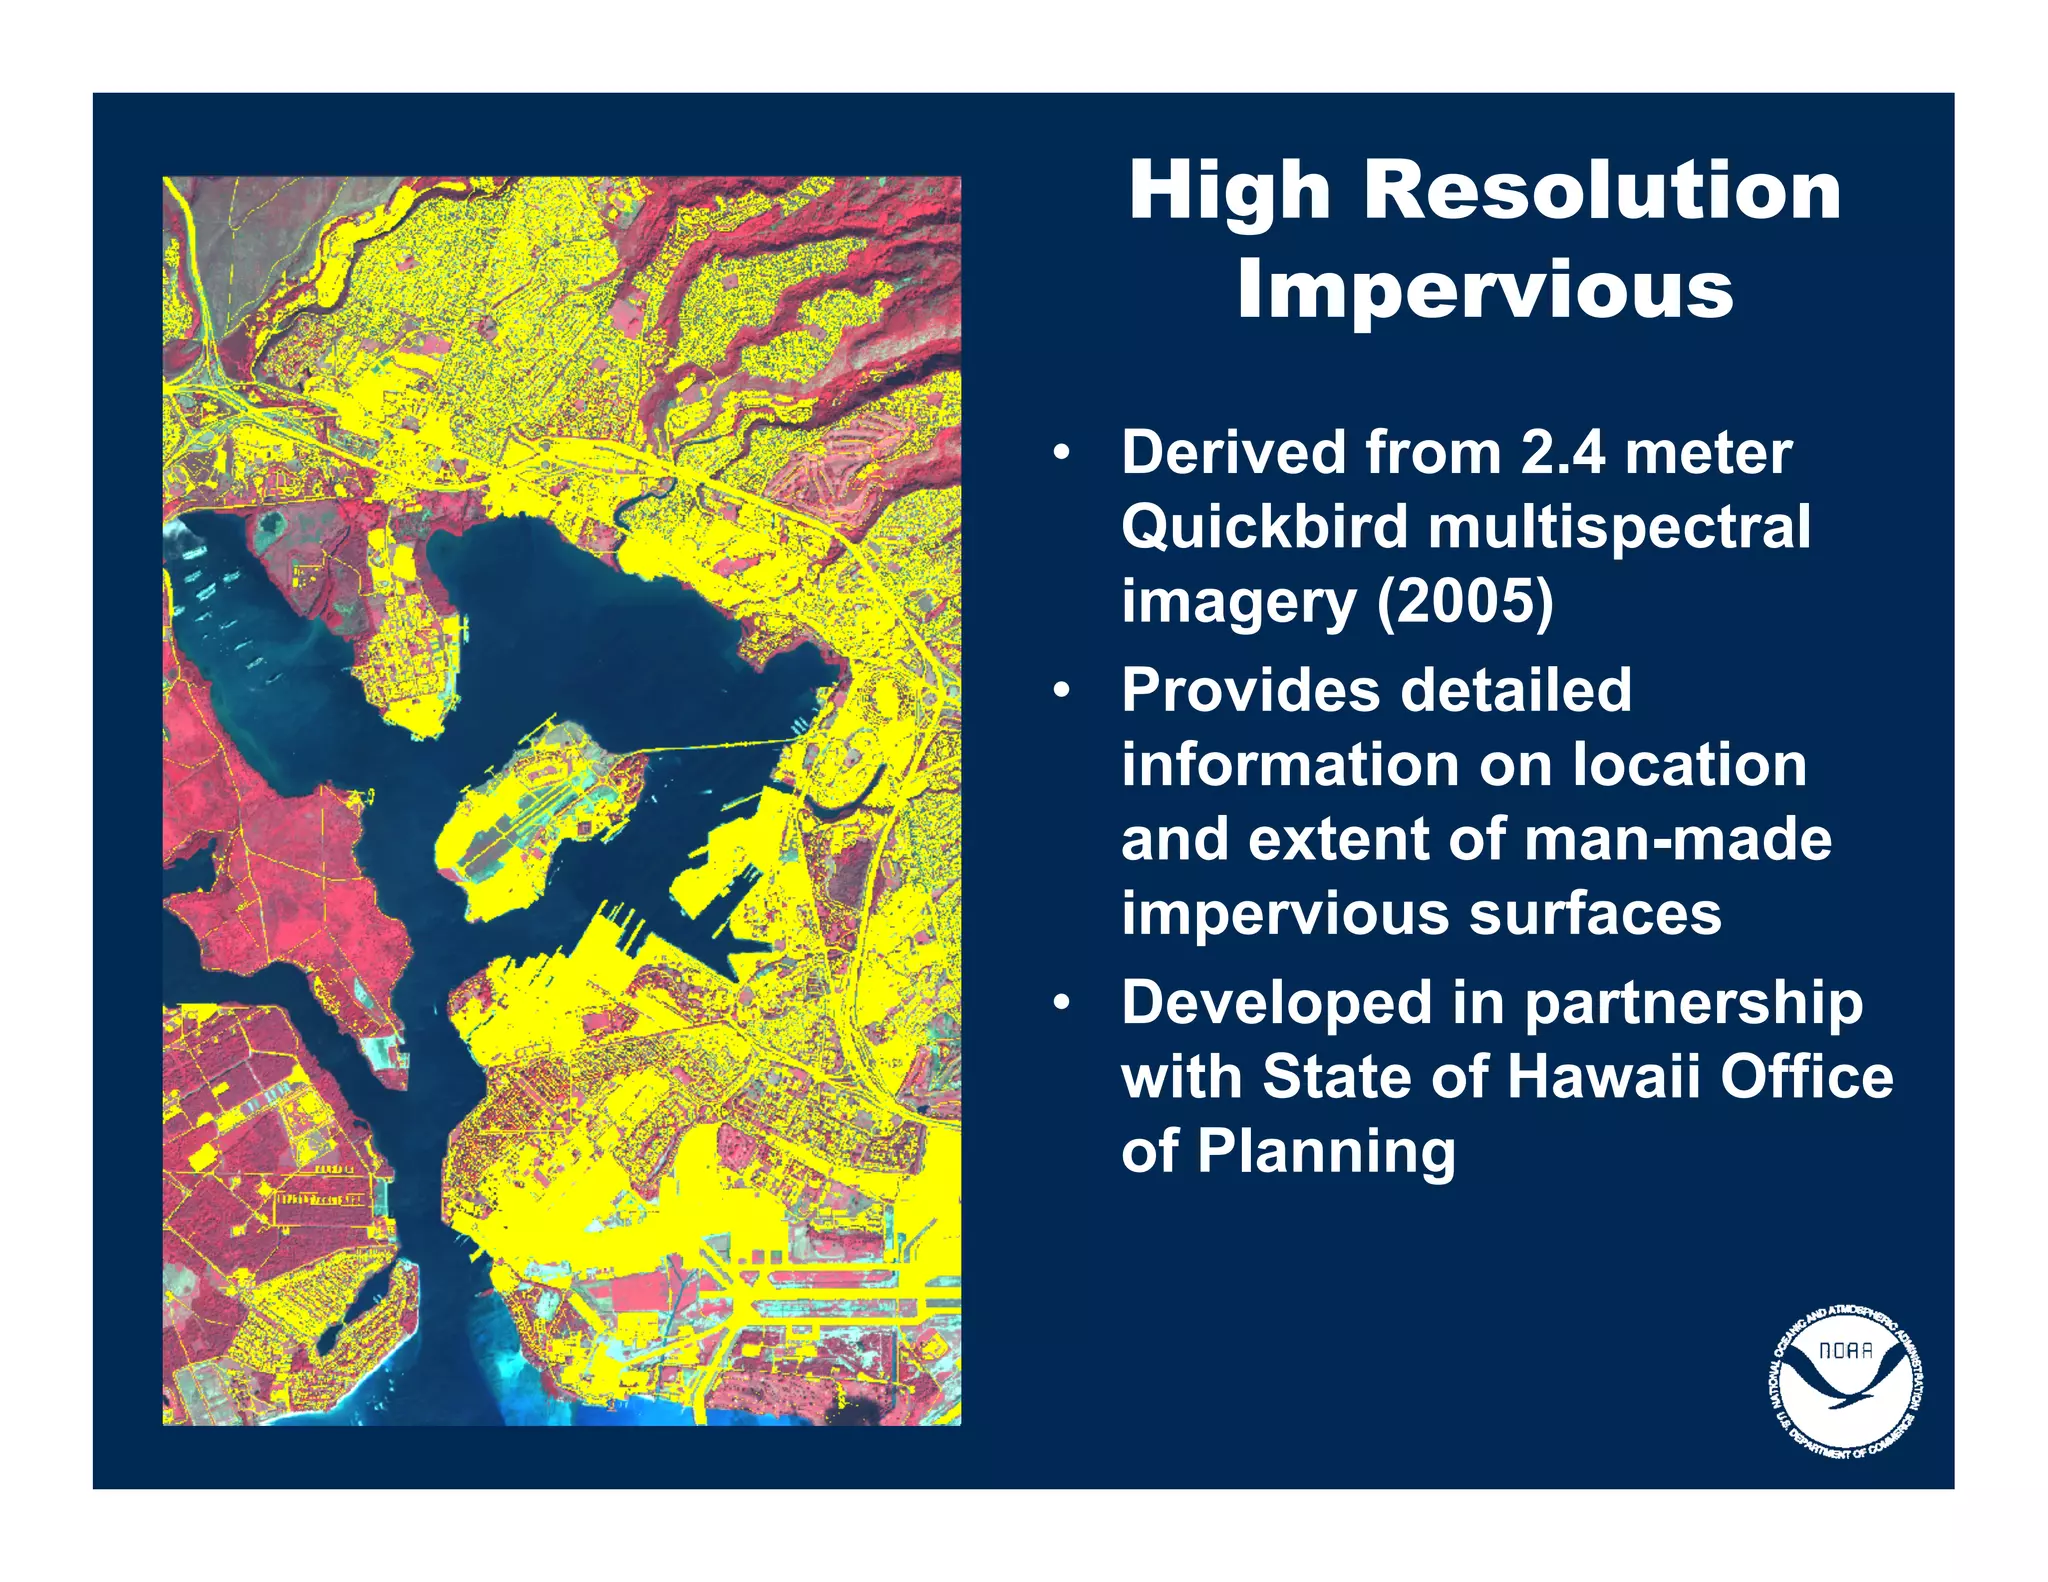
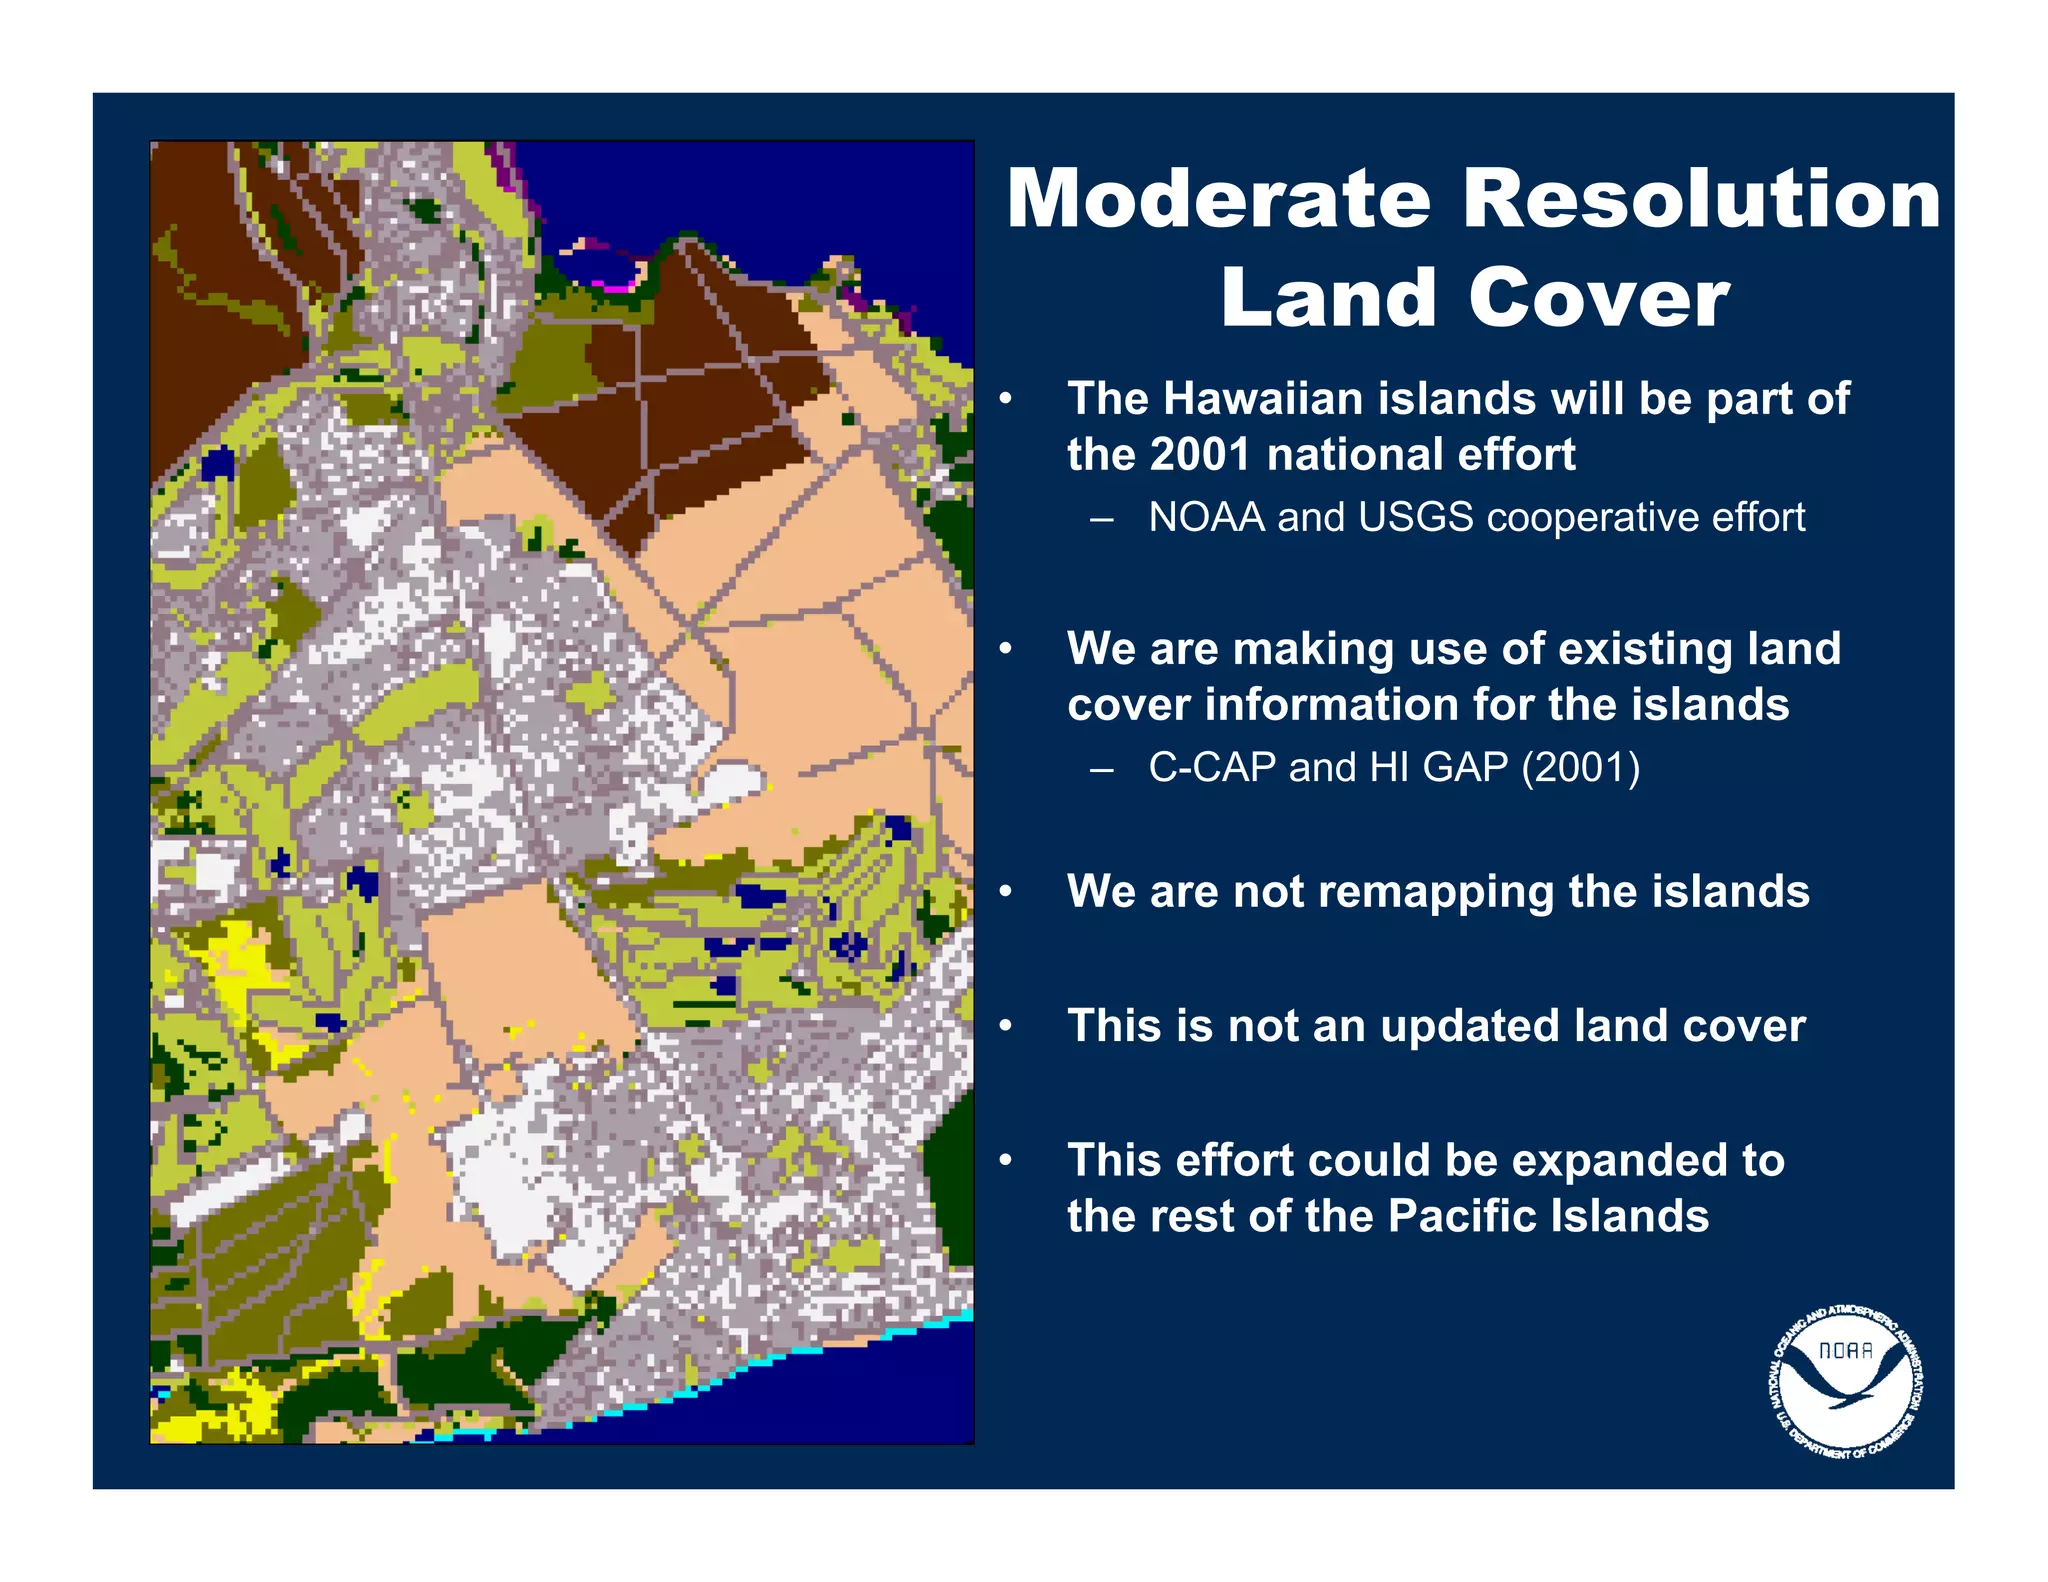
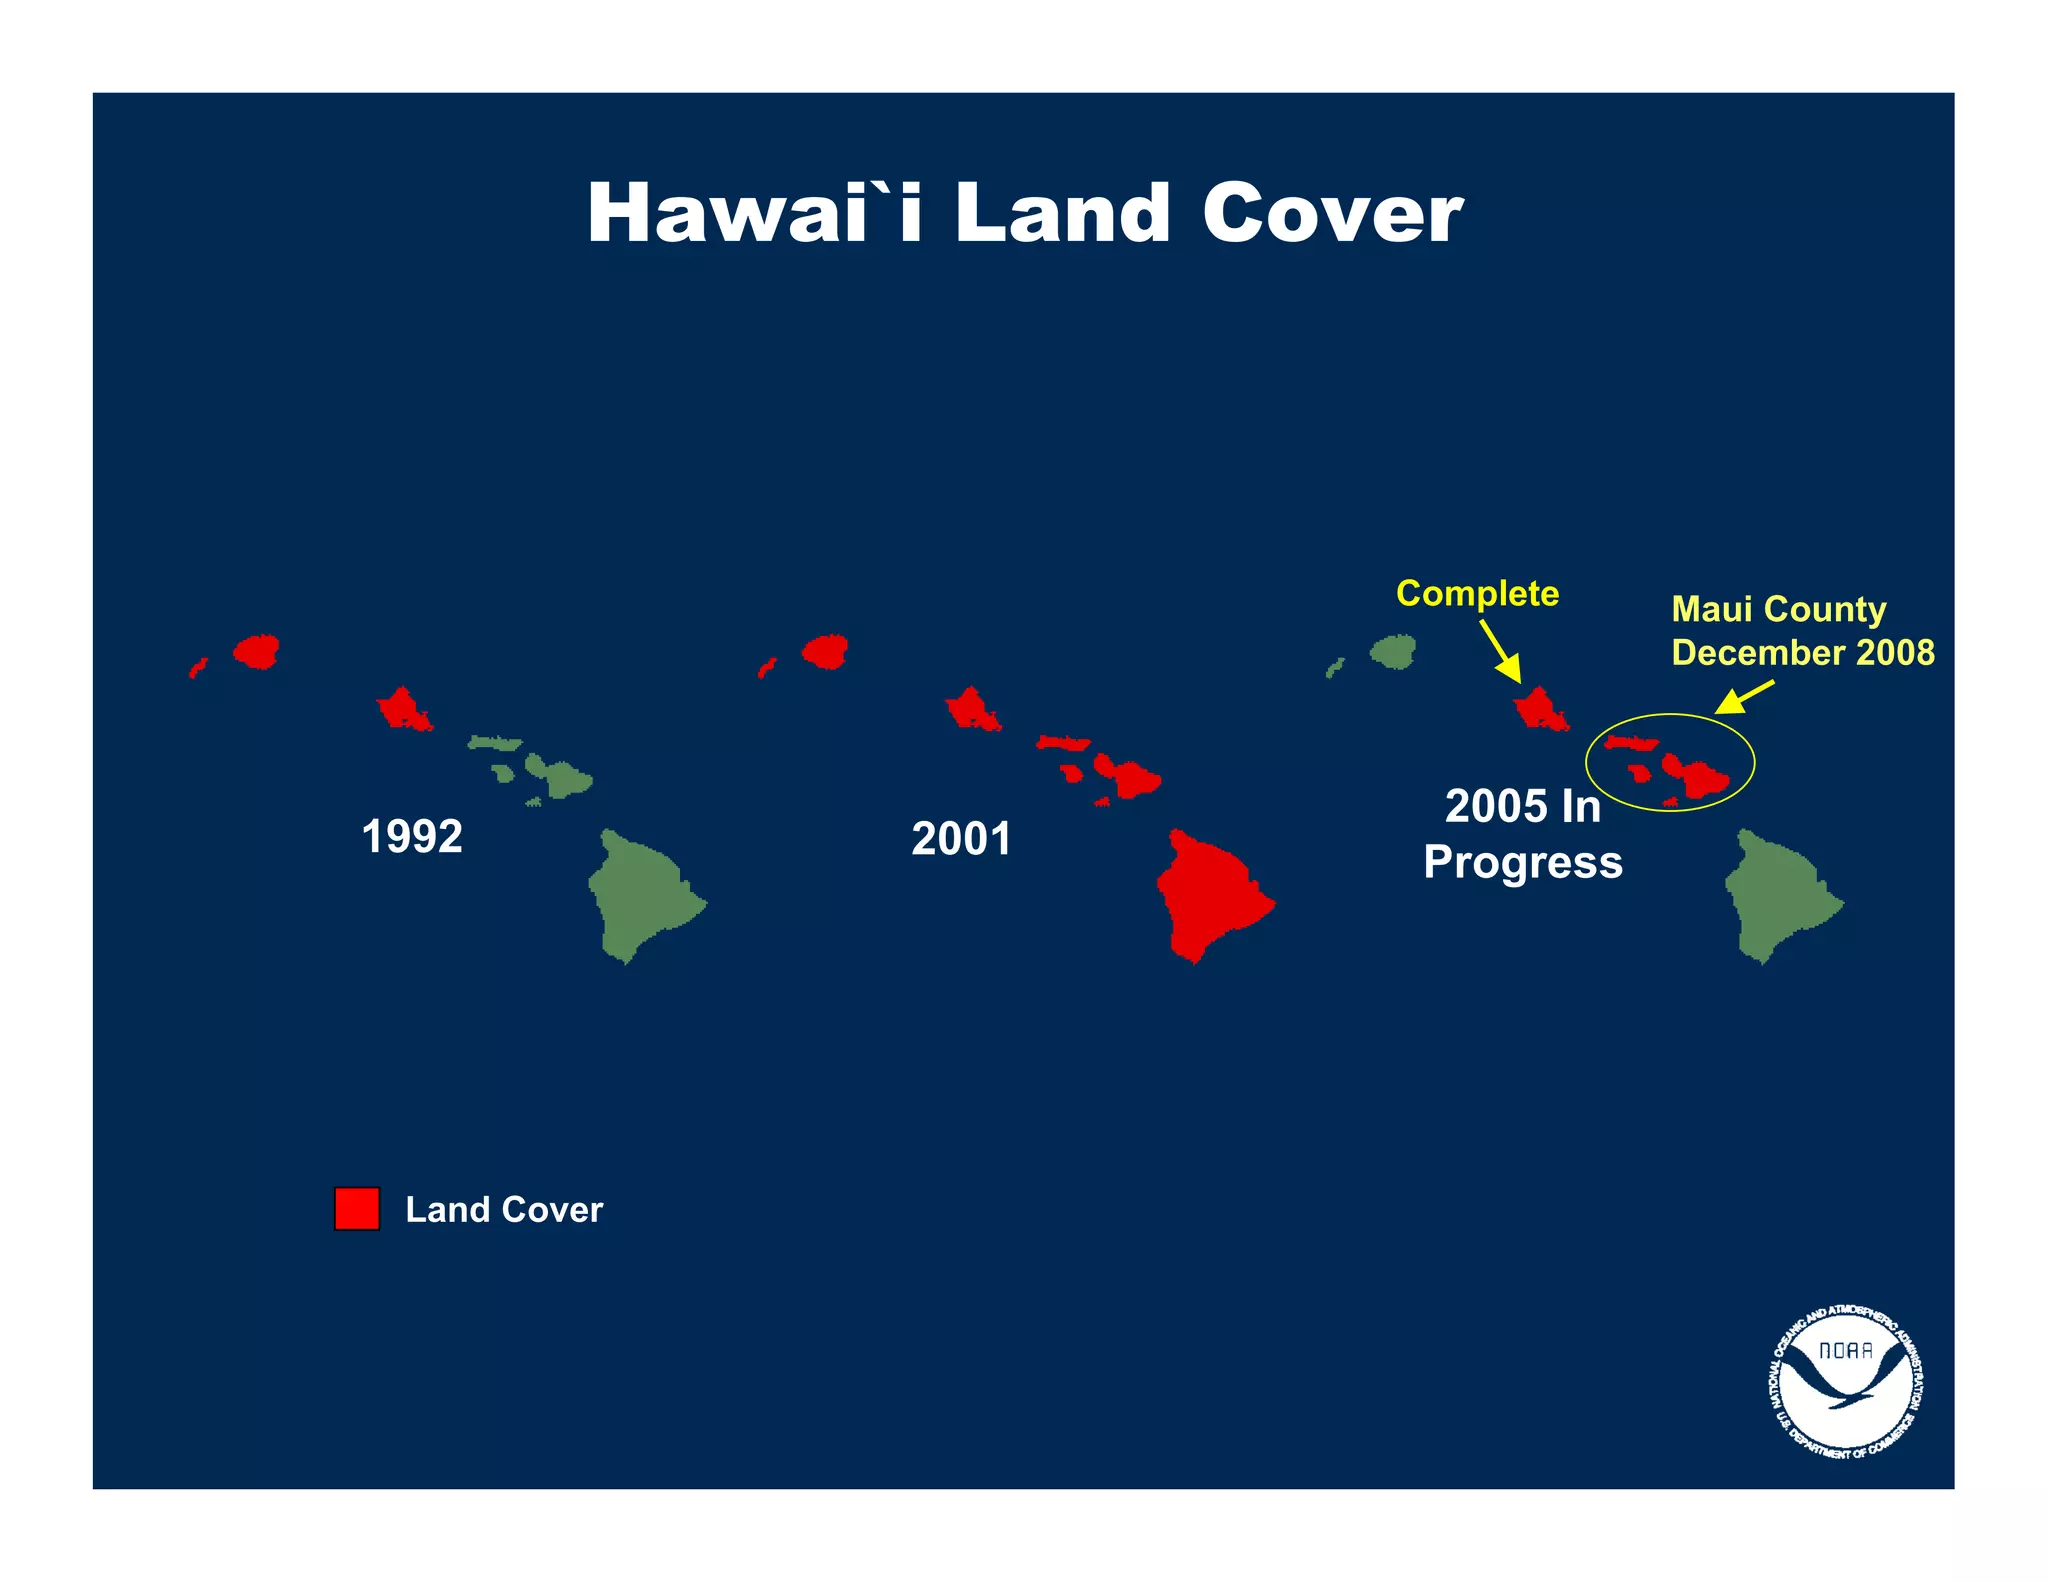
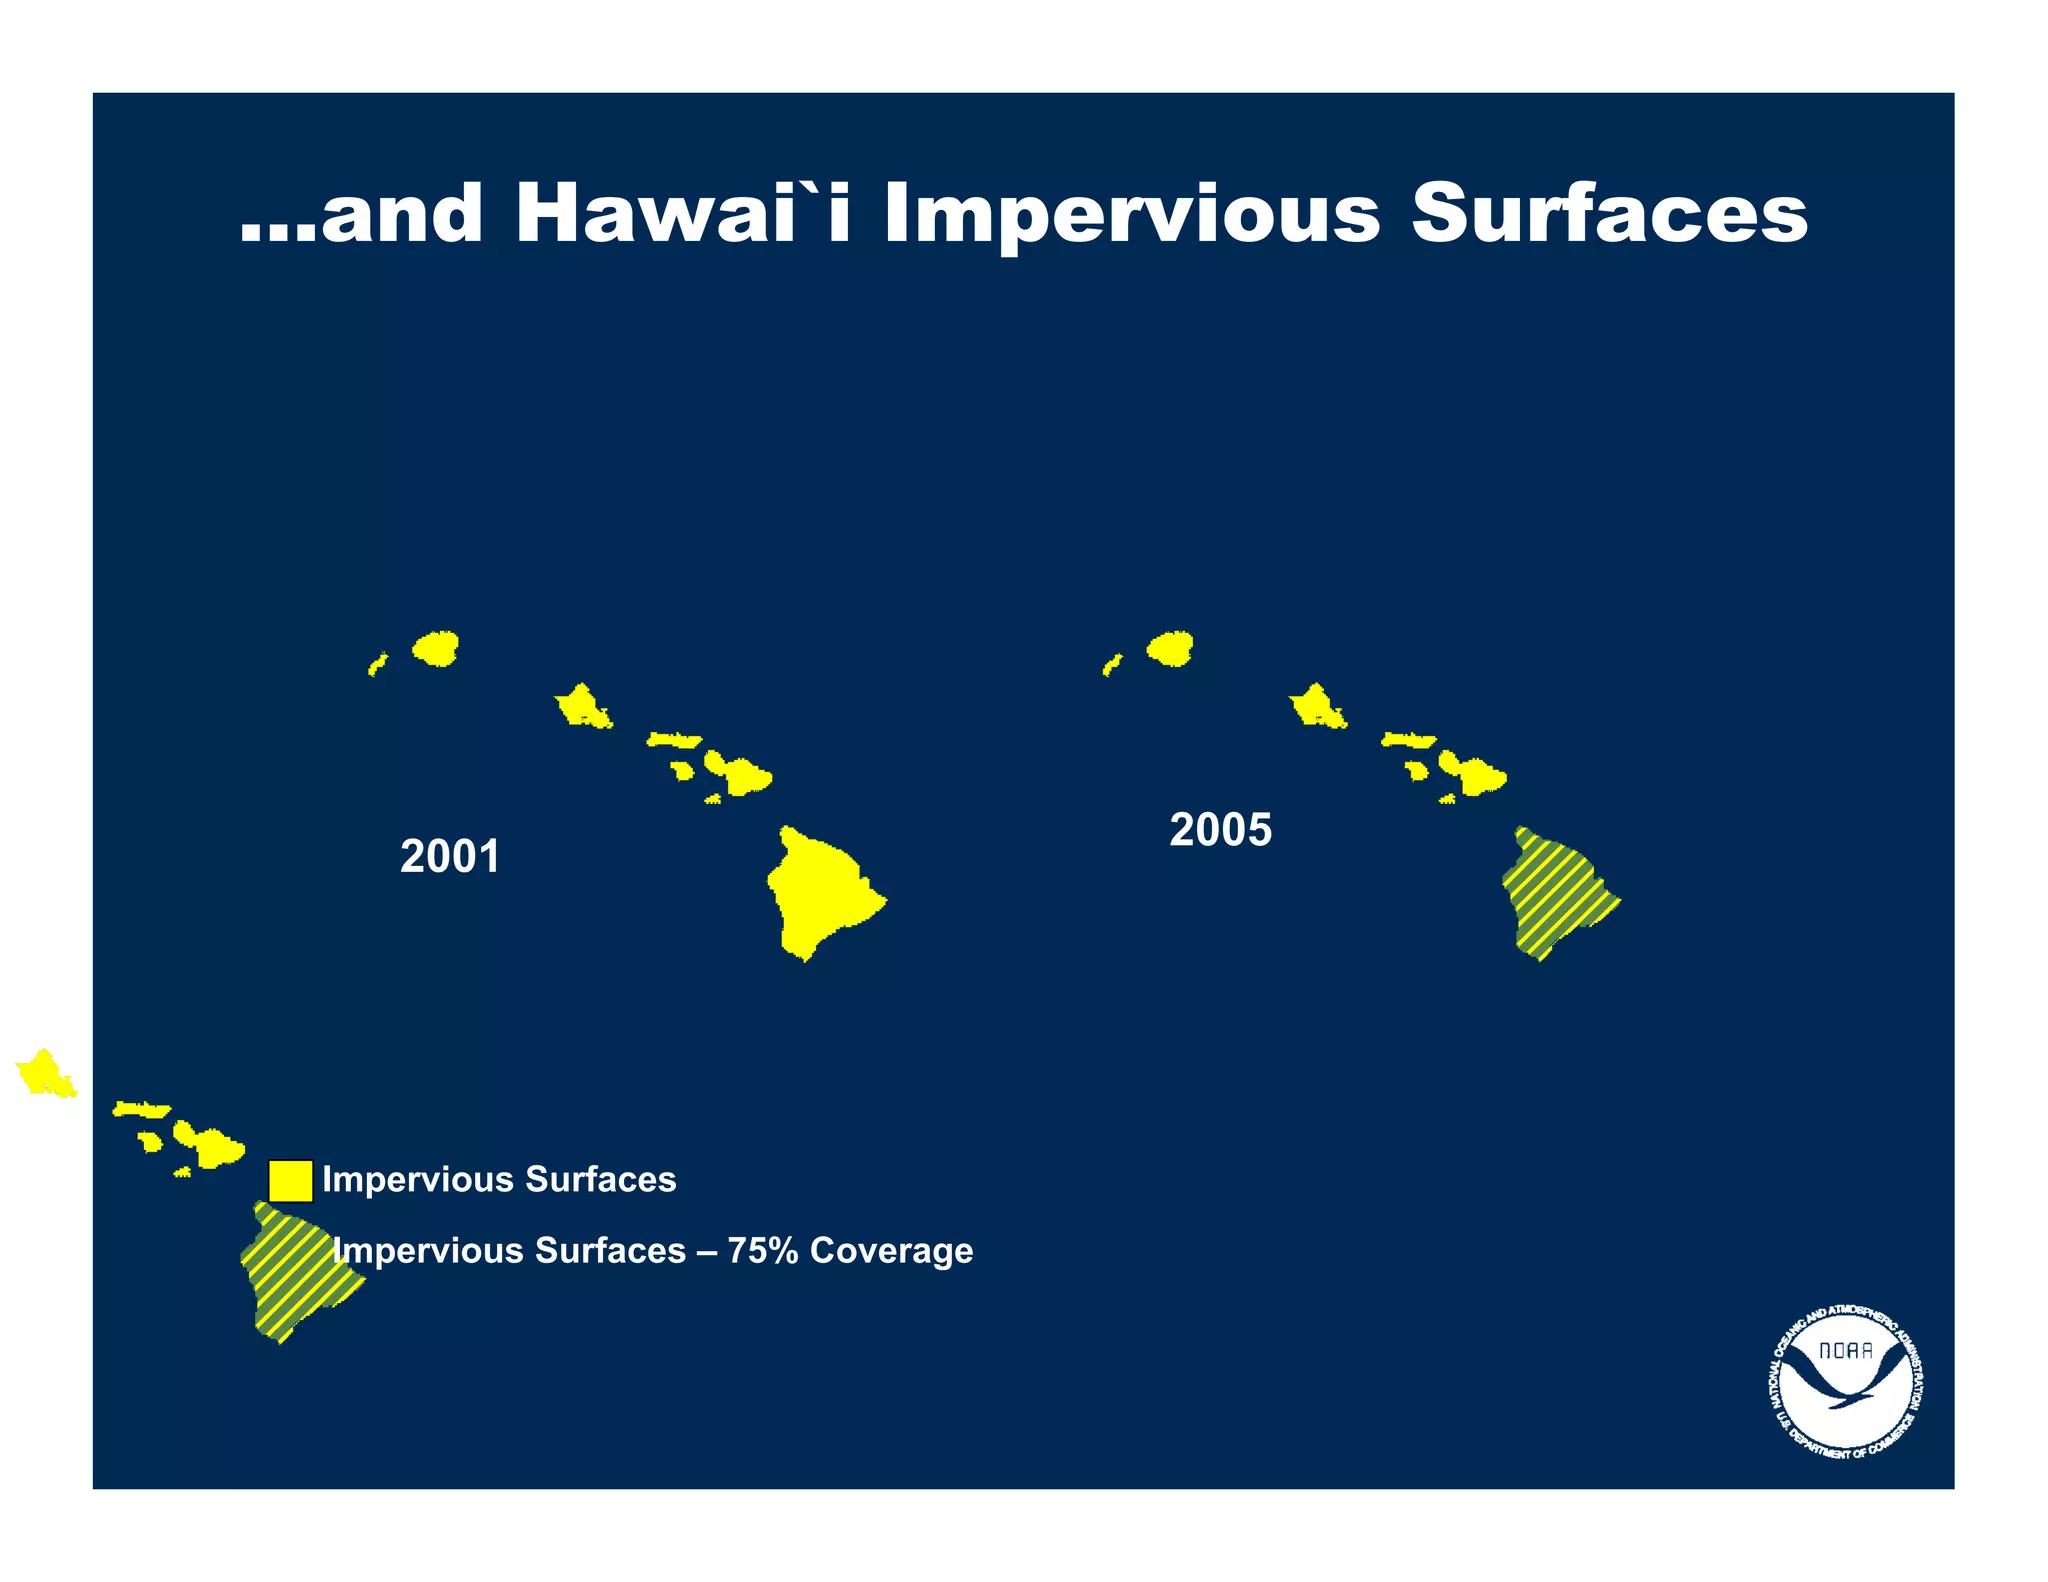
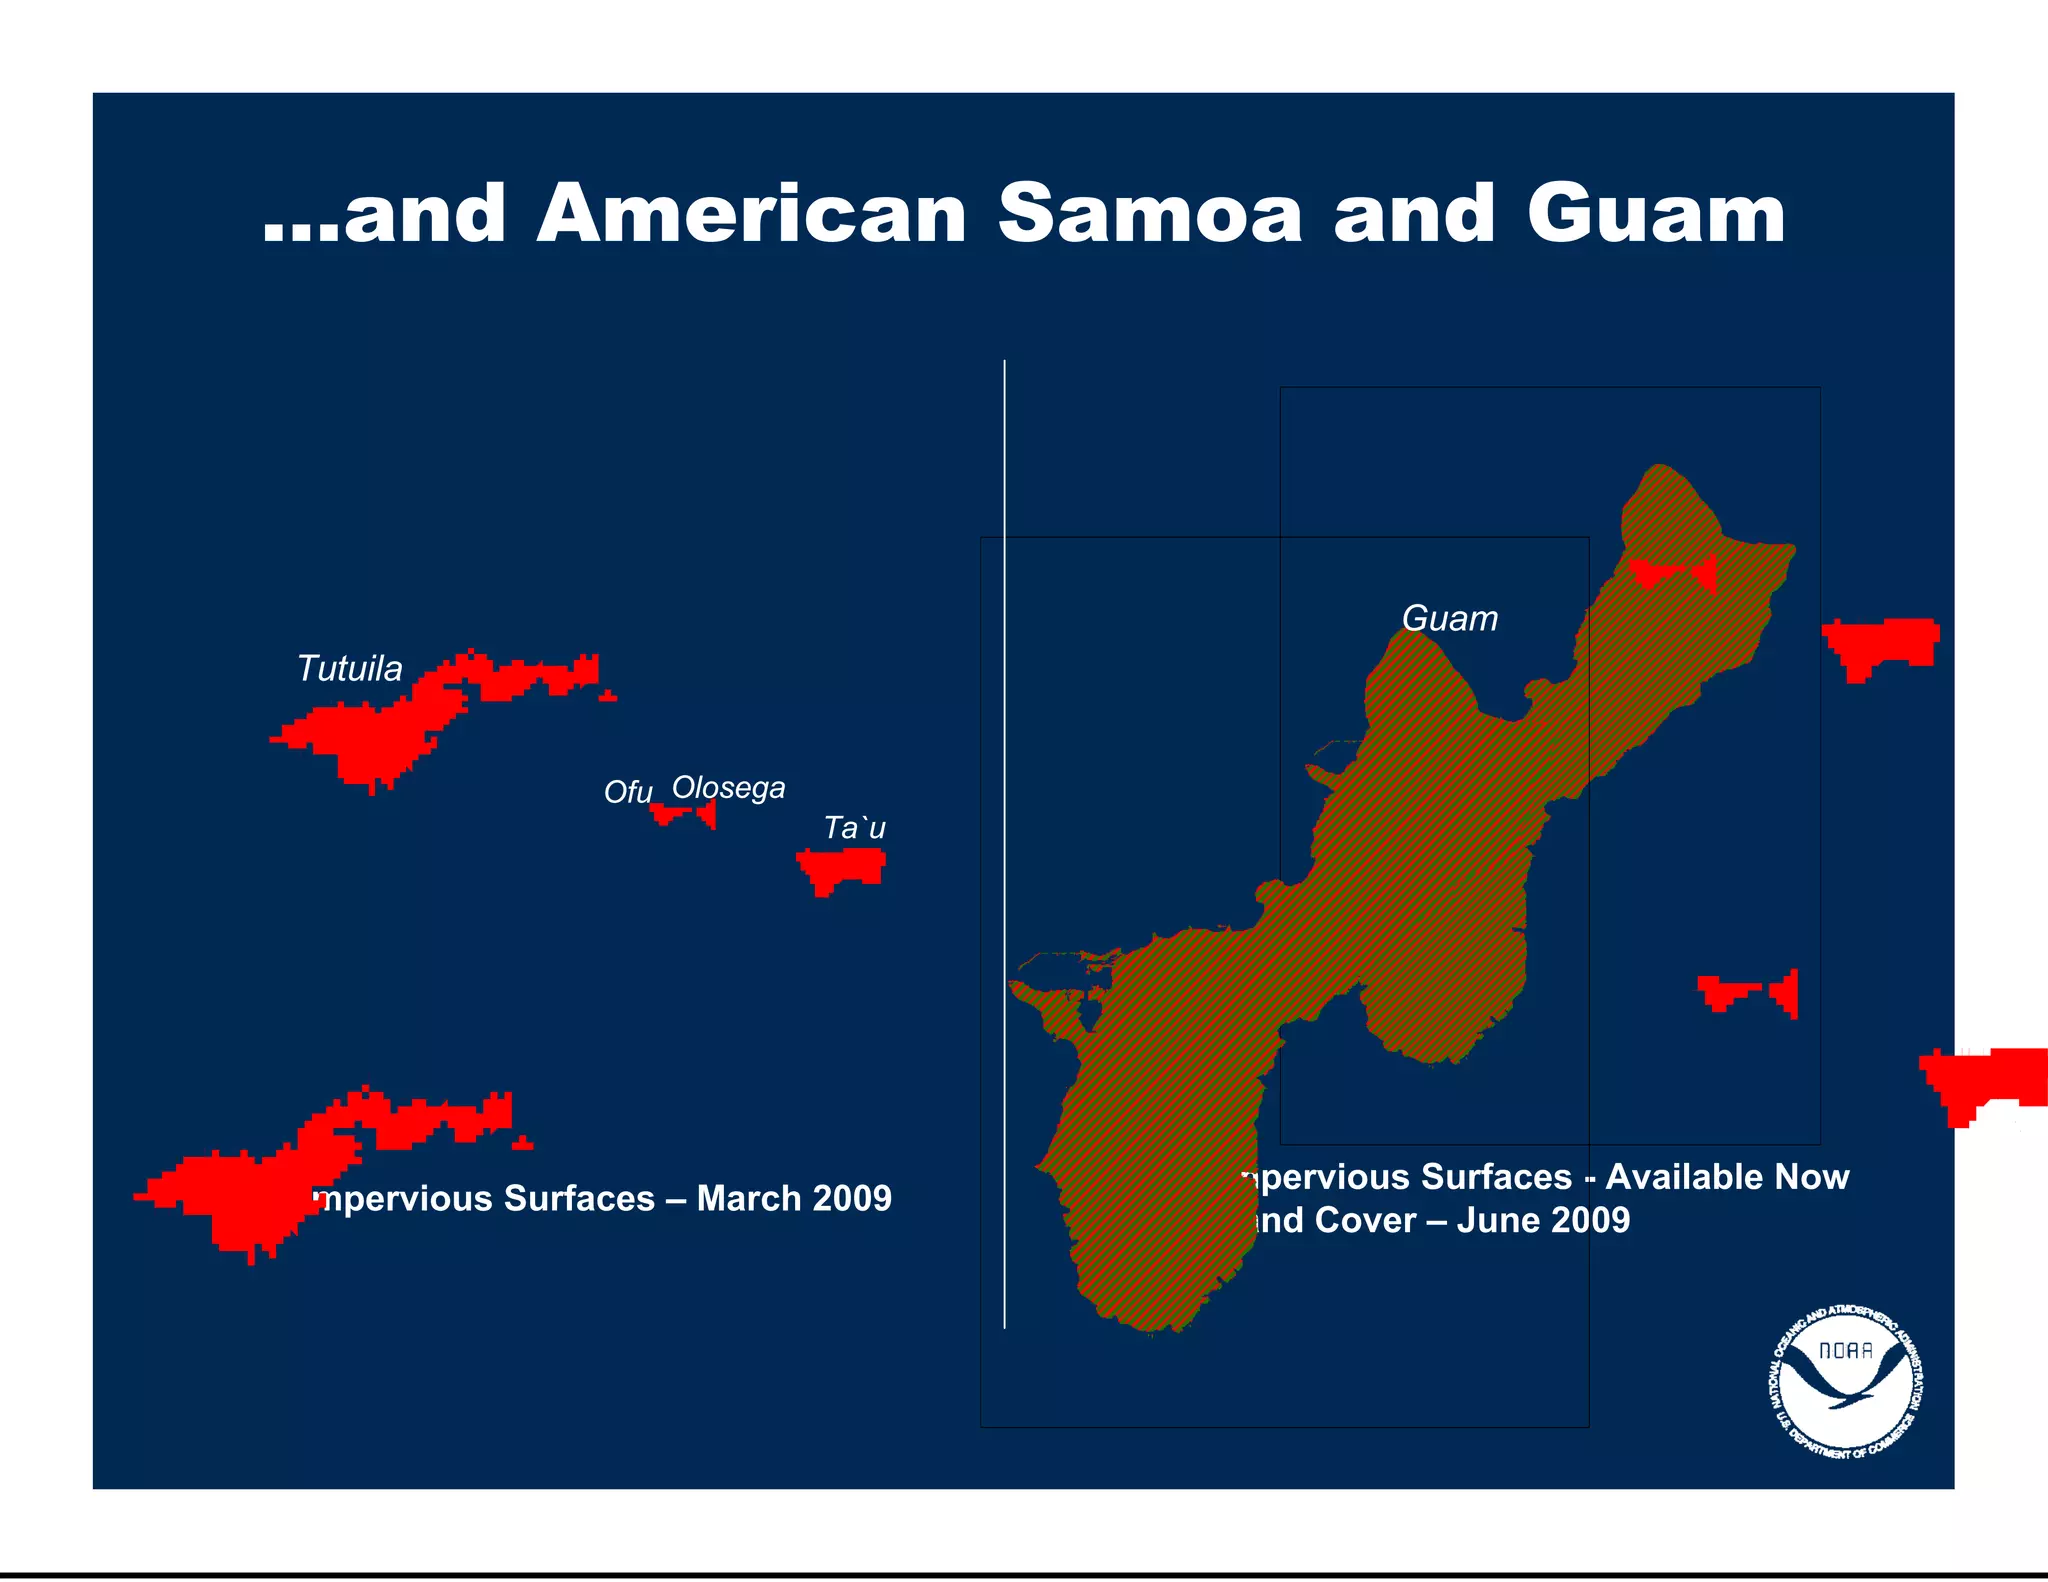
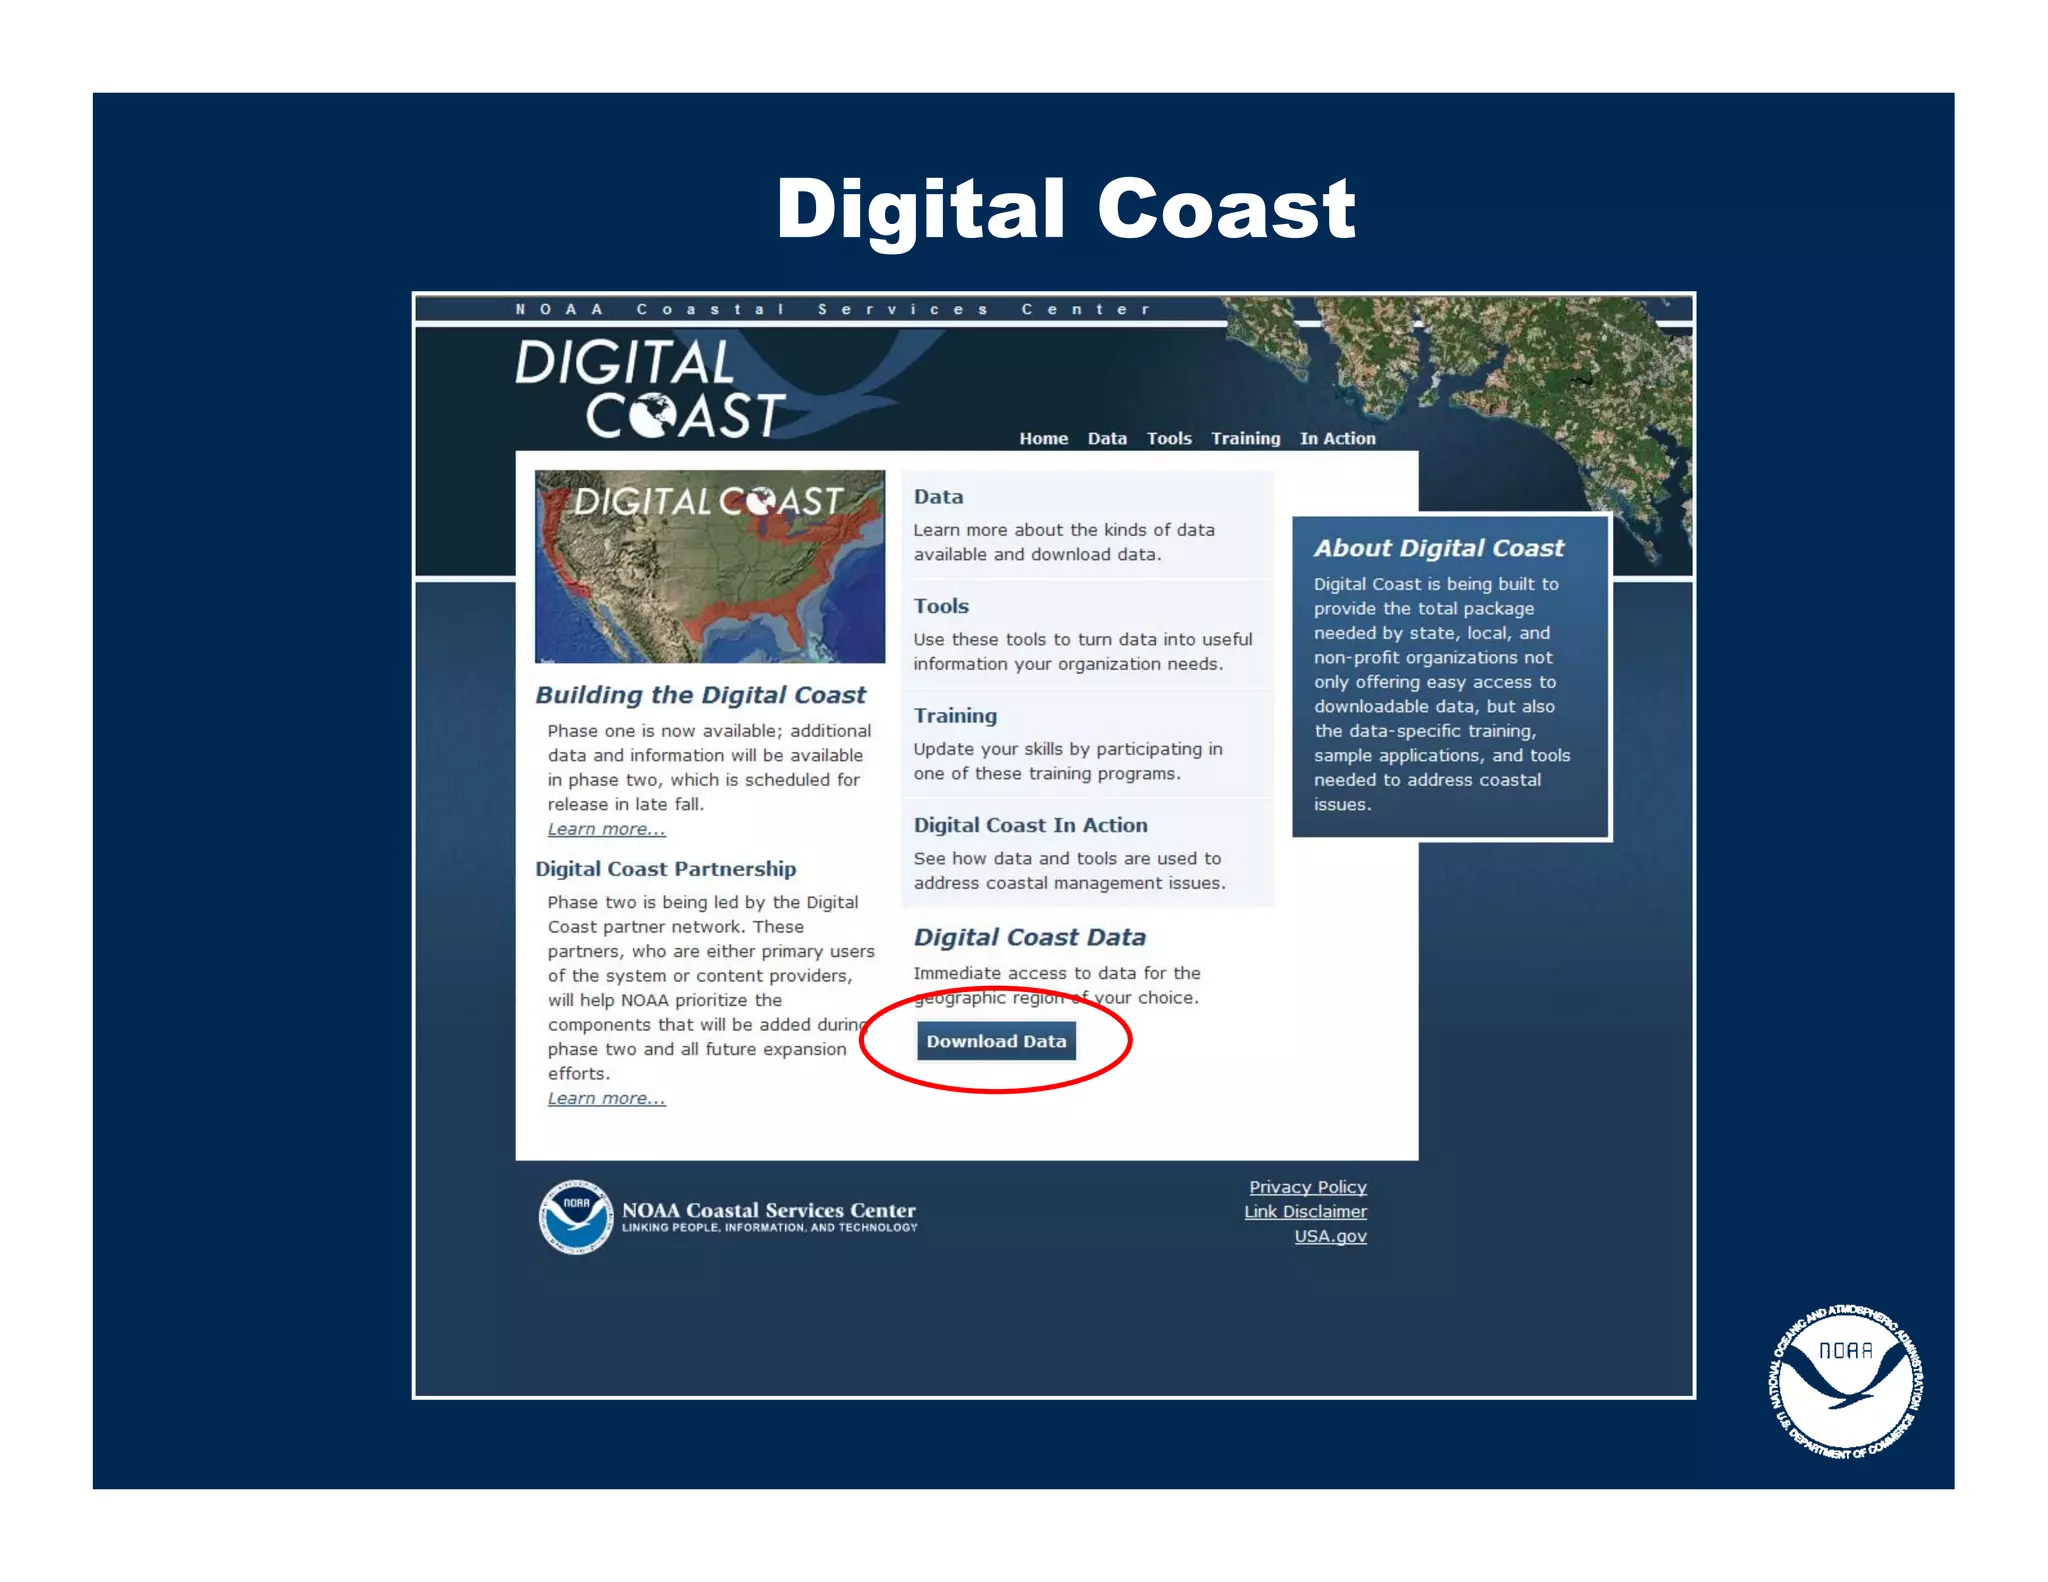
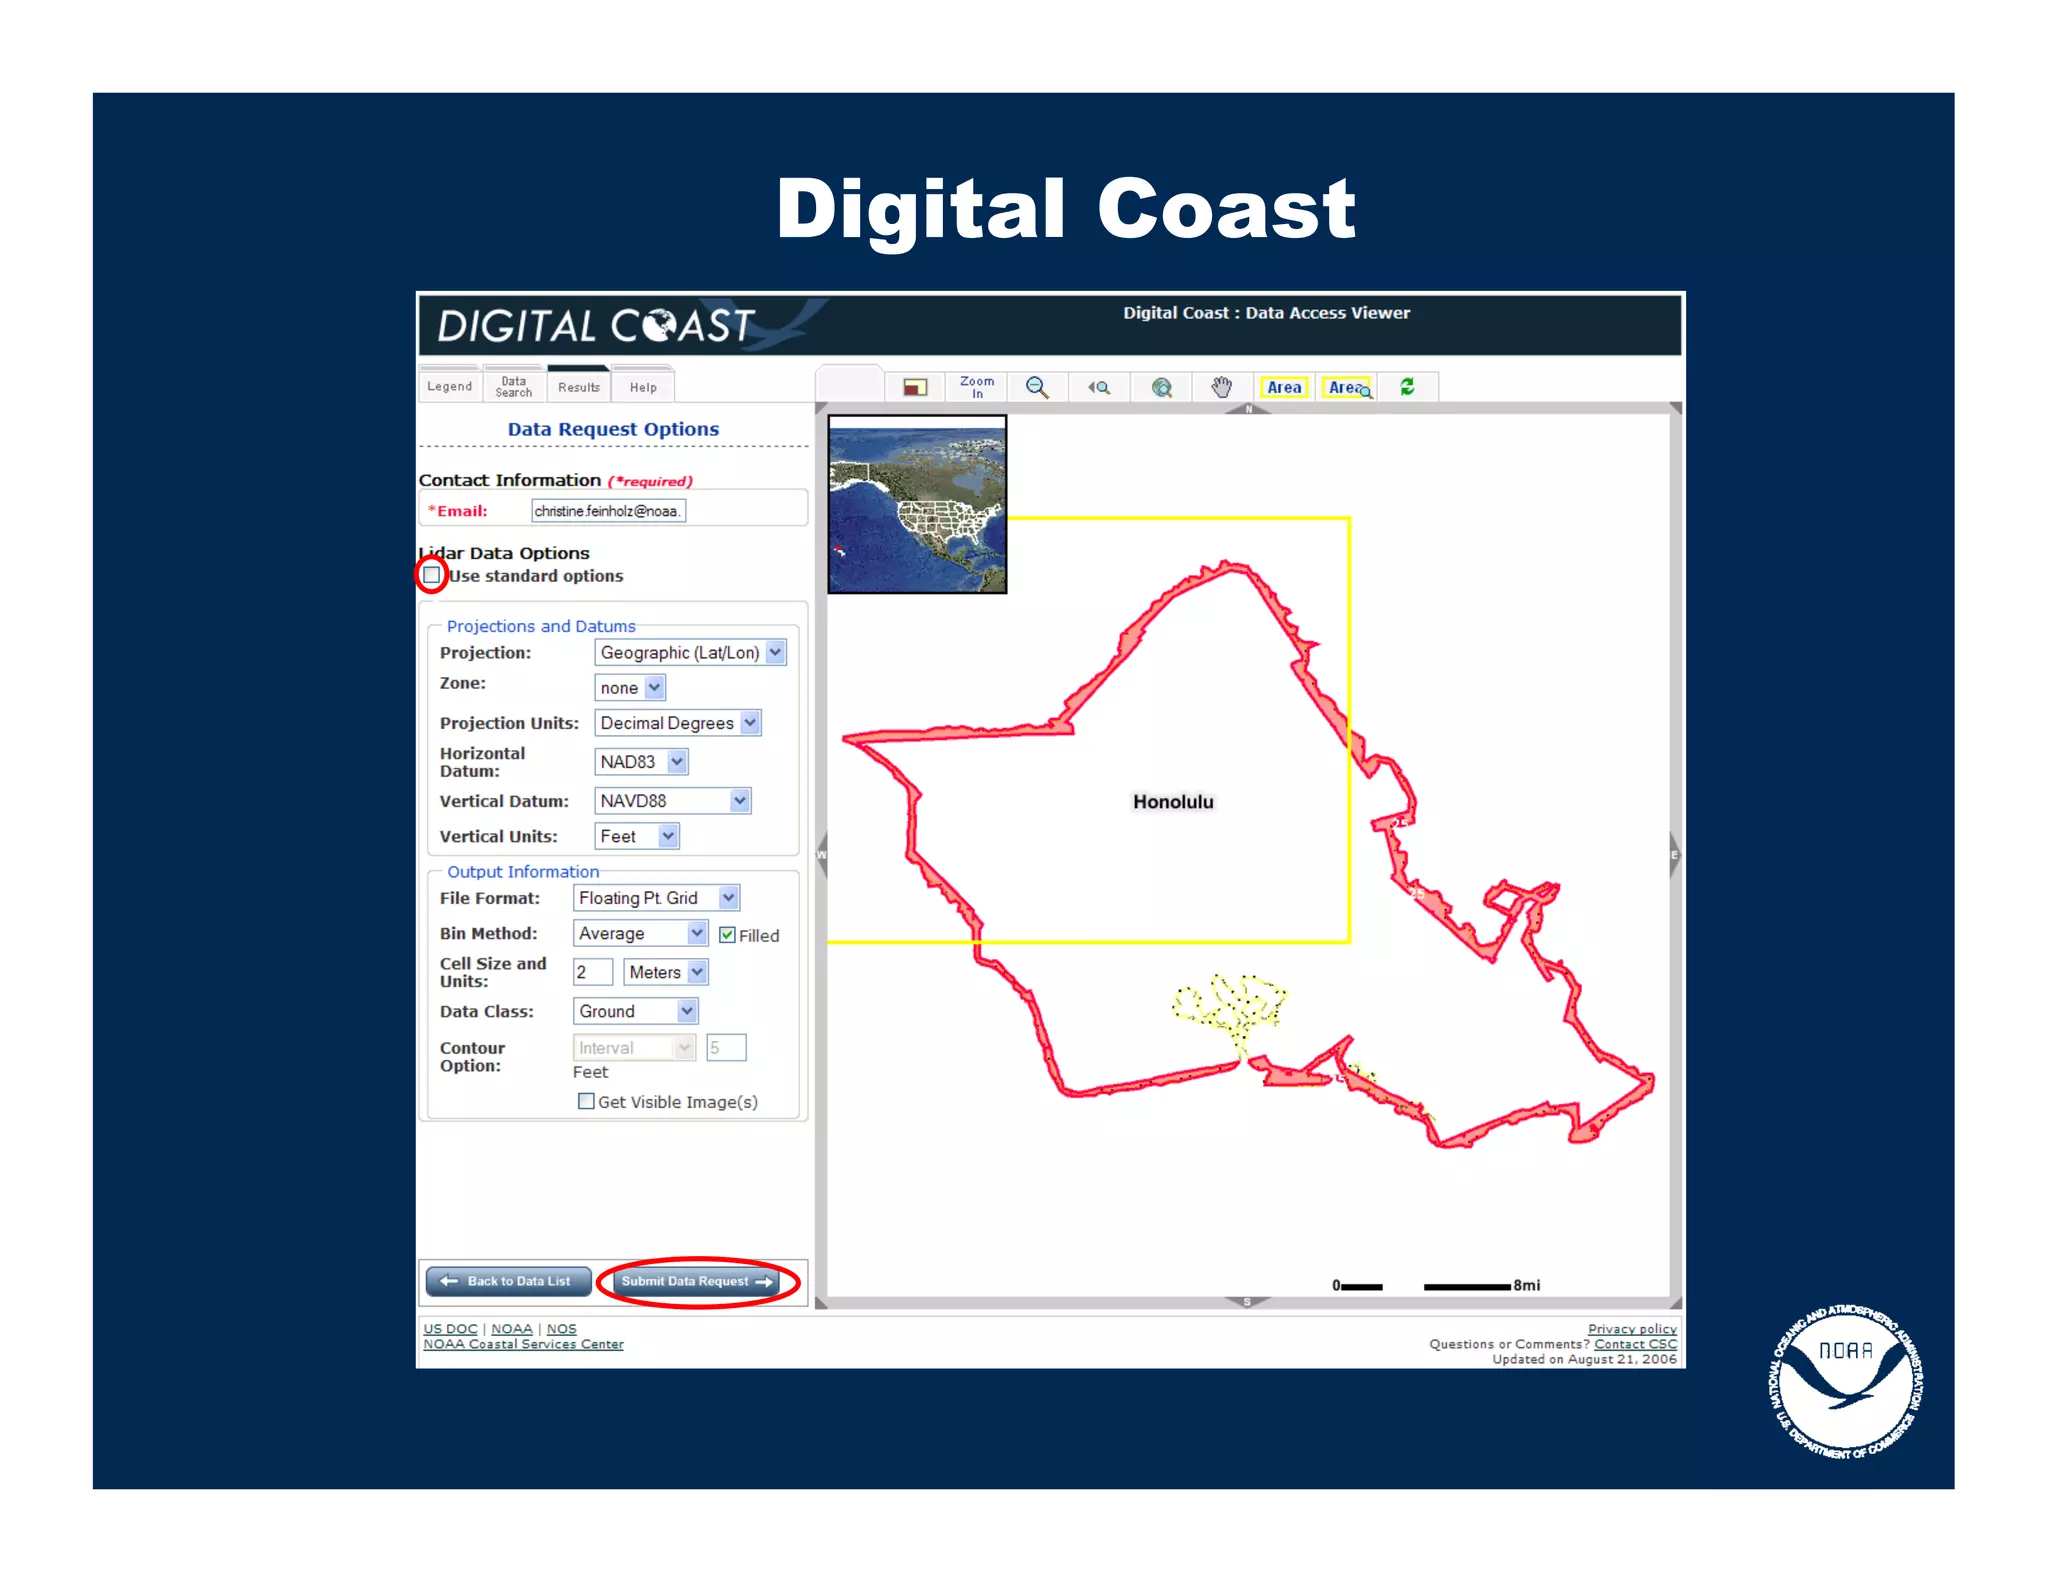
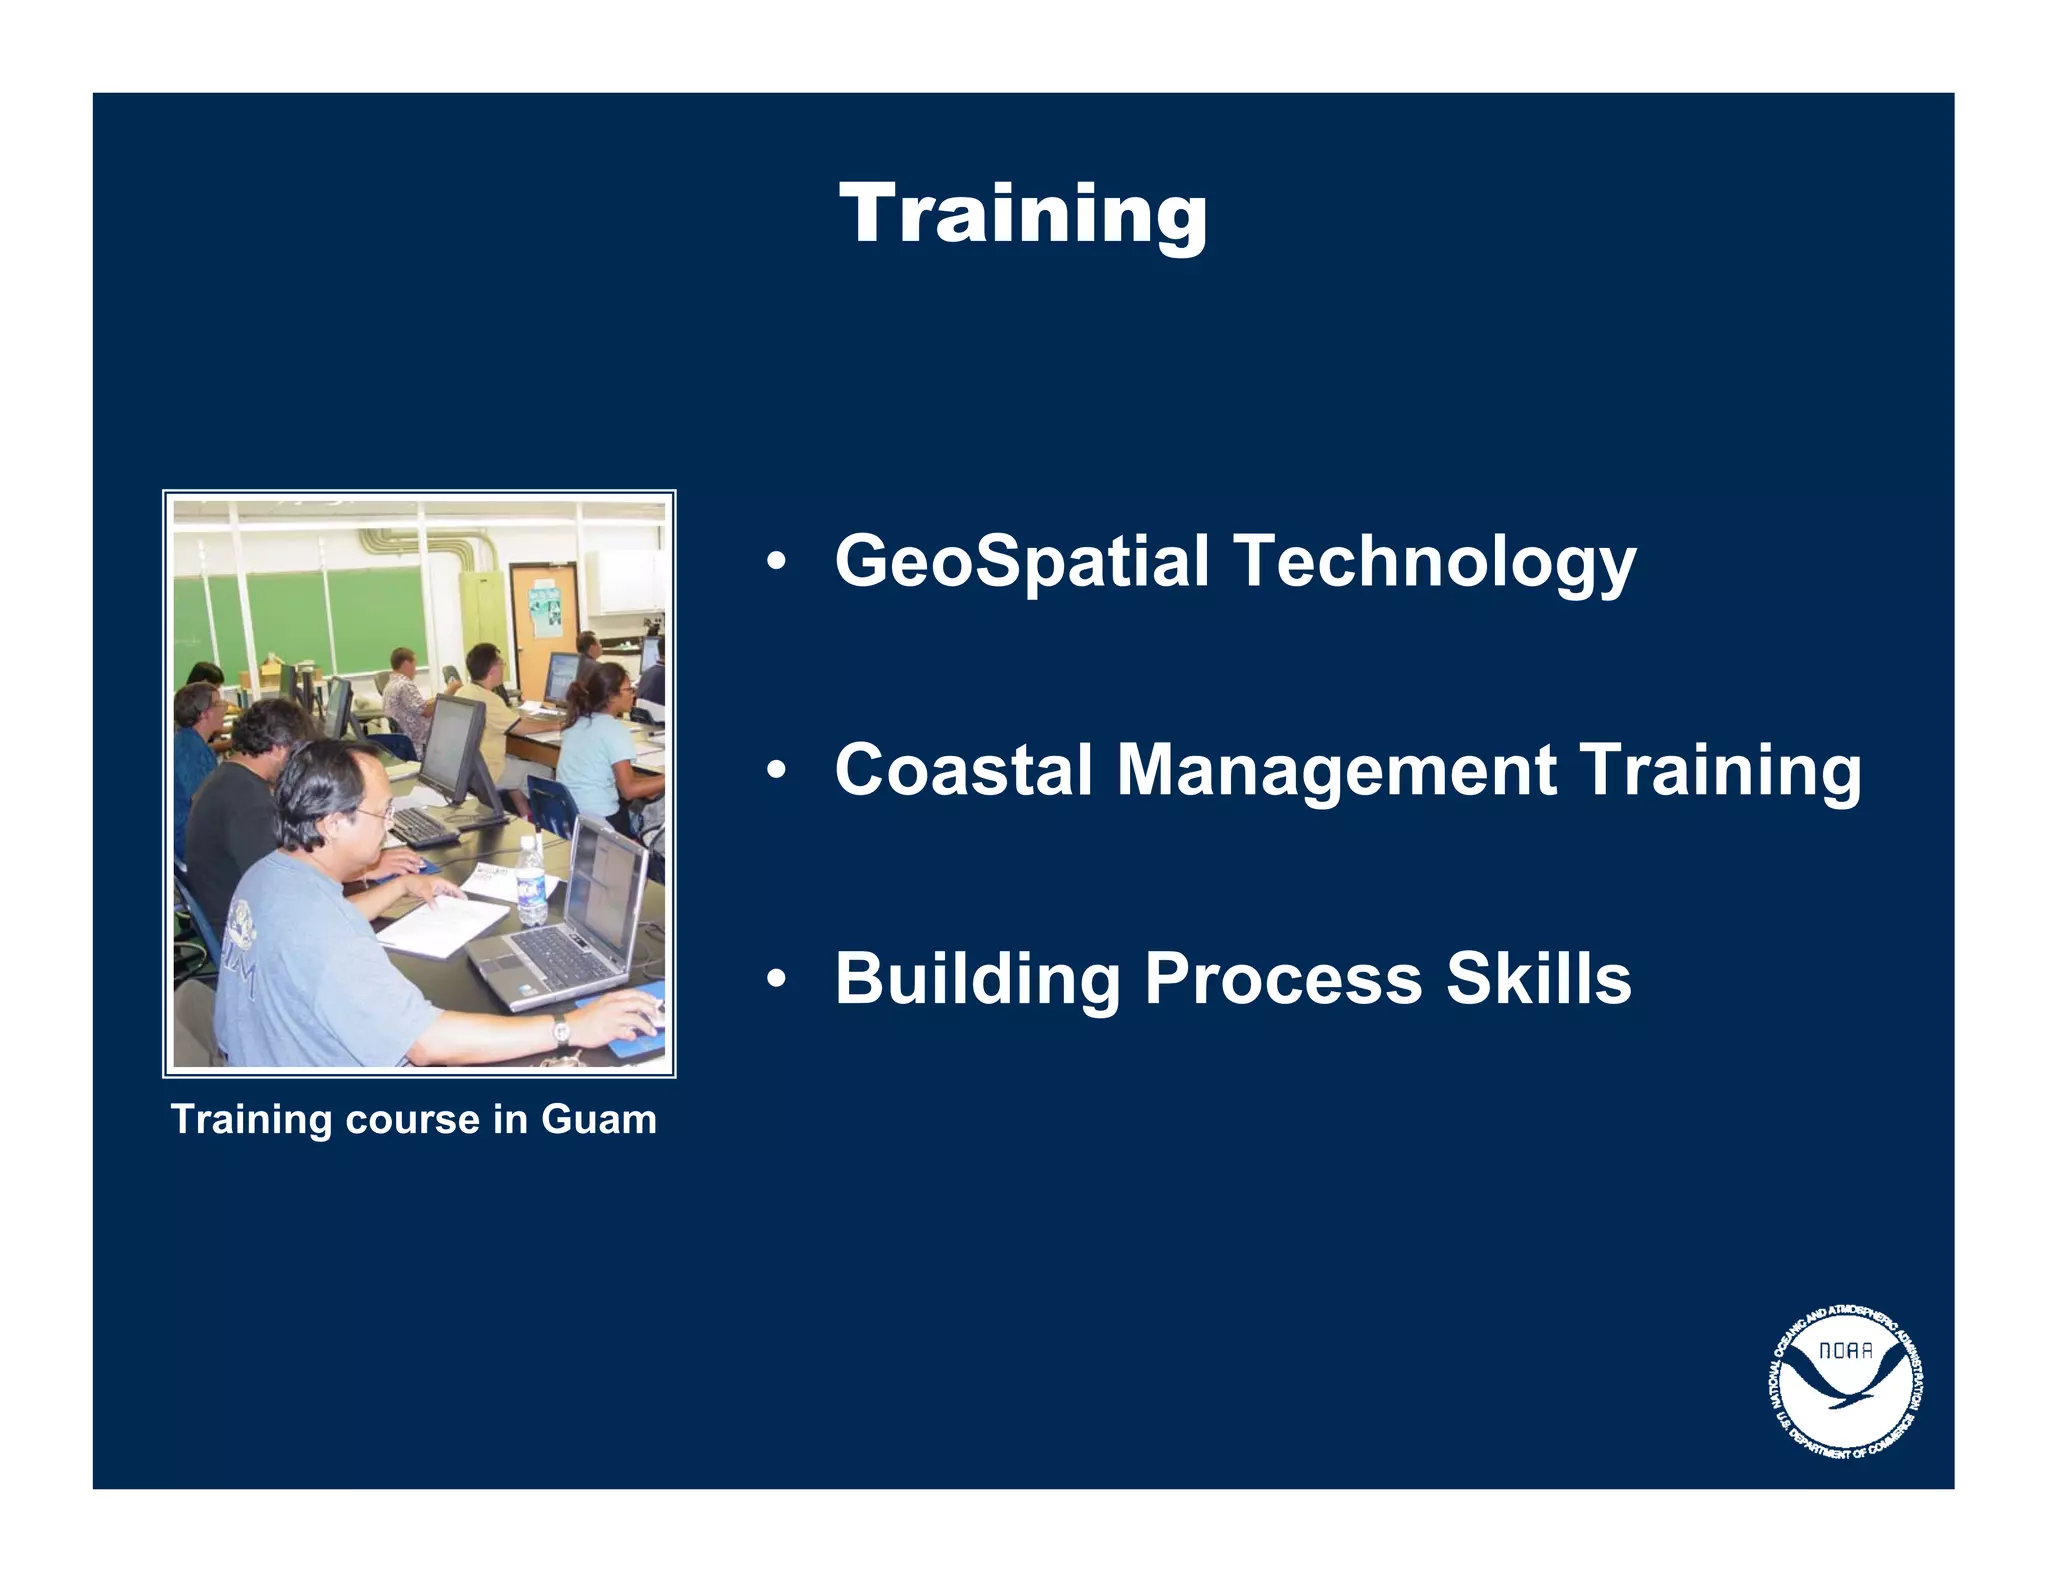
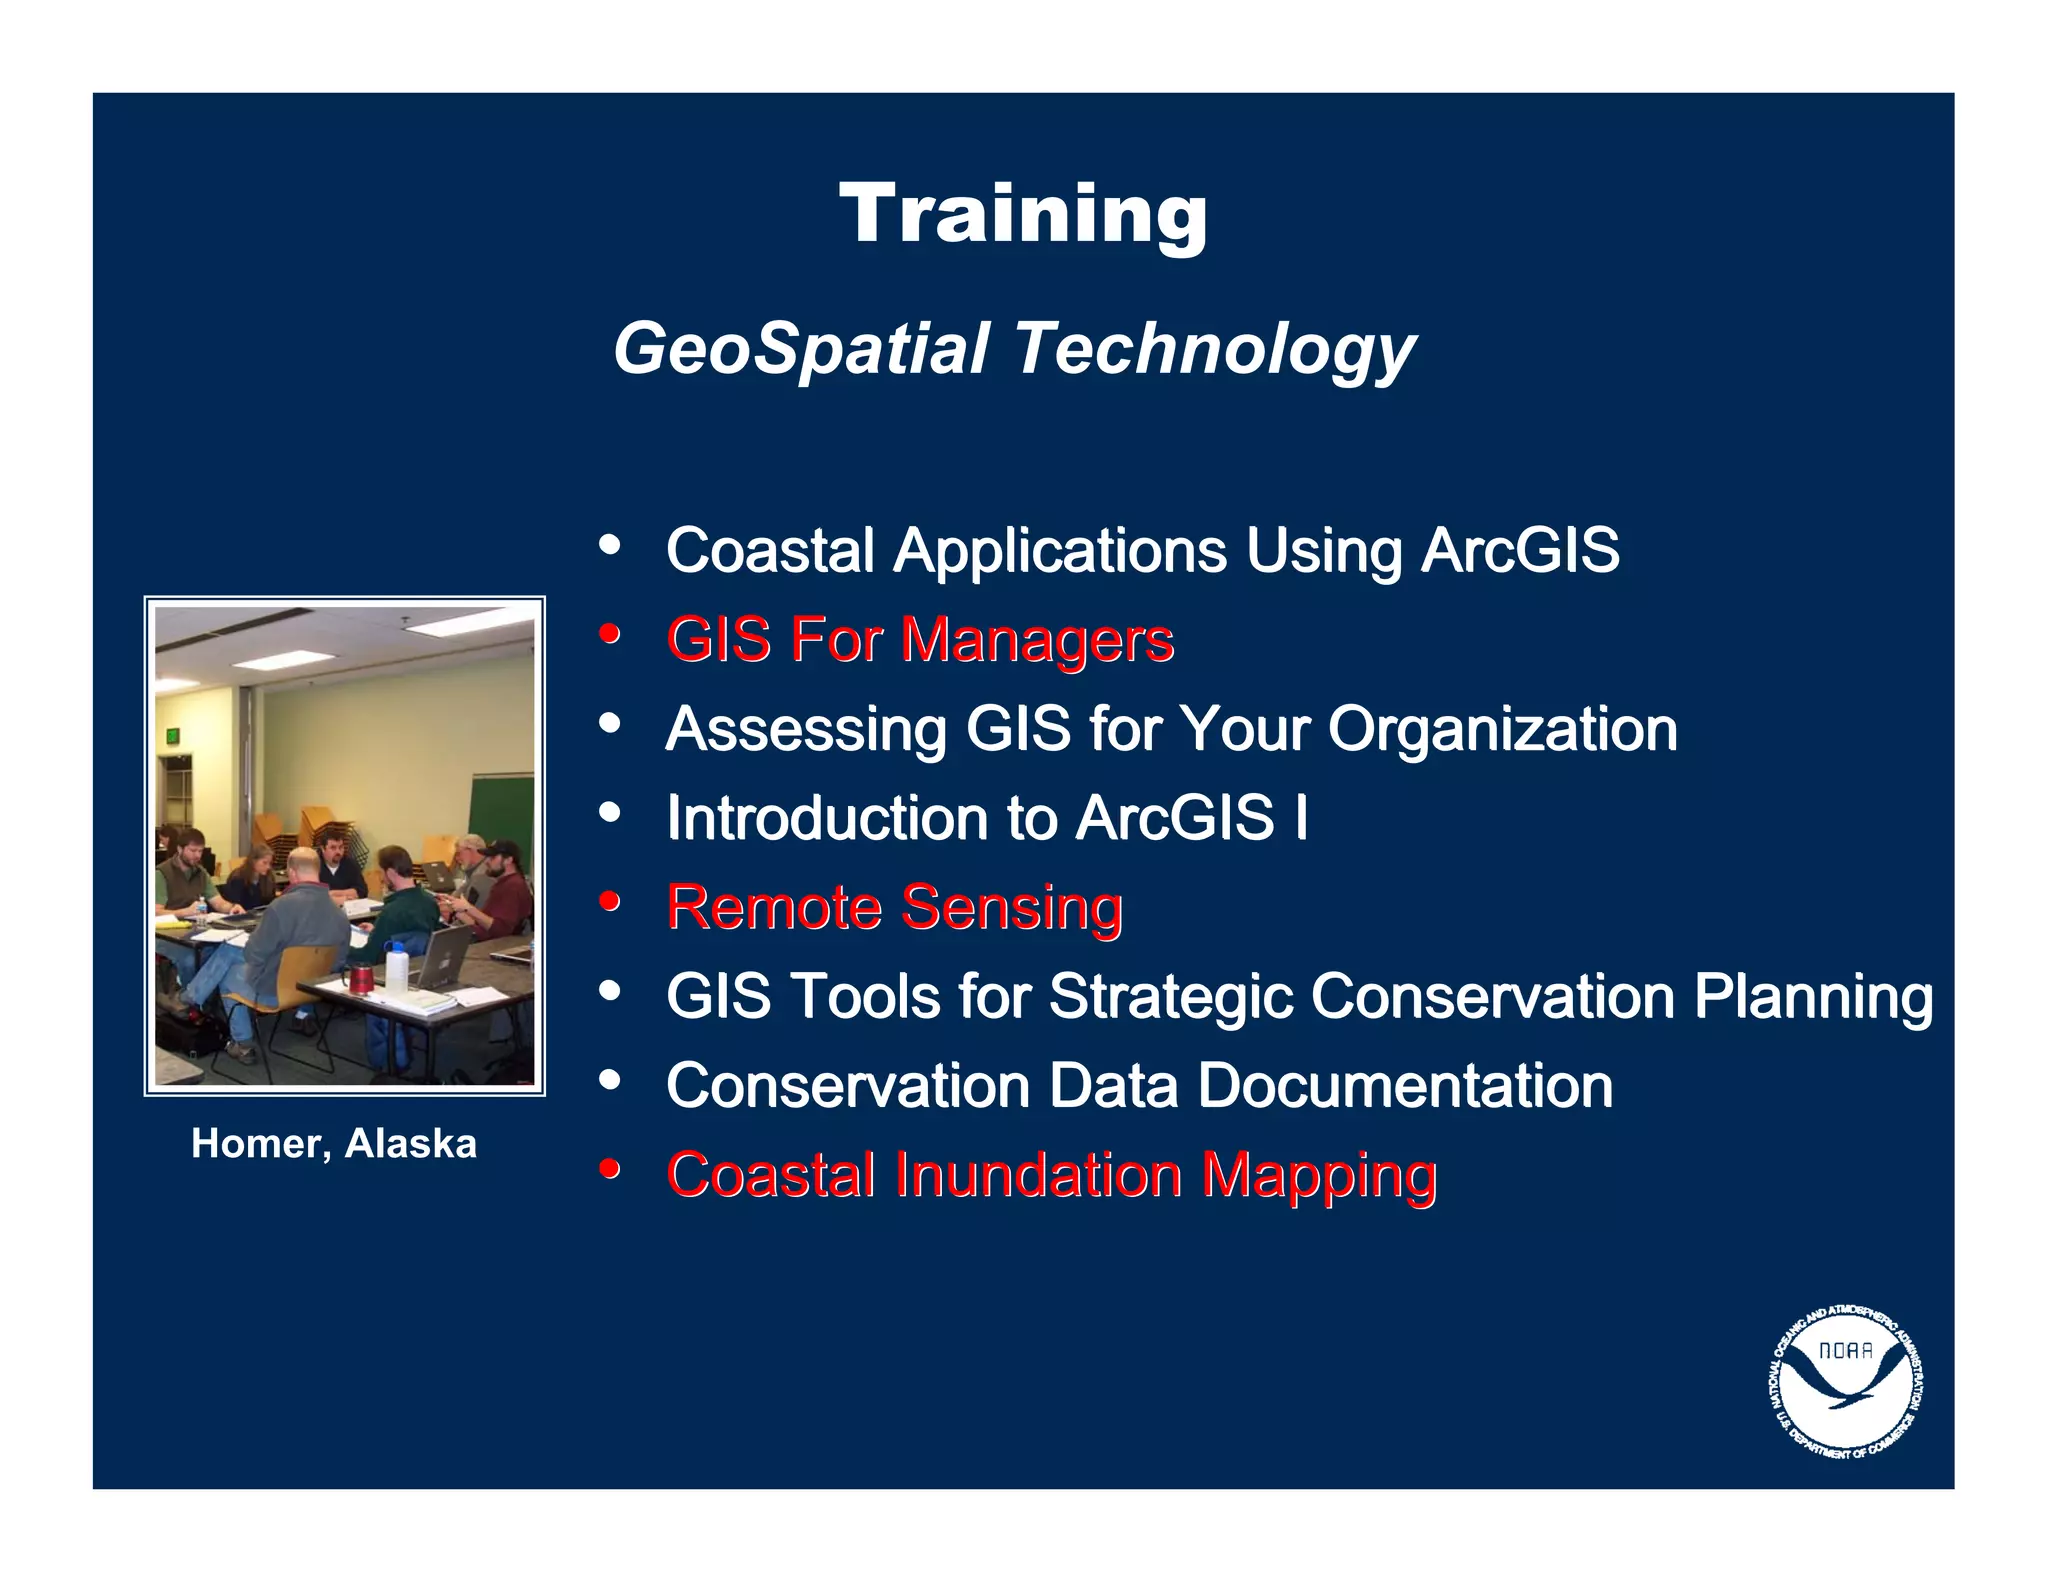
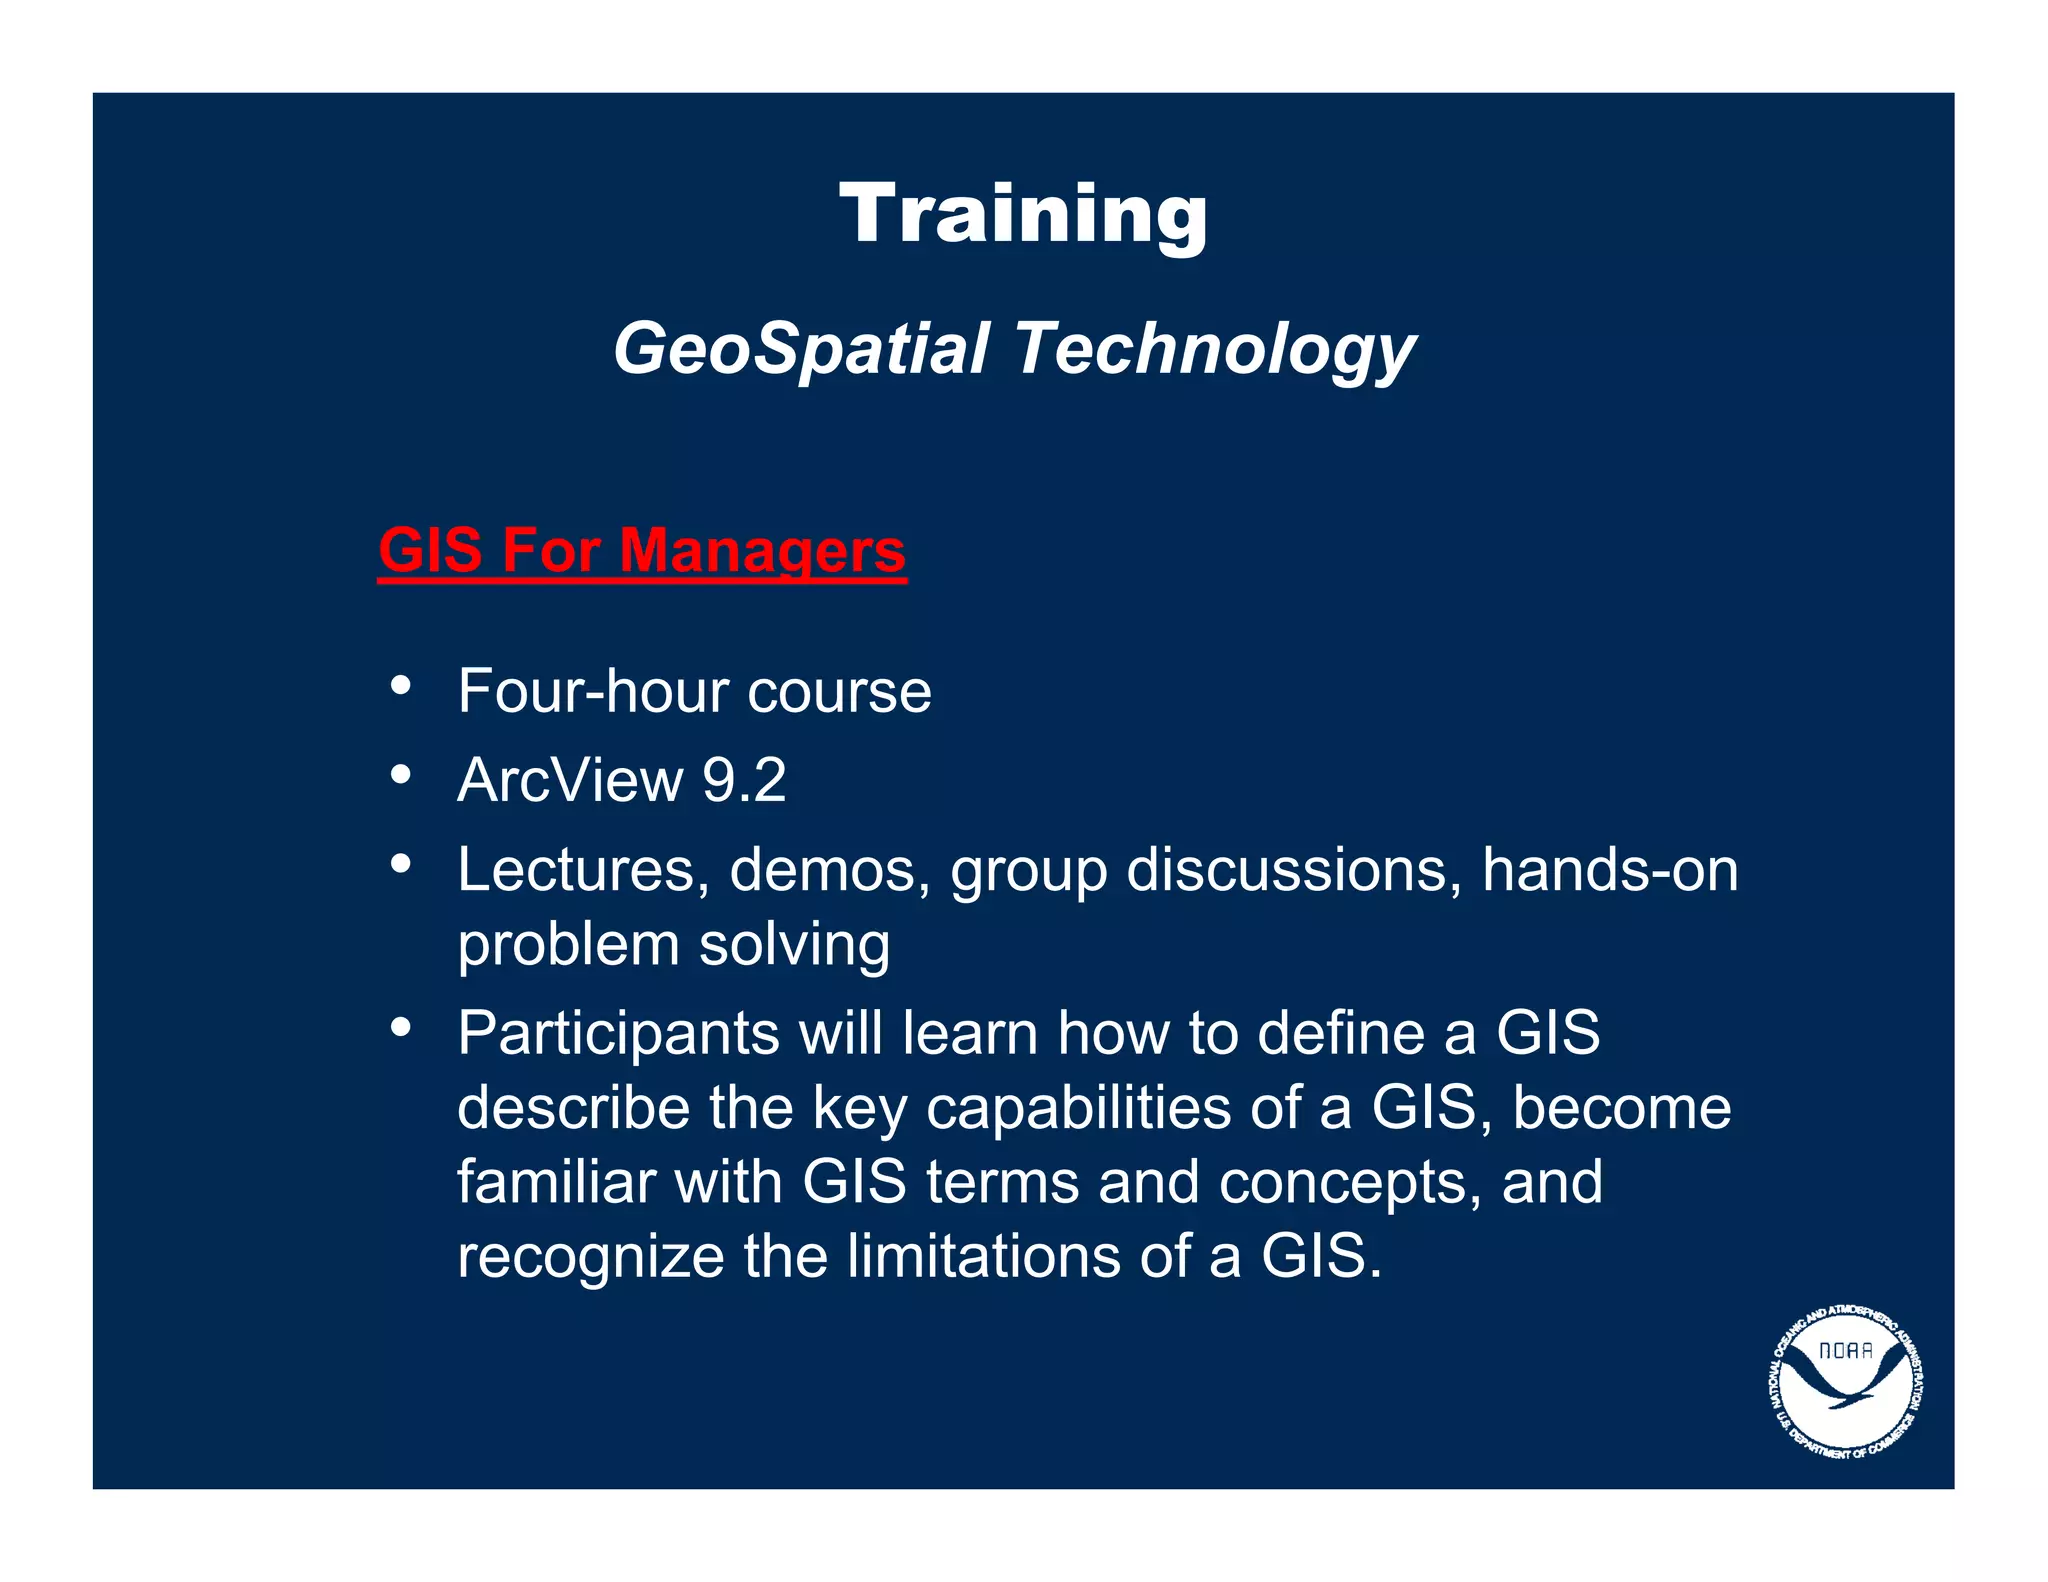
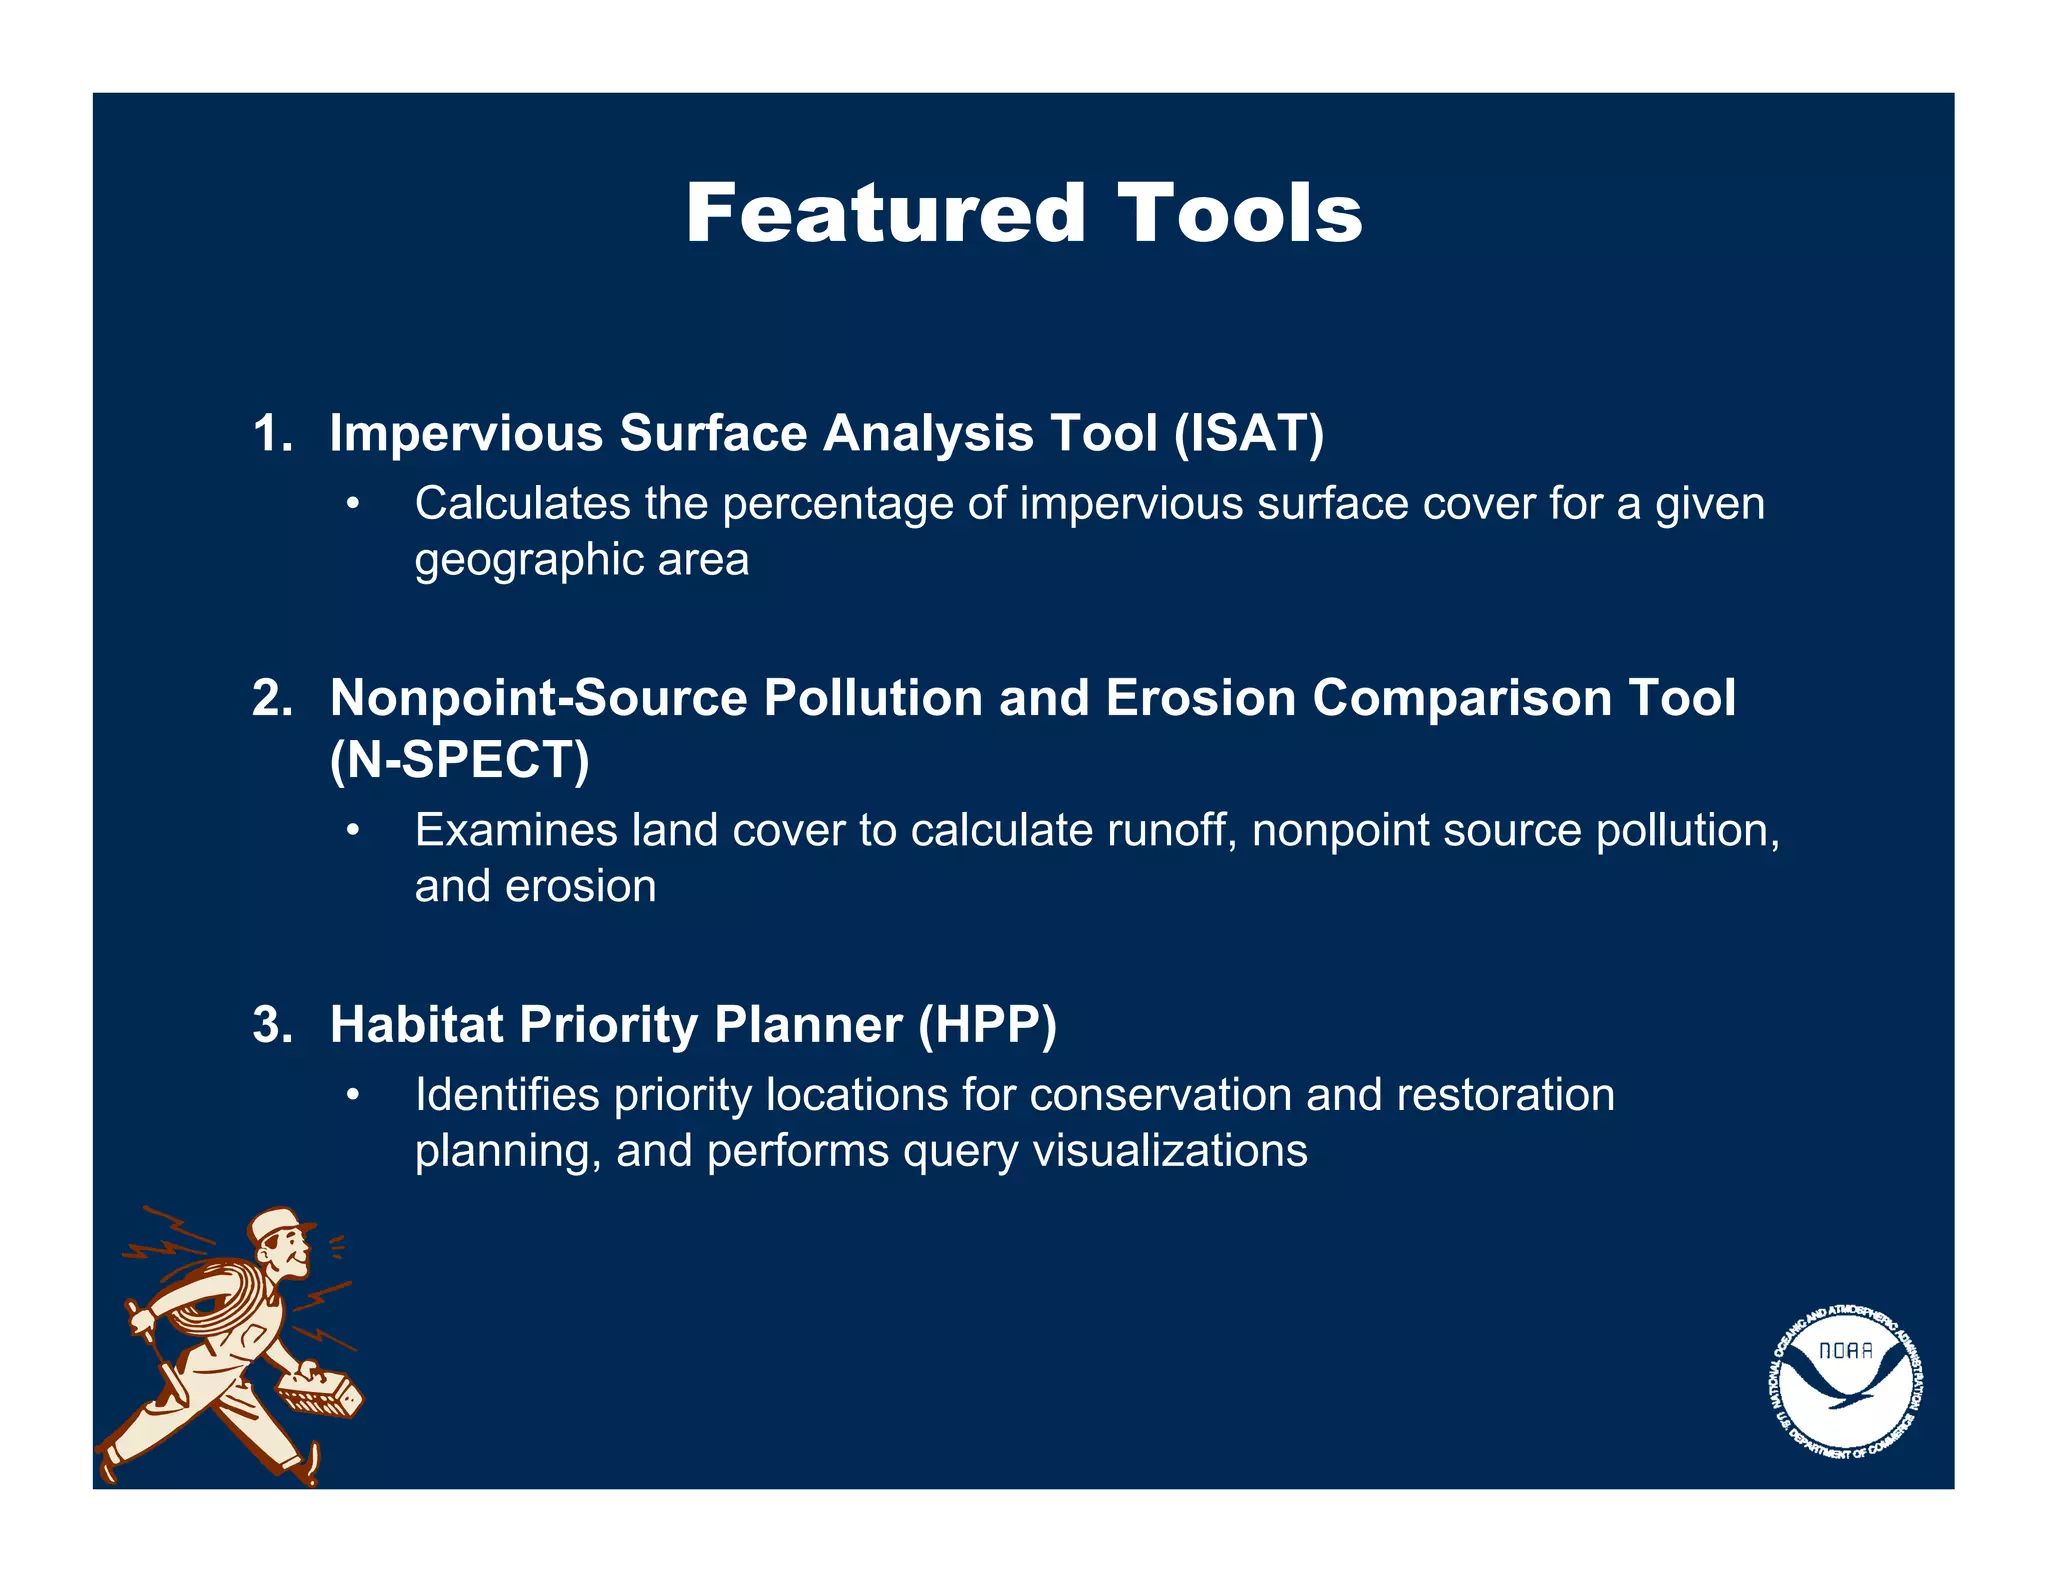
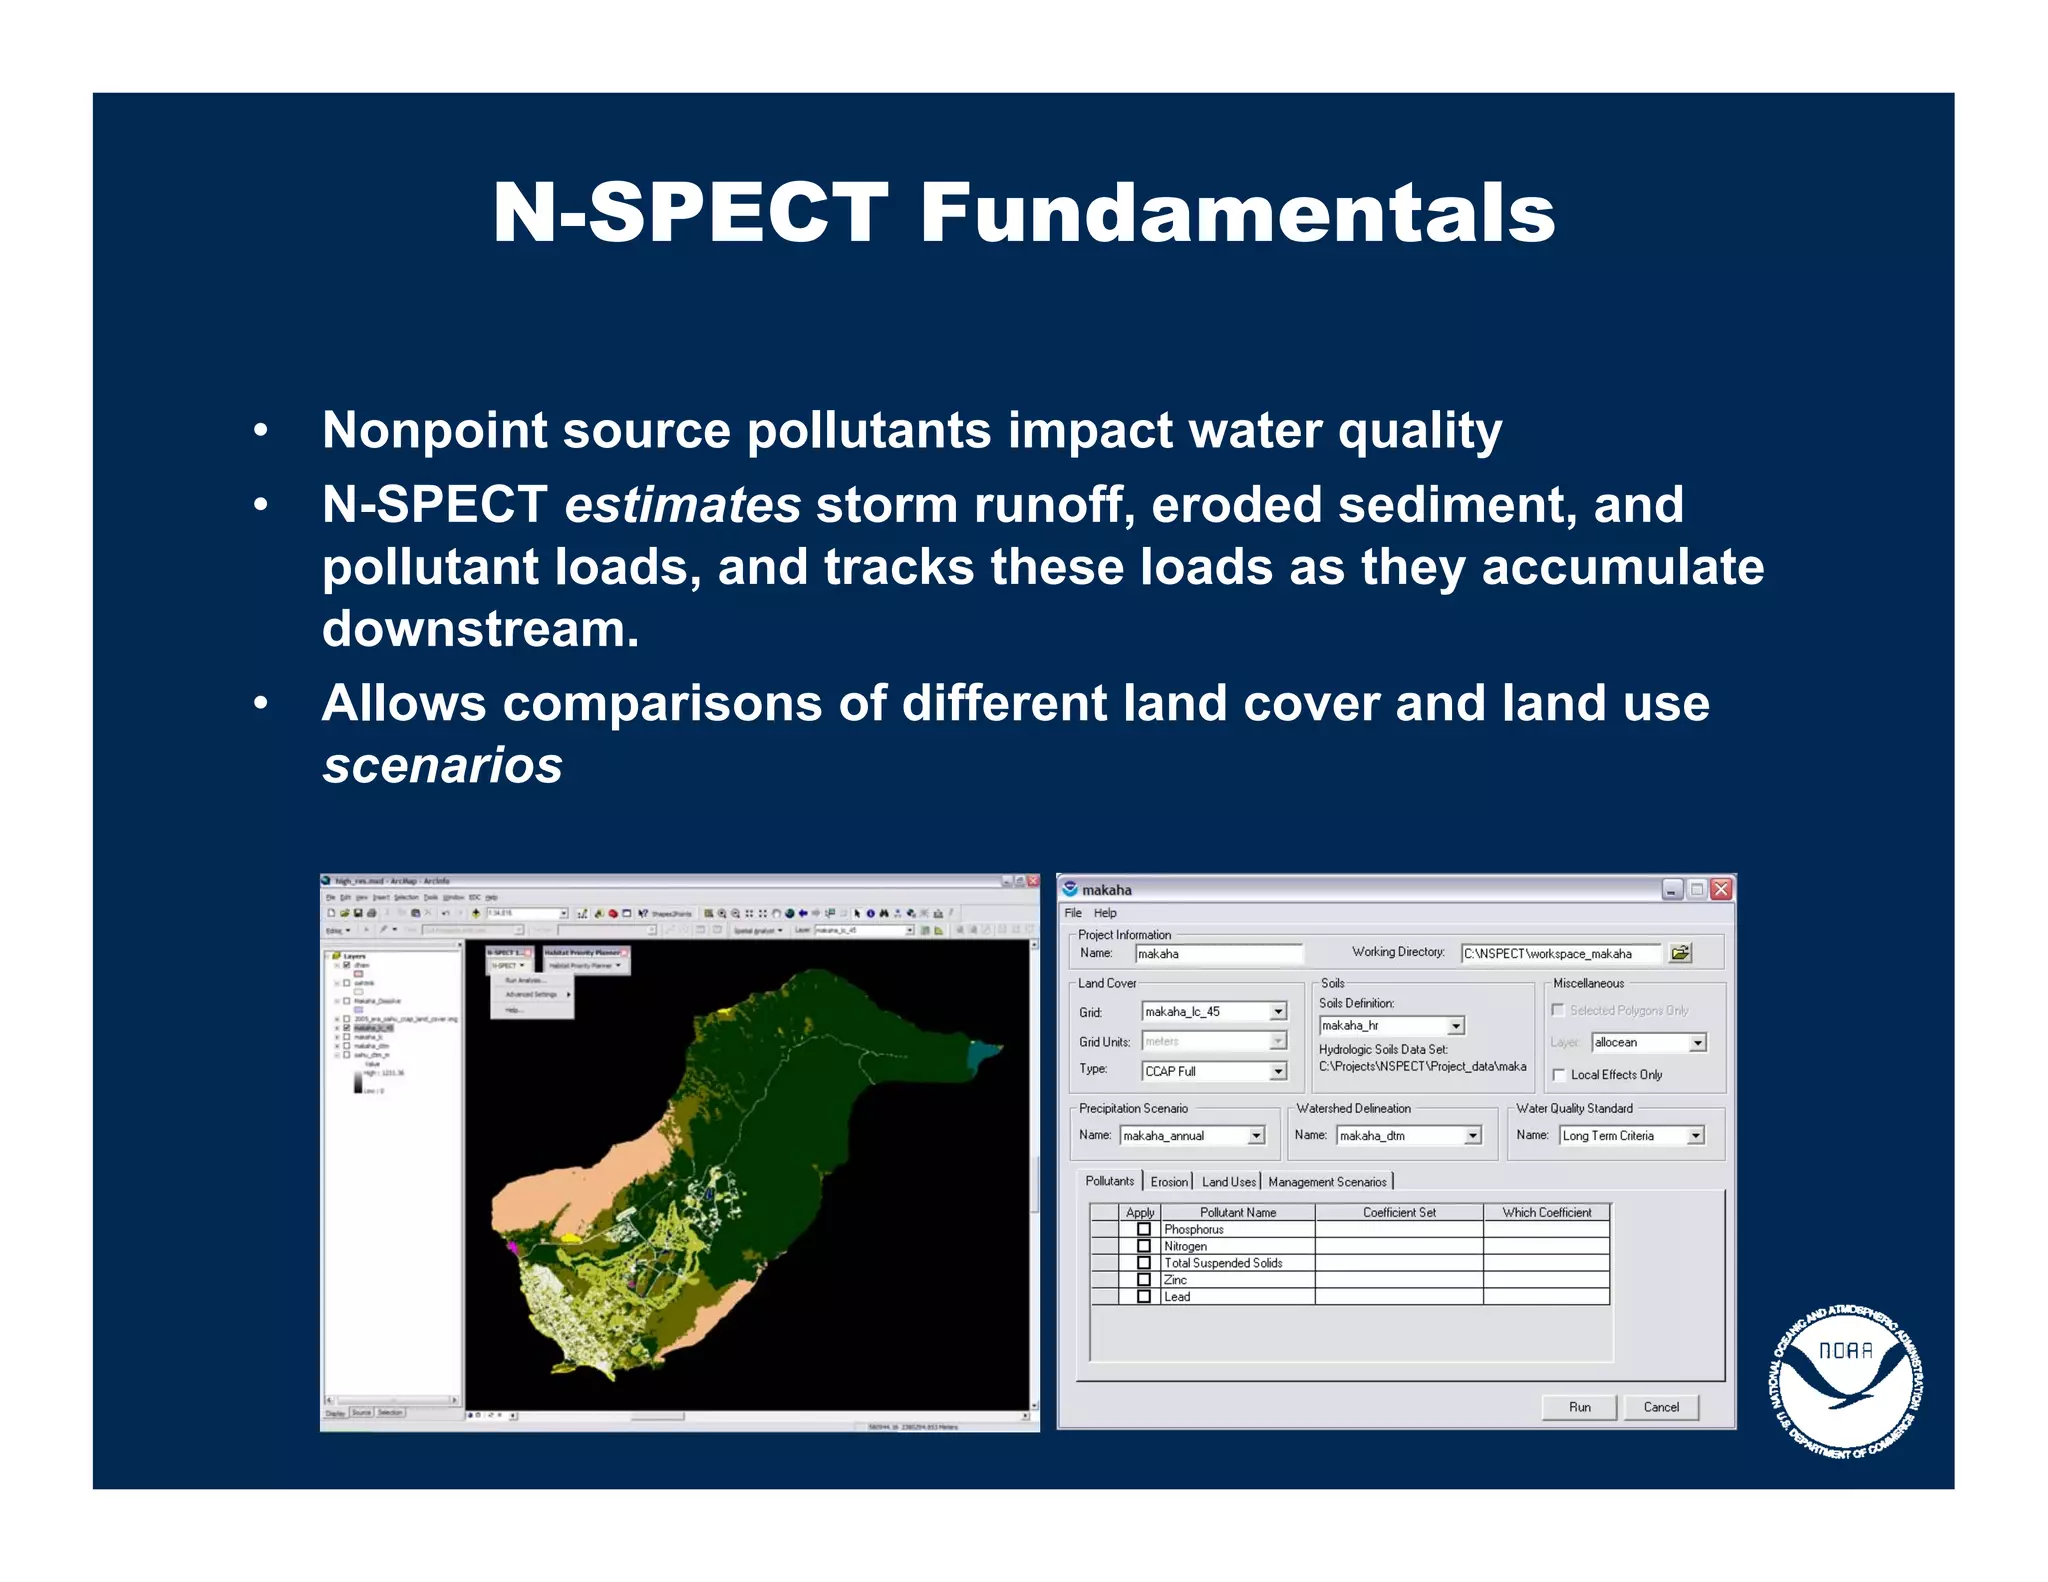
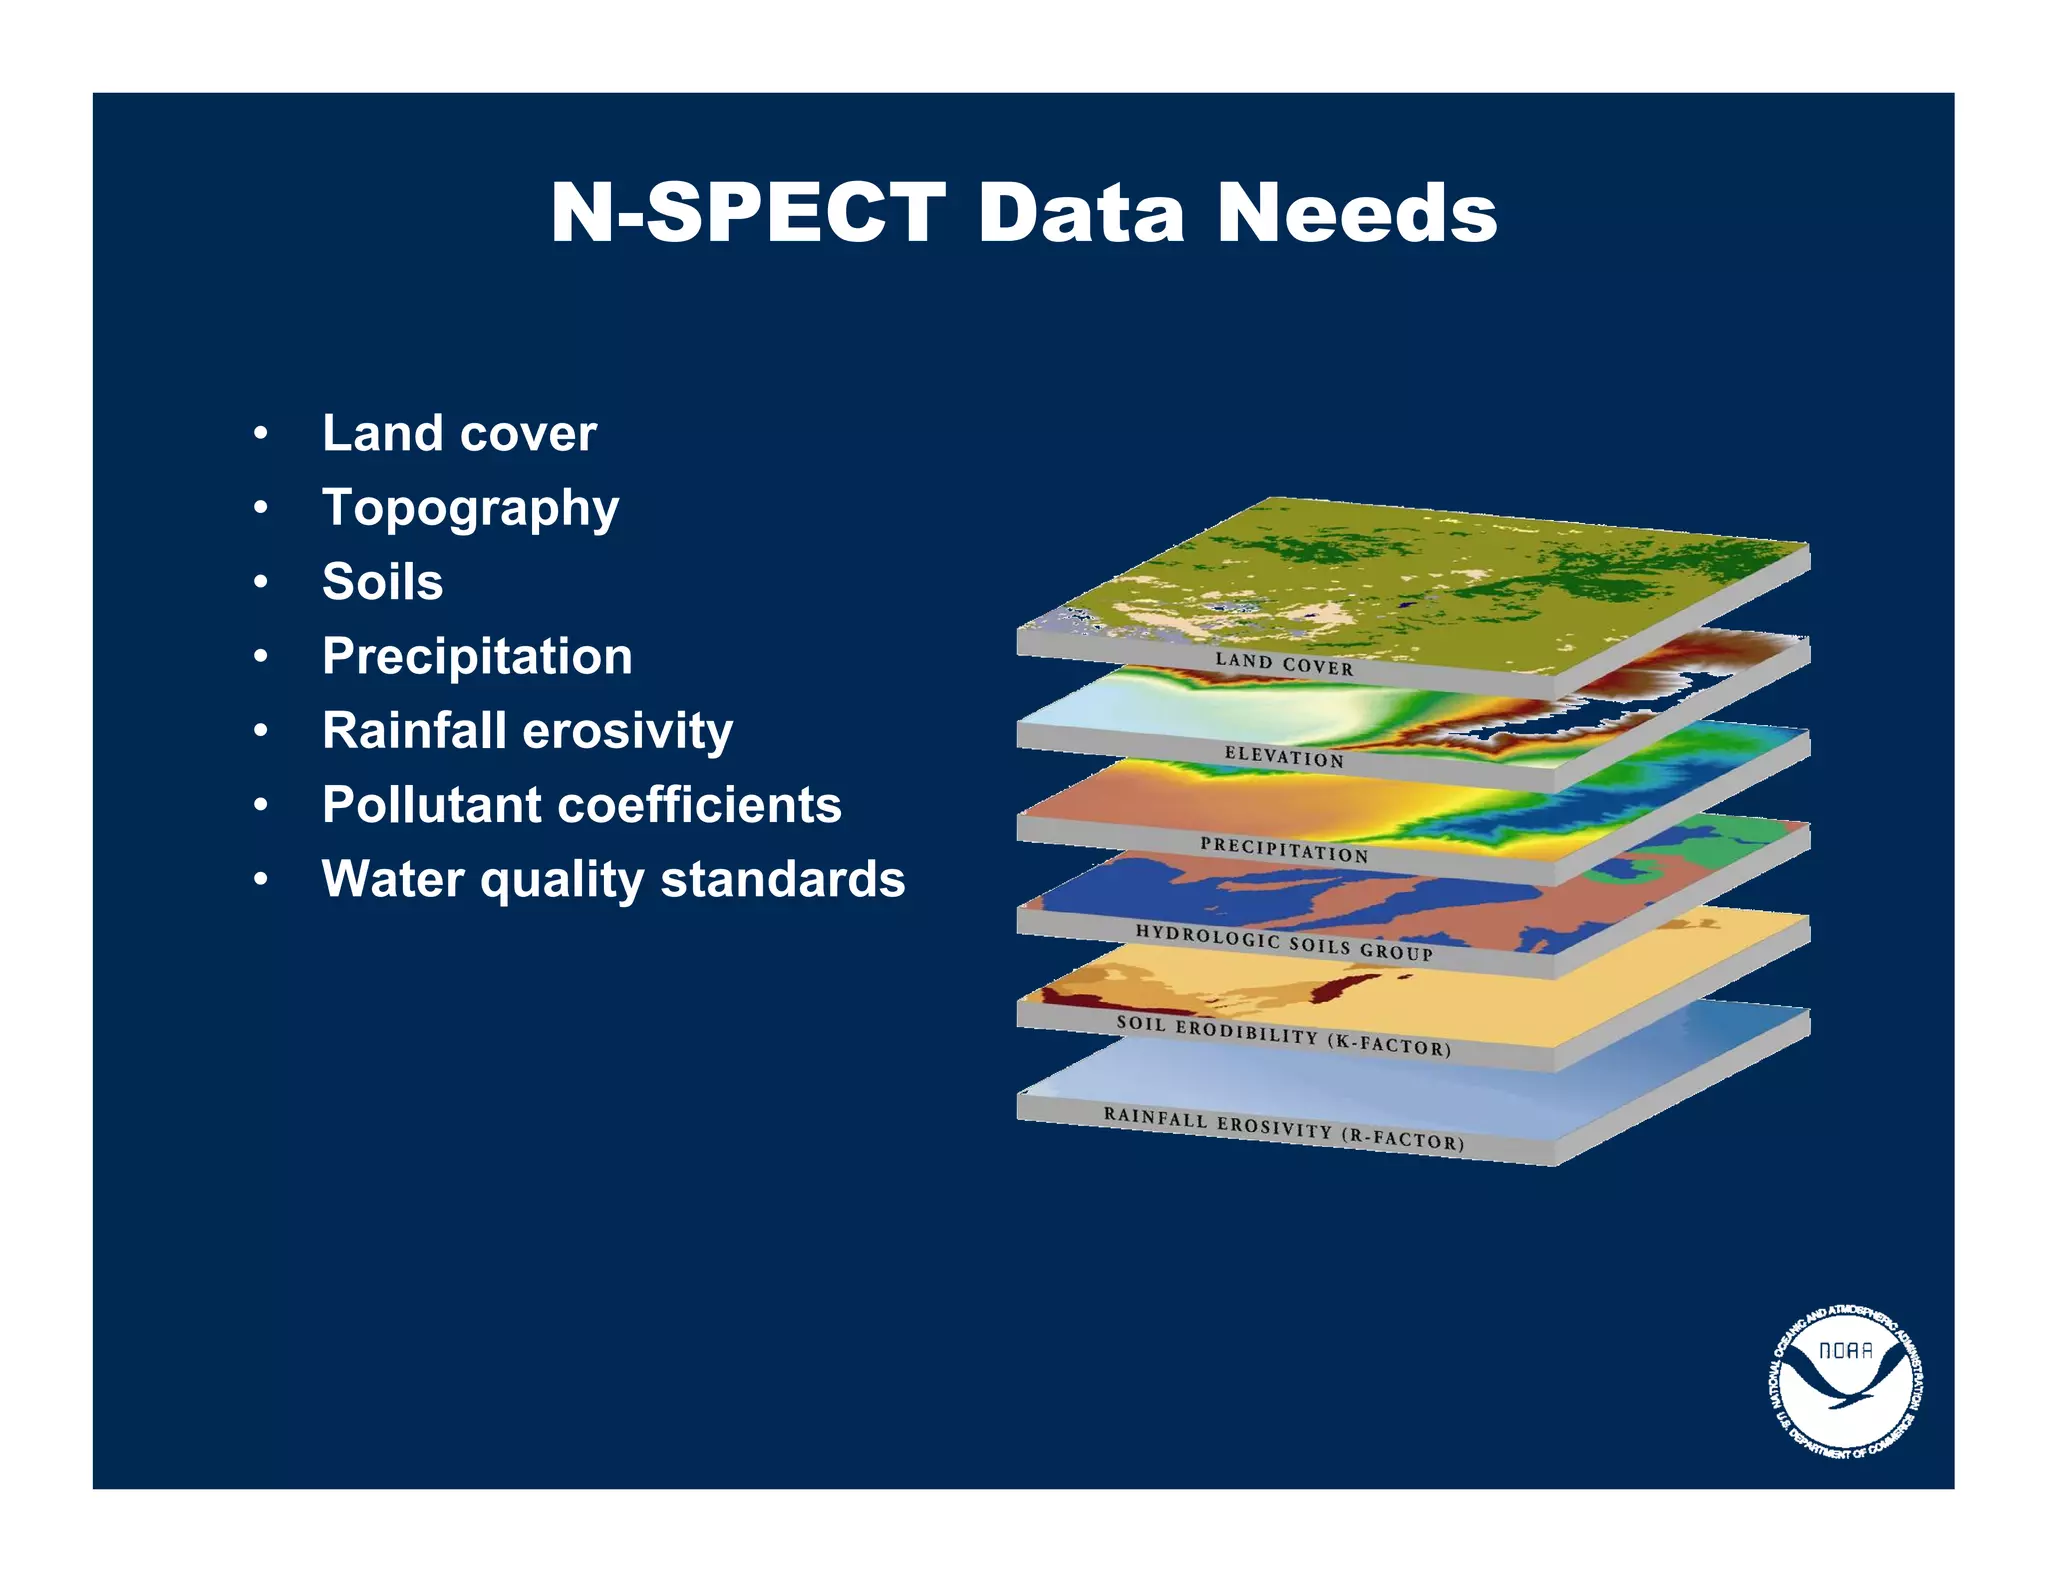
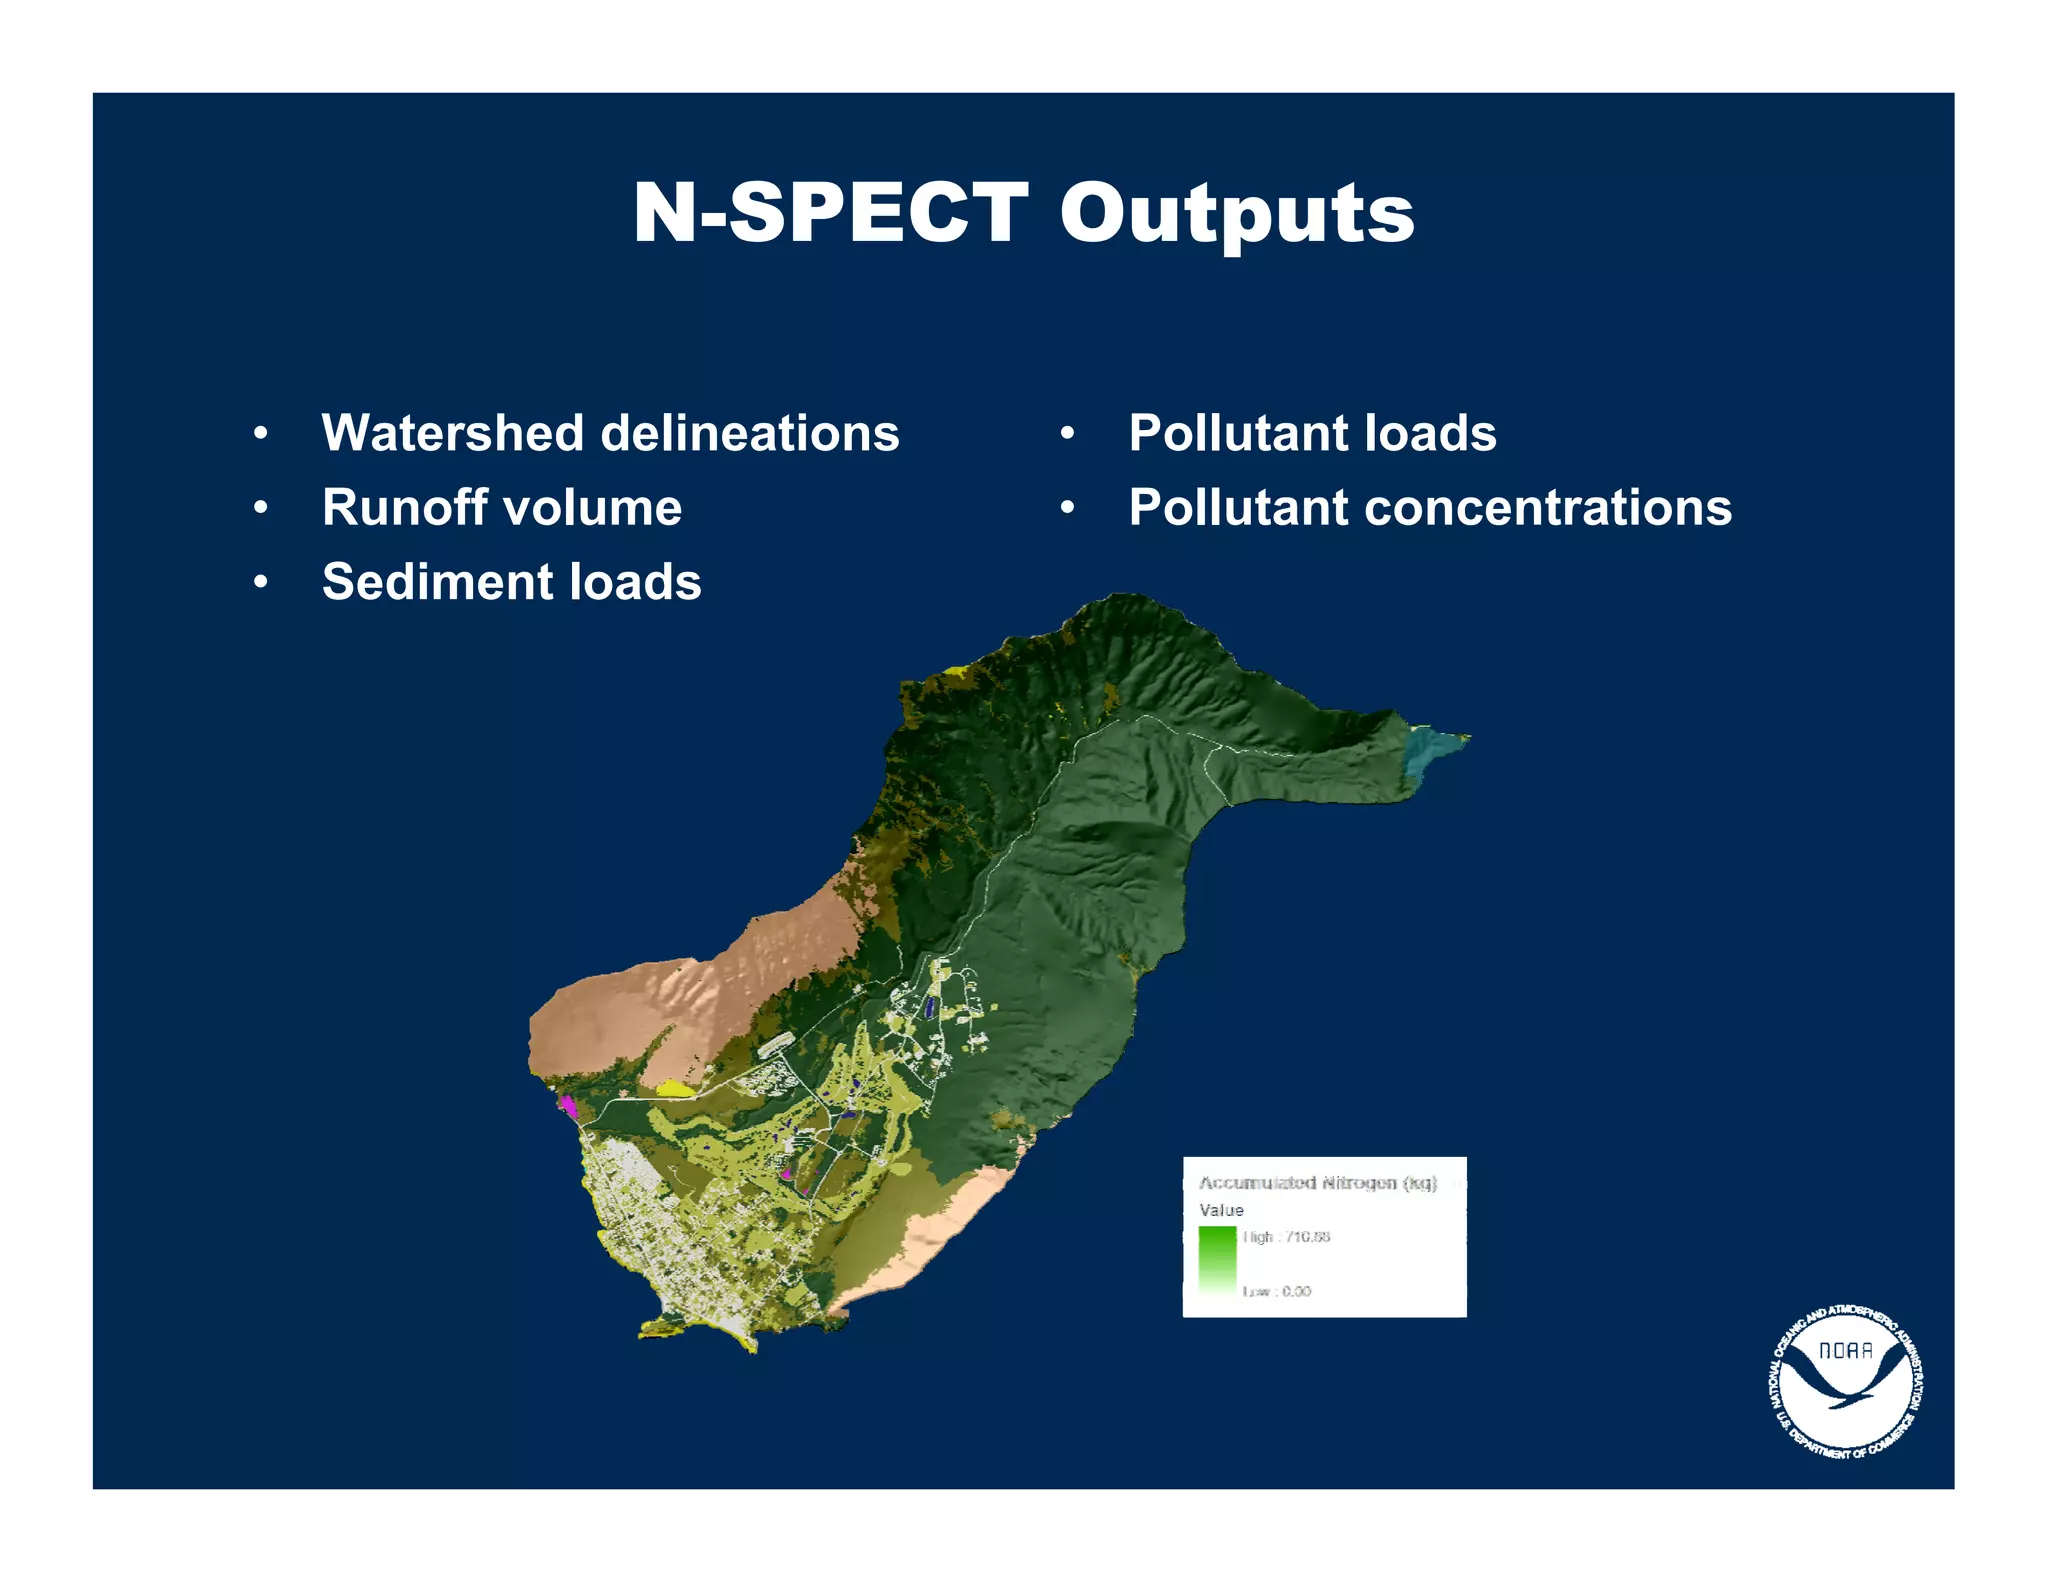
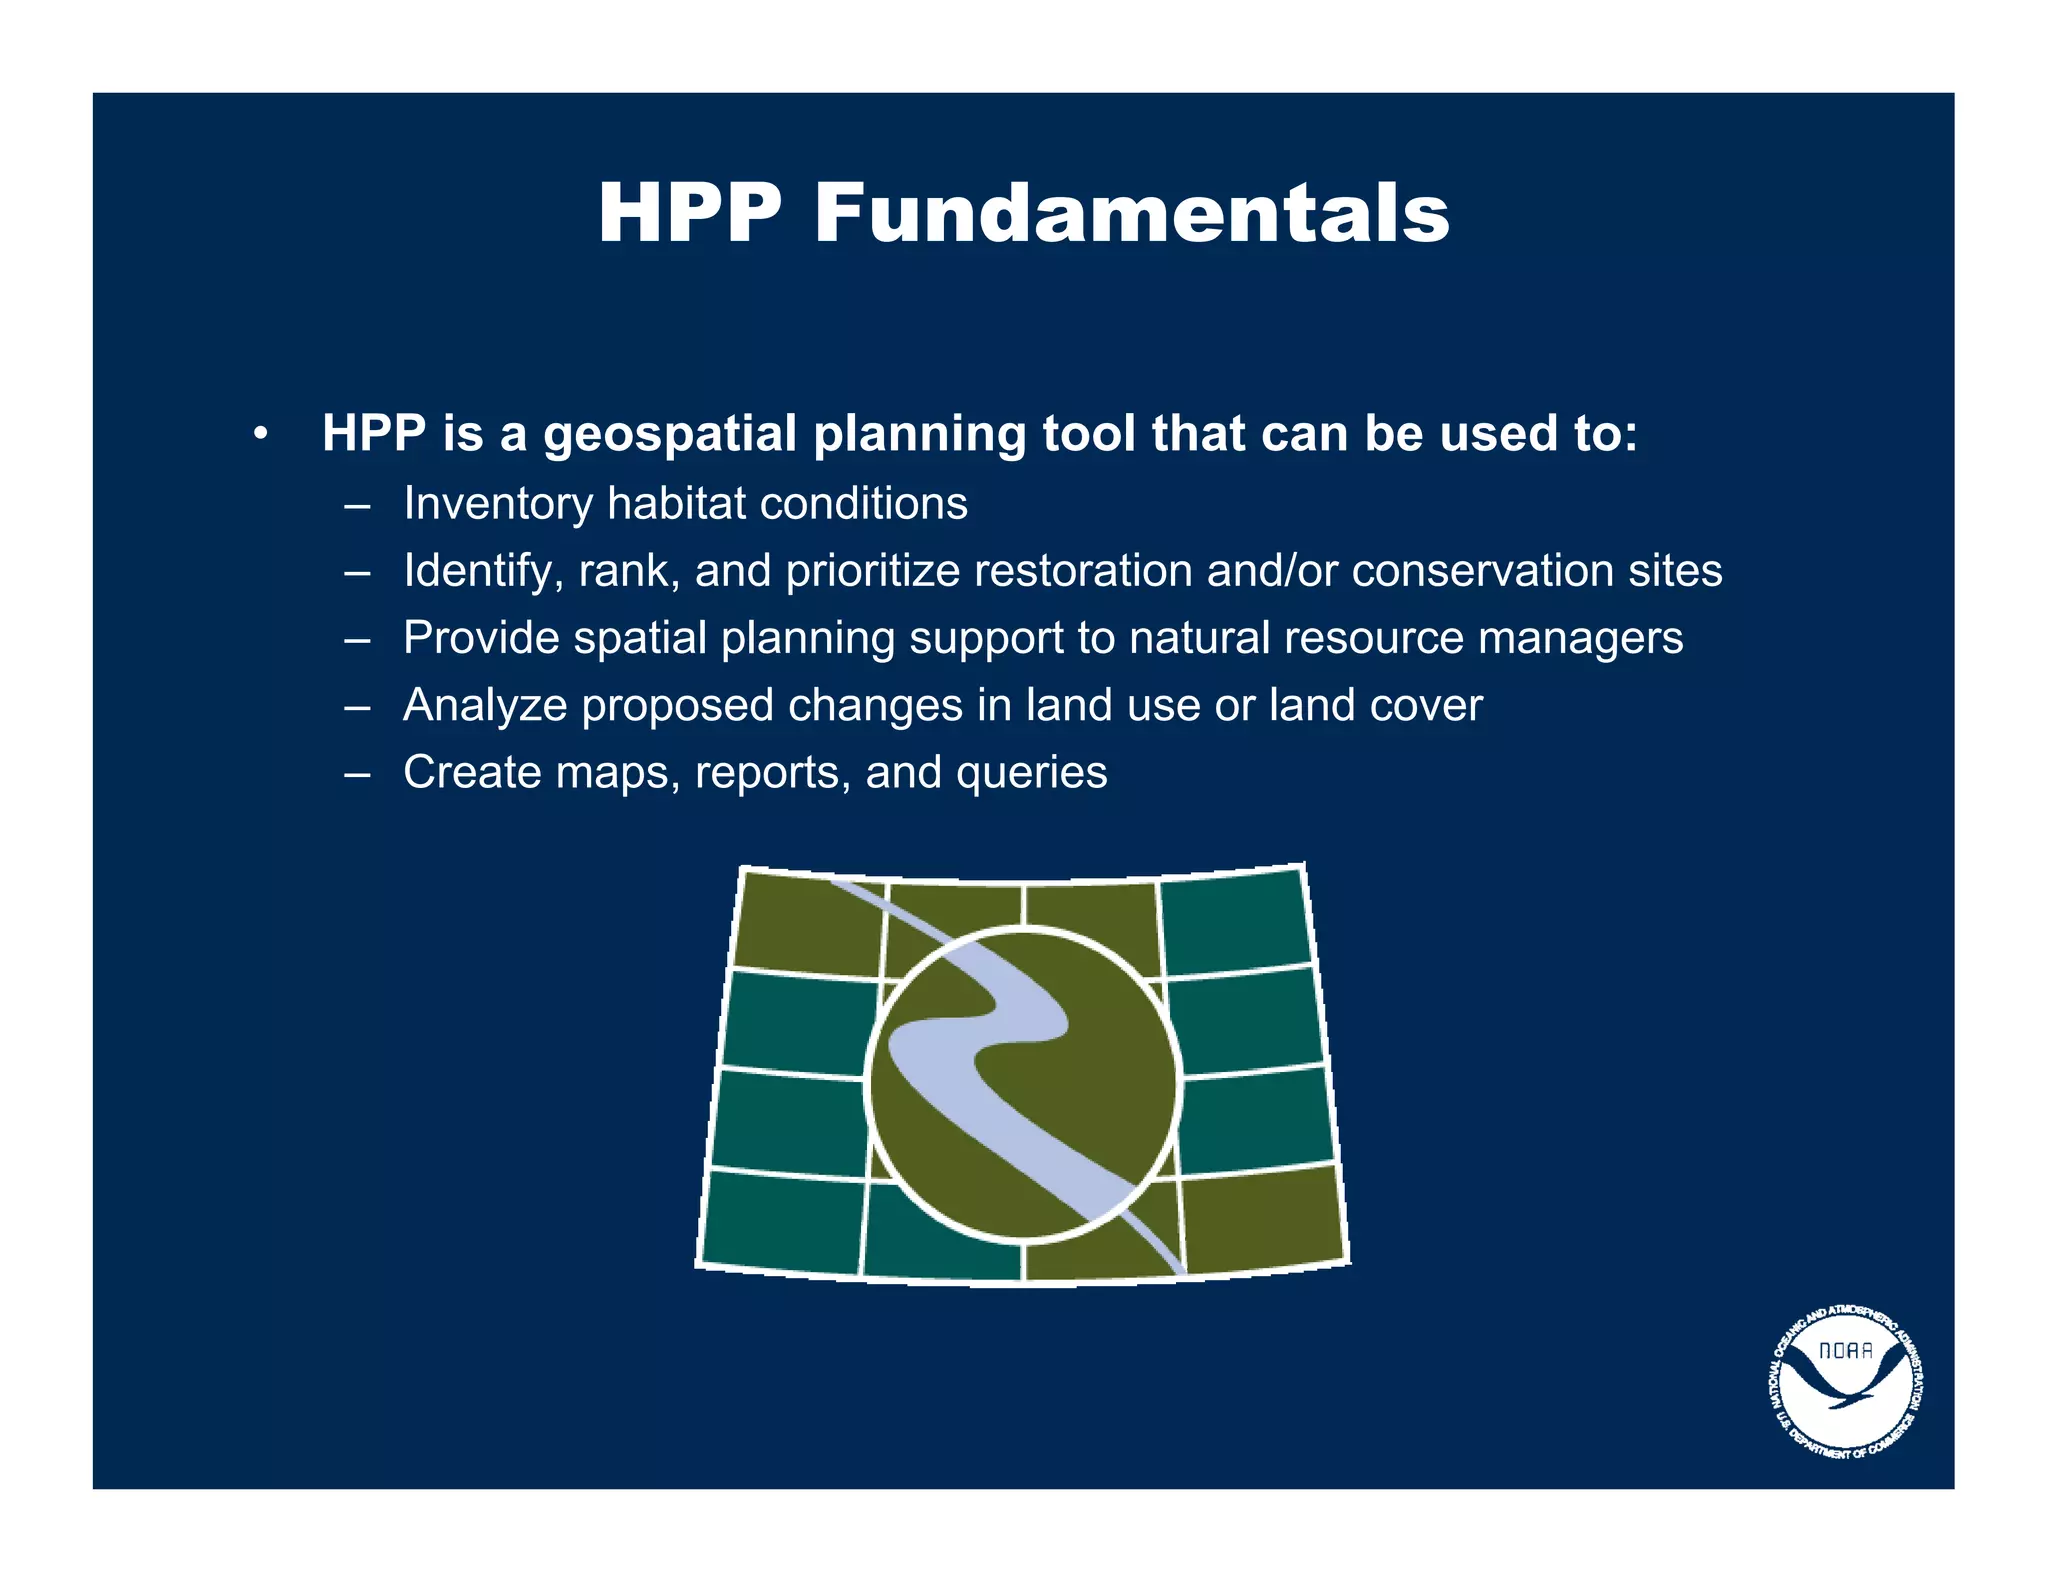
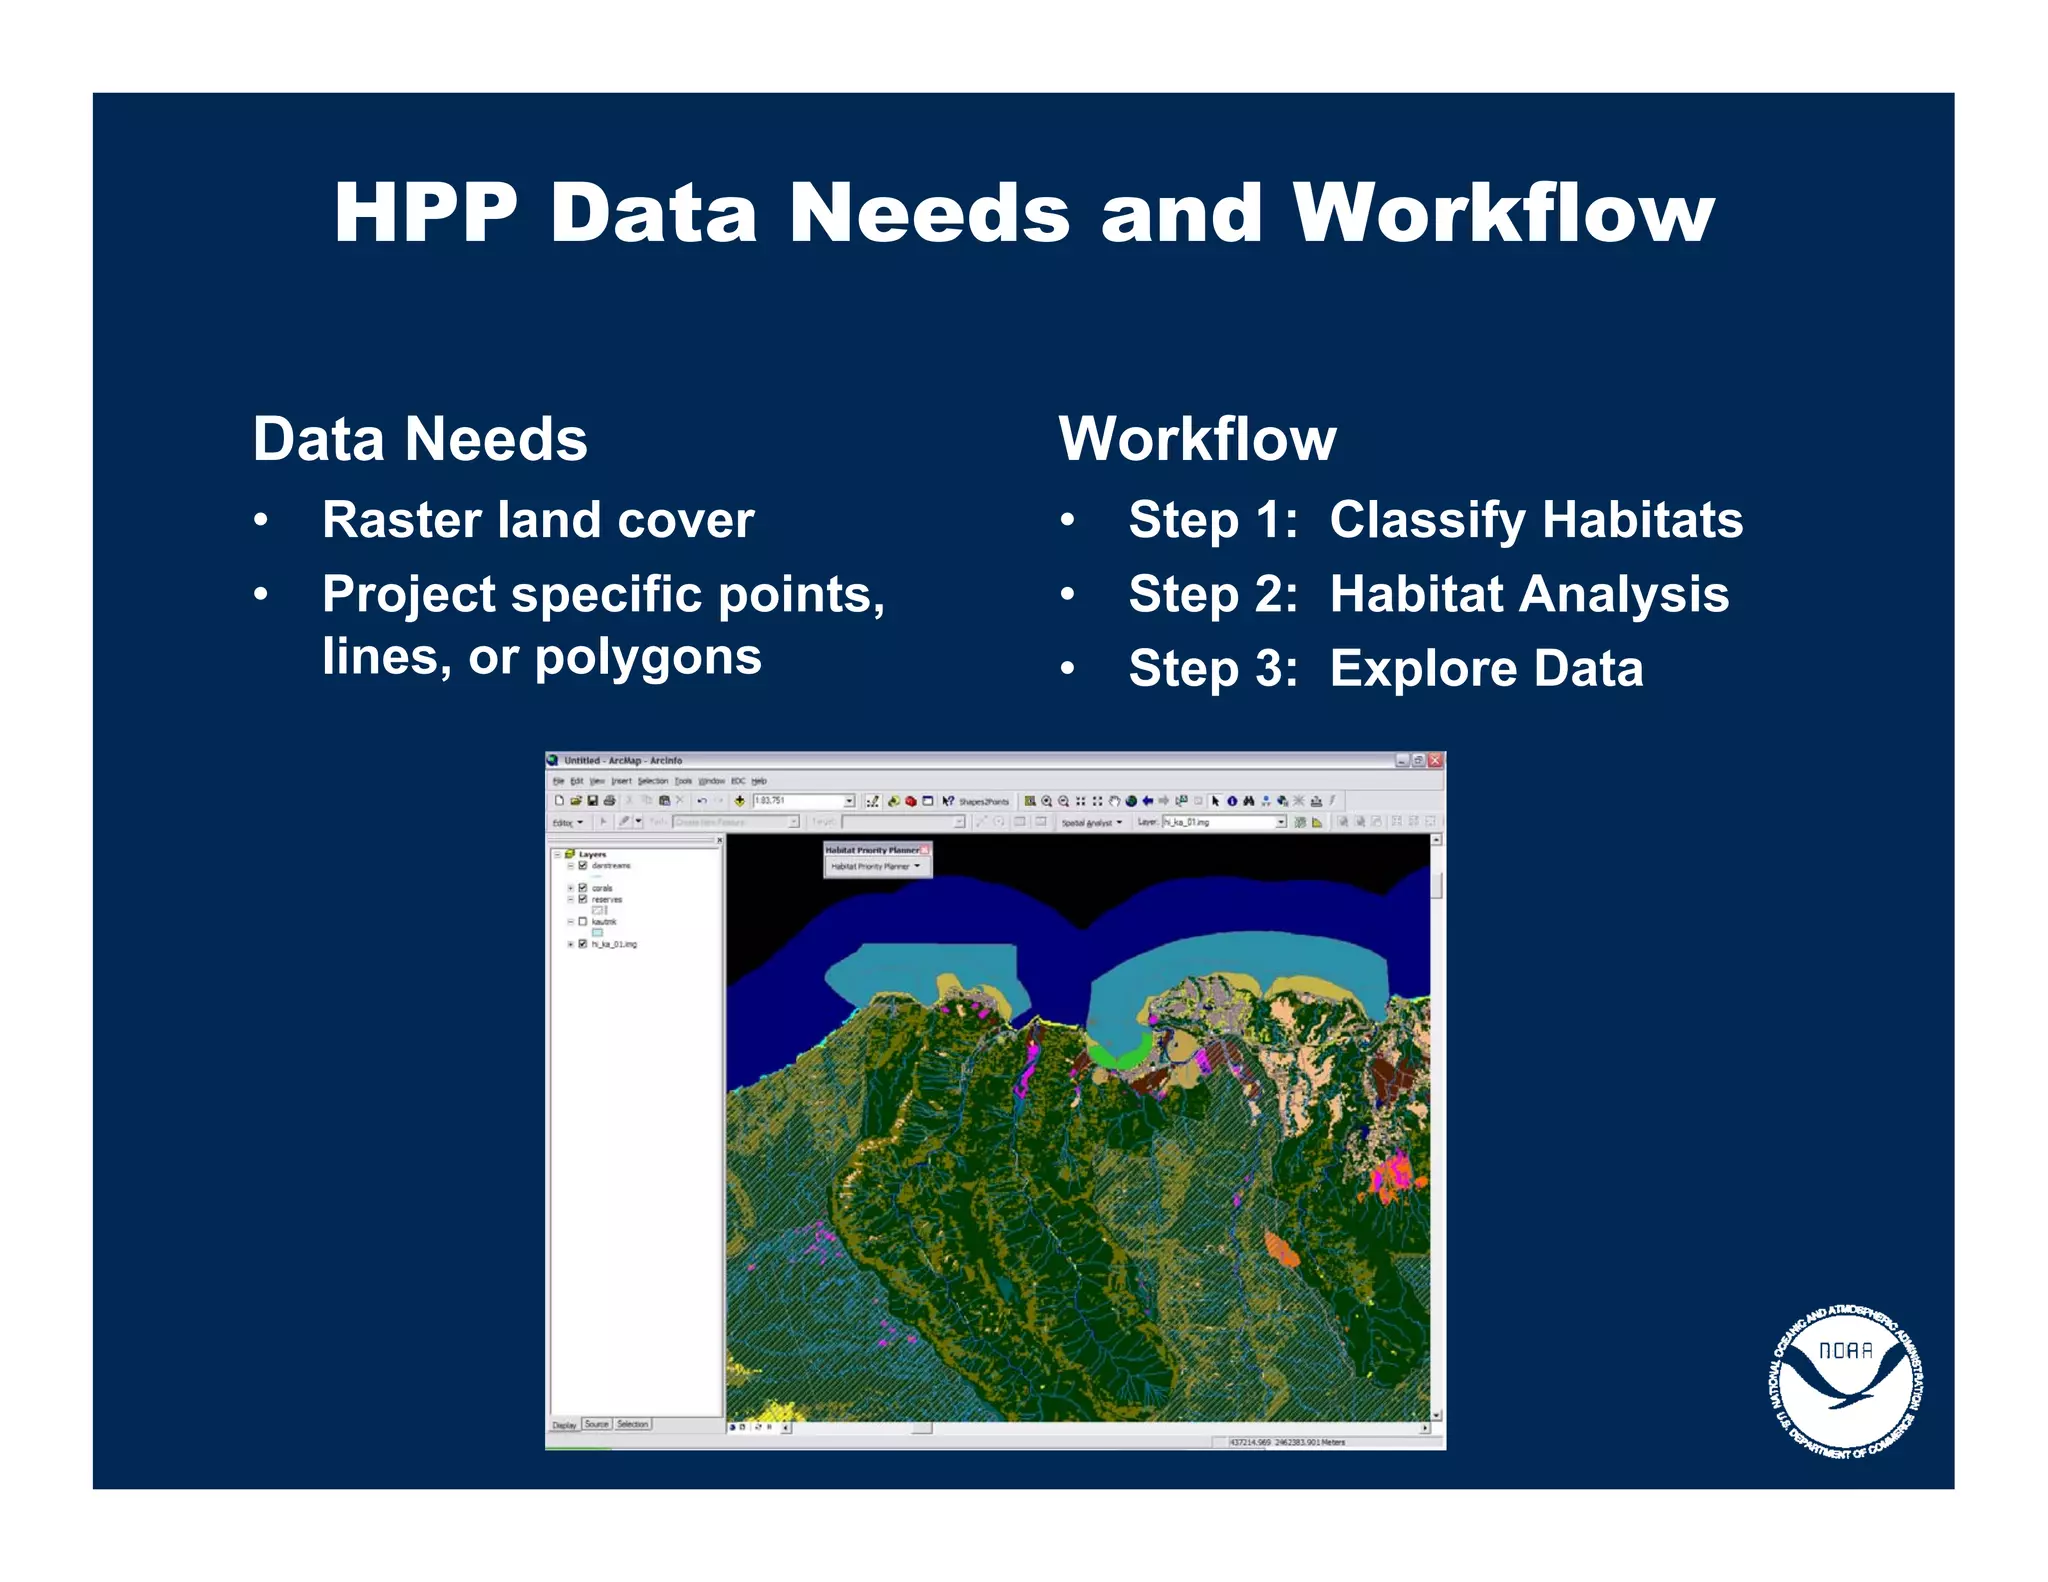
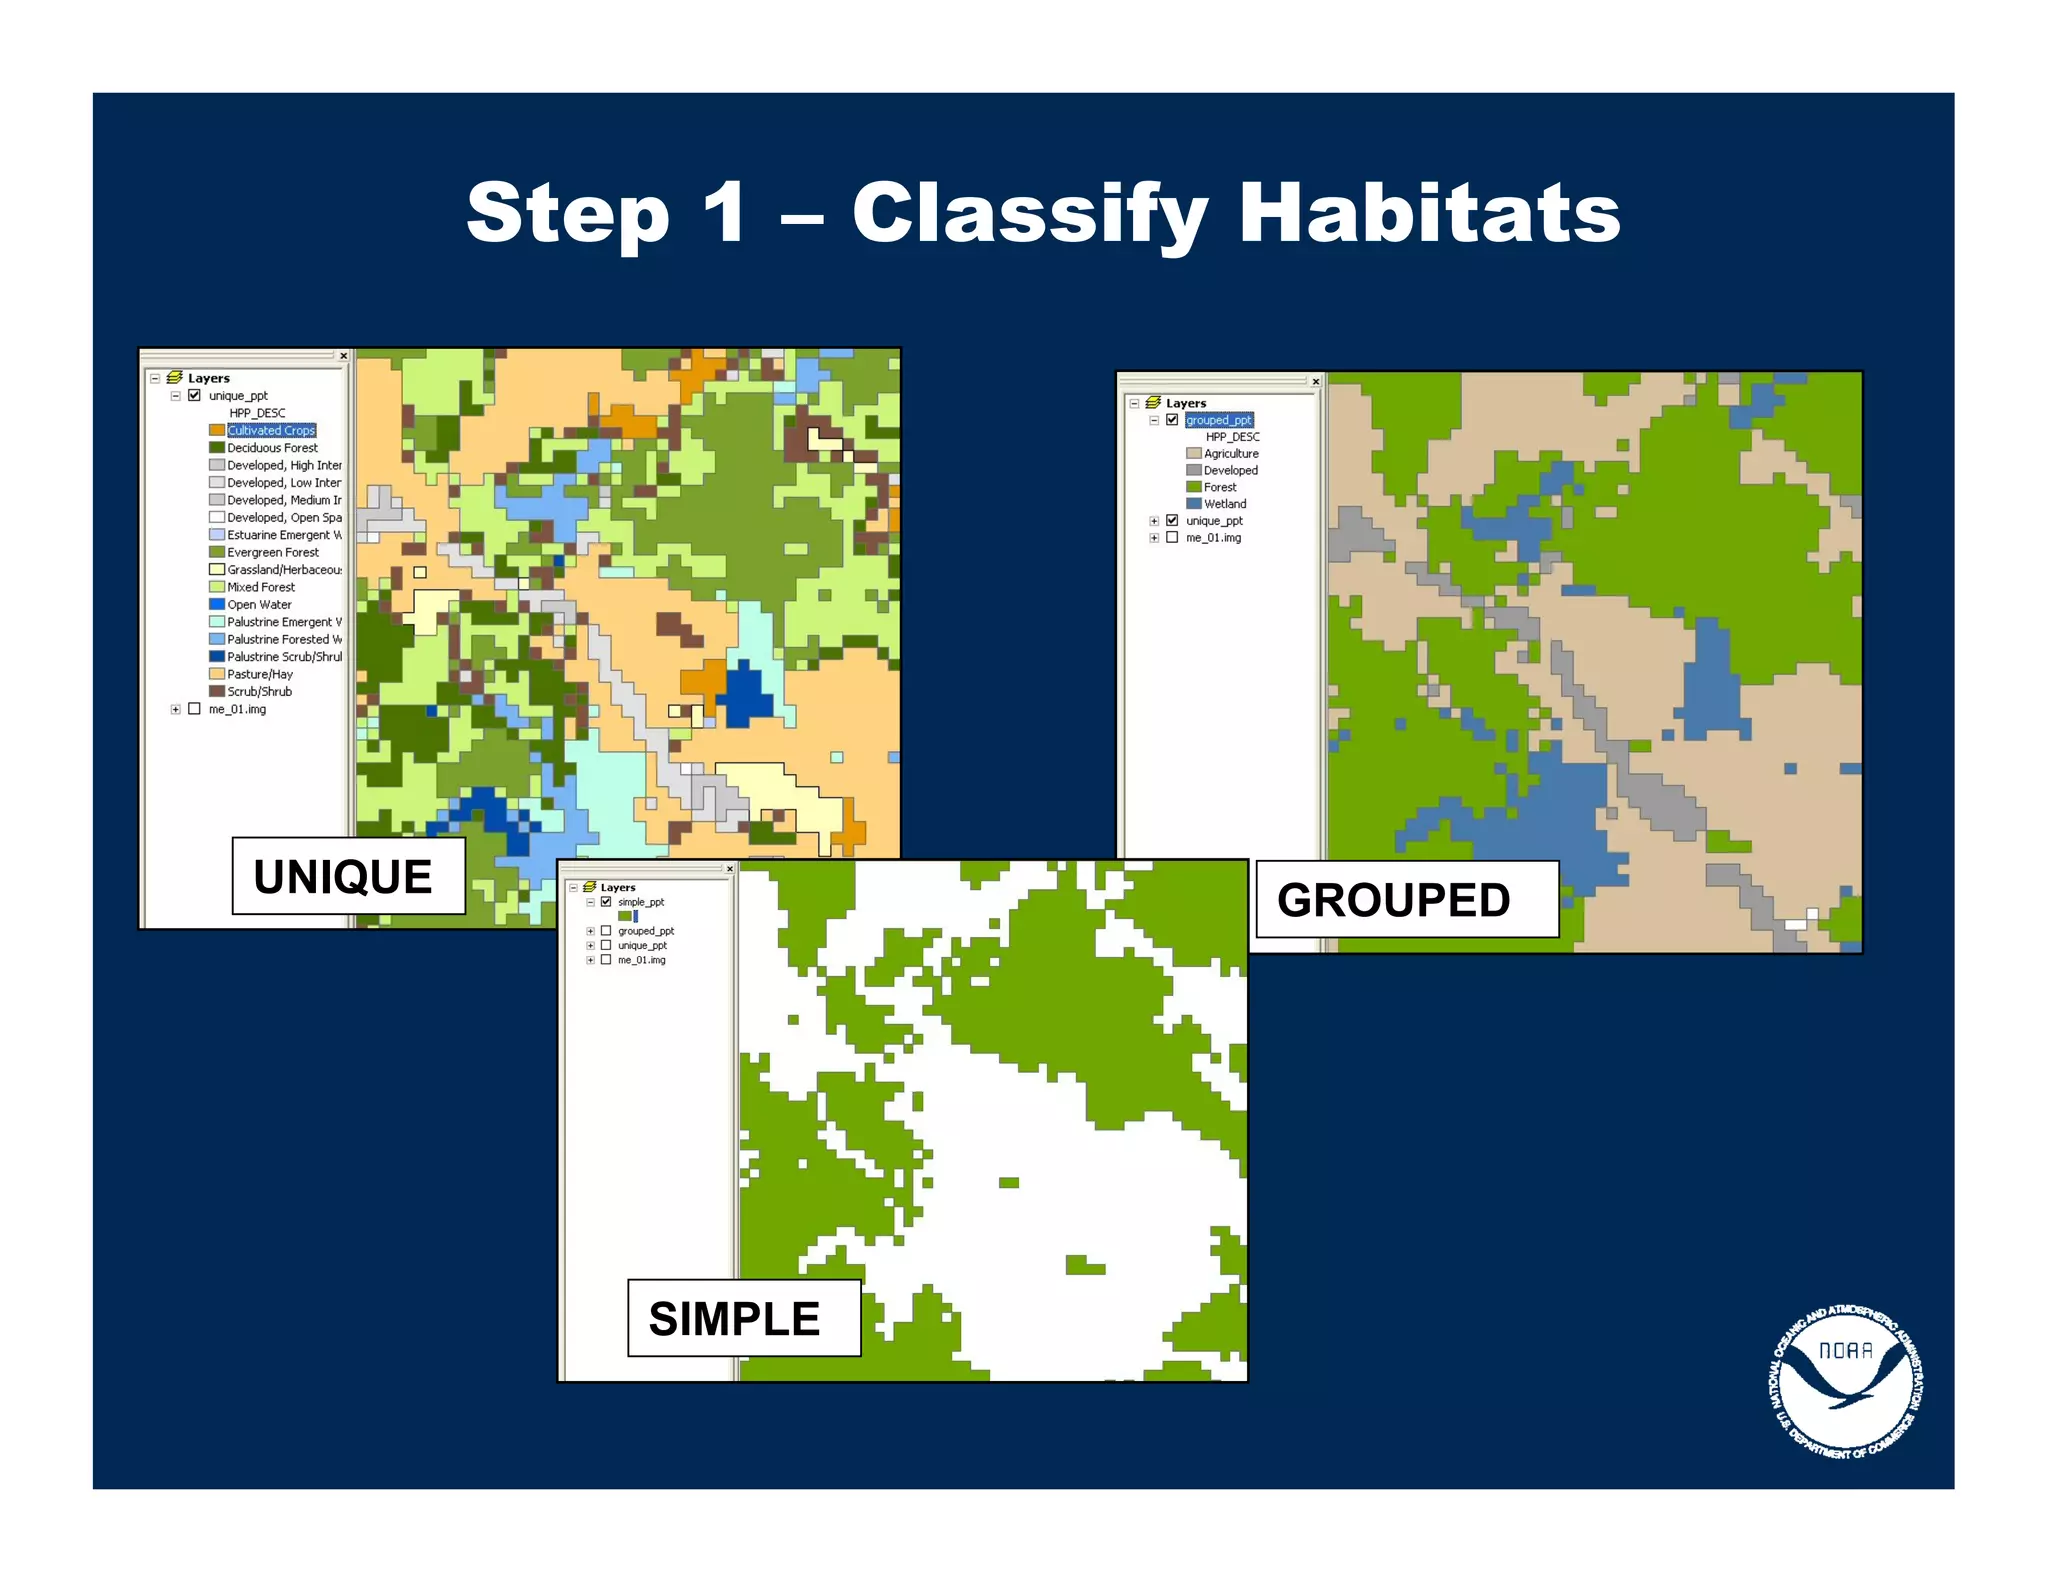
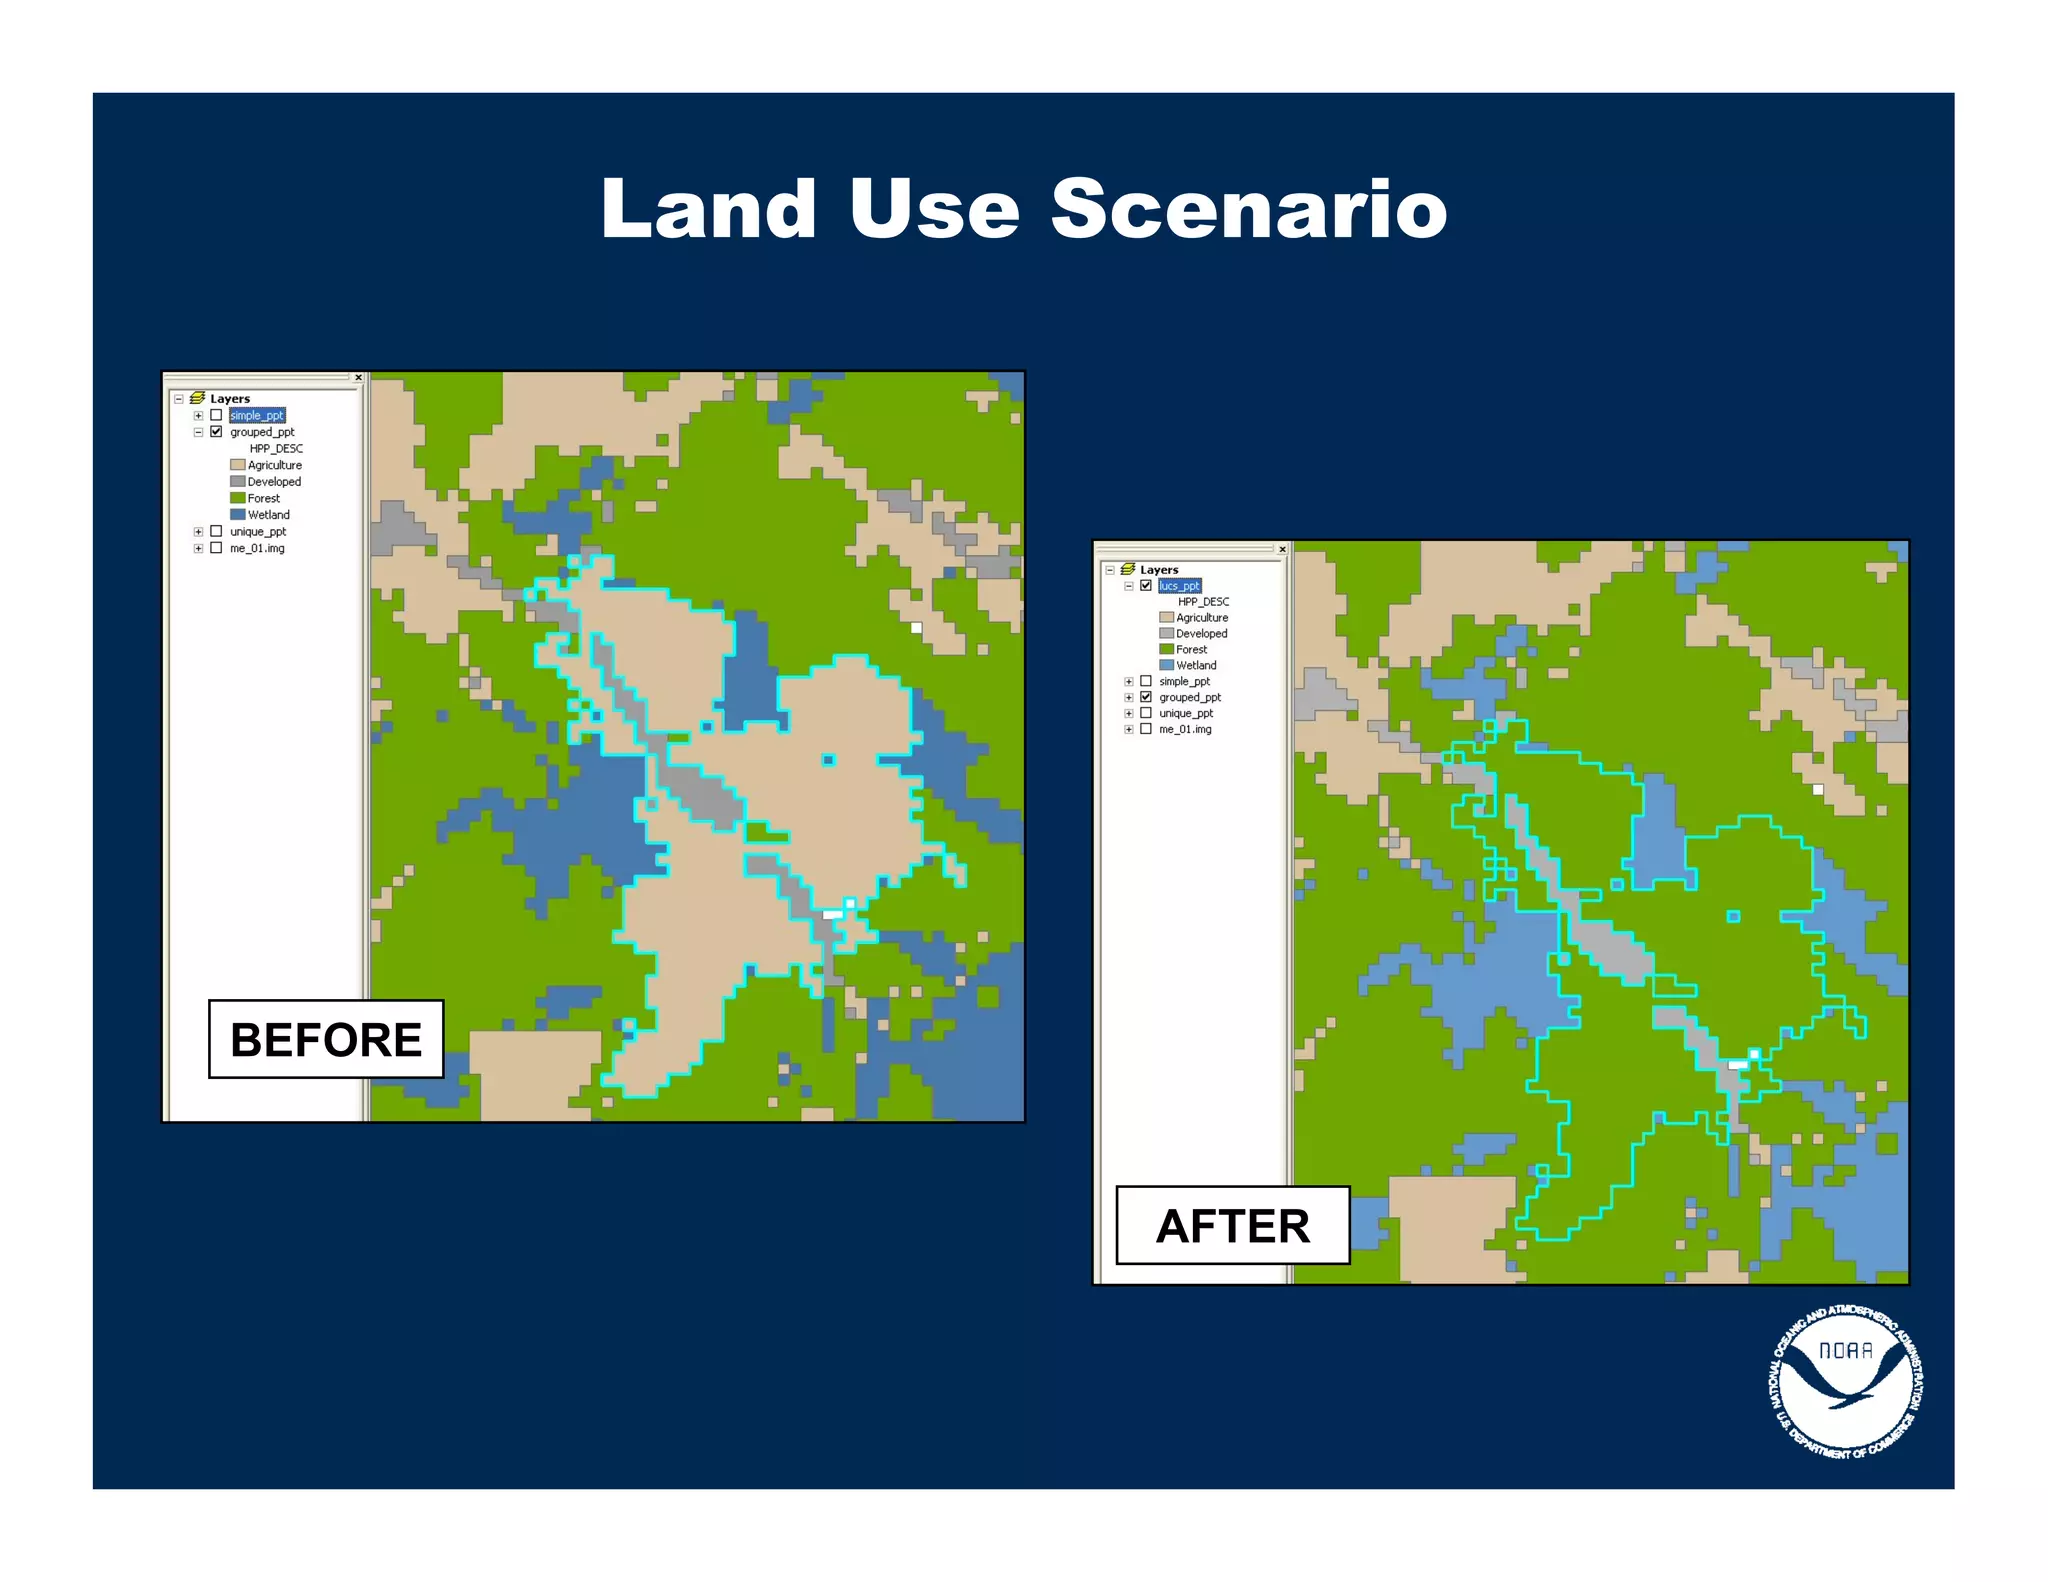
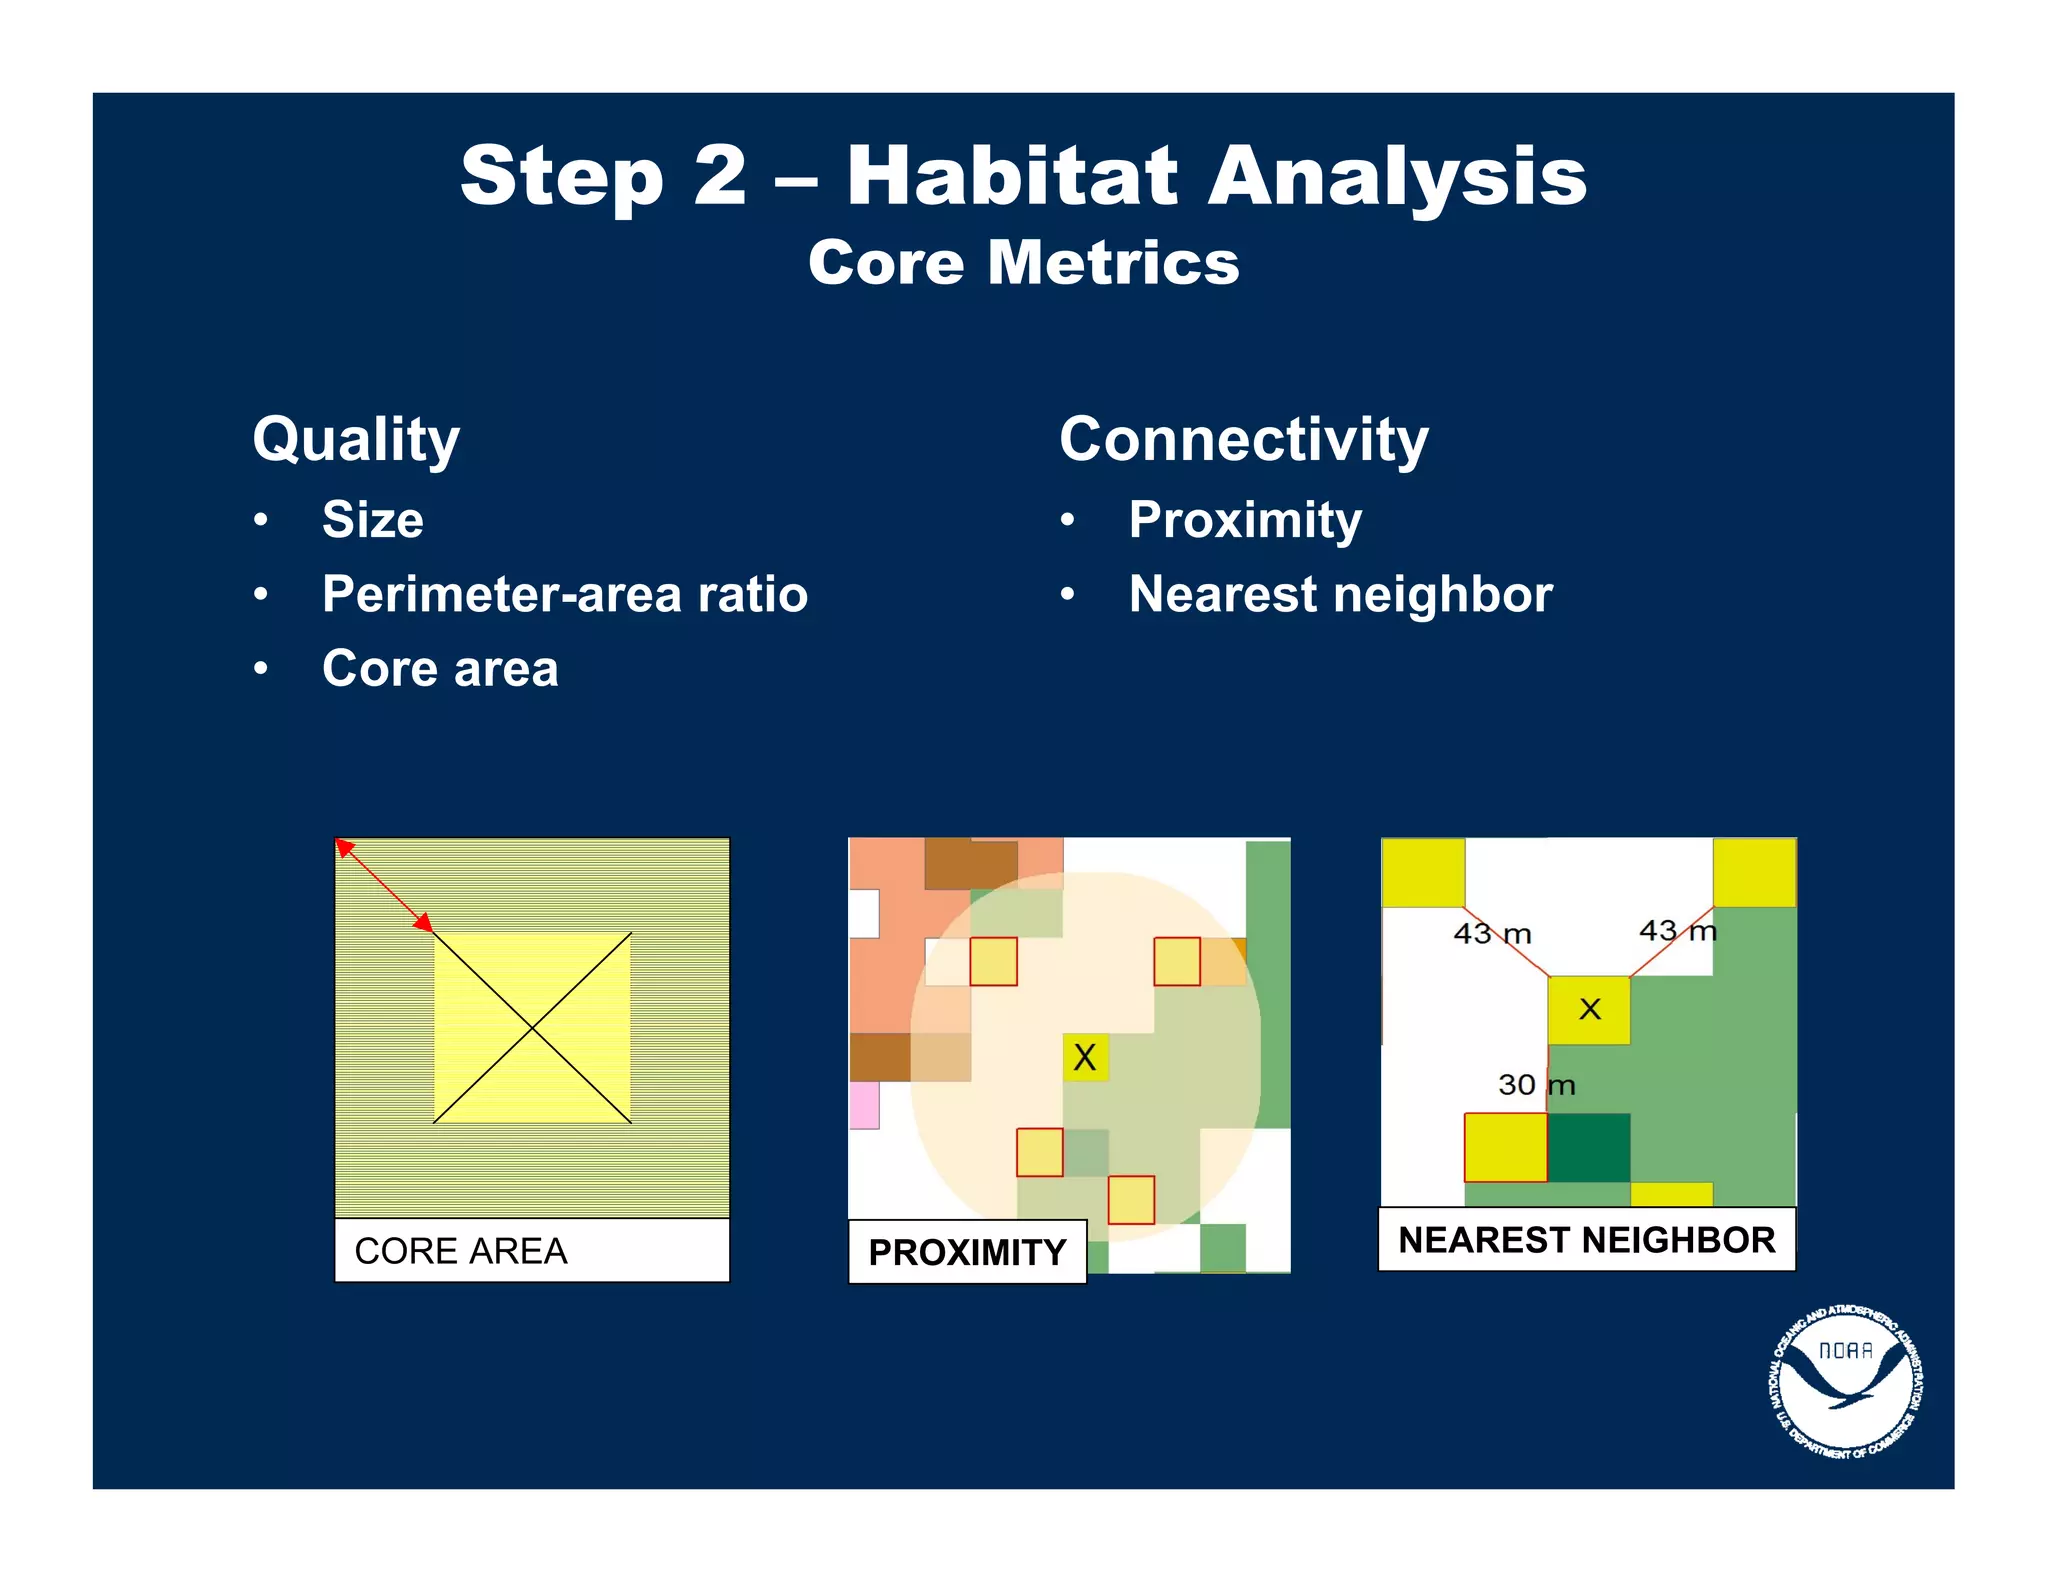
The document summarizes NOAA's National Geodetic Survey and its role in defining and maintaining the National Spatial Reference System. It discusses NGS's mission to provide geospatial data and services including latitude, longitude, height, scale, gravity, and time variations. It outlines NGS's ten-year plan to modernize reference systems using GPS and describes ongoing projects to collect lidar and gravity data, update shorelines, develop geoid models, and provide online positioning and mapping tools to support NOAA's work.
The document summarizes a conference on GIS and remote sensing applications in Pacific Island countries that was held in Fiji in 2008. Over 150 people from 13 countries attended the conference, which included nearly 50 presentations over 4 days showing how GIS and remote sensing tools are being applied in the Pacific. The conference demonstrated the commitment of Pacific Island GIS users to these technologies and their applications.
This presentation summarizes a project to inventory public shoreline access in Hawaii. It discusses proposed legislation supporting public shoreline access, methods for data collection including collaborating with state and county agencies, examples from pilot studies and case studies on Maui and the Big Island, recommendations for moving forward and maintaining the data collection long term. The goal is to create a comprehensive database and maps of public shoreline access points and facilities to help ensure public access to beaches and shorelines.
This document provides an update on the Lake Erie Biodiversity Conservation Strategy project. It discusses progress made on the viability and threat assessments, which are being conducted through expert webinars and surveys. Next steps include completing the analyses, receiving additional data, and writing preliminary results sections for the project report. It also describes the development of an information management and delivery system to provide conservation decision-makers with data, tools, and knowledge to support strategic habitat conservation in the Great Lakes region.
This document summarizes an Antarctic Biodiversity Information Facility (ANTABIF) workshop in 2012. ANTABIF aims to make Antarctic biodiversity data open, linked, useful, and interoperable. It has developed tools like the Antarctic Field Guides website for species identification, a biogeographic atlas of the Southern Ocean, and the Microbial Antarctic Resource System (MARS) for genomic data. Challenges include handling the increasing volume and complexity of data from Antarctica.
The document summarizes the 2008 annual meeting of the HIGICC in Honolulu, Hawaii. It discusses the Pacific Disaster Center's (PDC) mission to support disaster management in the Asia-Pacific region through applied research and GIS technologies. Recent projects involved developing flood maps for Vietnam and the Philippines to help communities mitigate disaster risks. PDC also collaborated with various organizations like ASEAN to build disaster resilience through information sharing platforms and training programs.
This document analyzes bottomfish habitat and proposes restricted fishing areas in the Main Hawaiian Islands to protect essential fish habitat. It defines essential fish habitat and reviews current depth ranges. It then examines assumptions for creating new reserves, including connectivity between islands and banks, priority species, preferred habitat types, reserve size and location for enforceability. Maps show proposed restricted fishing areas within federal waters essential fish habitat compared to total areas. Data on commercial catch and ocean currents are also presented. Needs are identified around deeper essential fish habitat mapping, enforcement resources, and penalties.
This document summarizes a participatory mapping project in Hawaii that engaged local stakeholders to map human uses of coastal areas. The project goals were to understand spatial patterns of human activities to inform coral reef management and priority site designations. Researchers worked with local fishermen, cultural practitioners, and other experts to map where and when various extractive and non-extractive uses occurred. The spatial data collected was synthesized into maps and tools to help managers understand human-environment interactions and potential conflicts. The project facilitated stakeholder engagement and empowered local communities while generating previously unavailable spatial data on coastal resource use.
This document summarizes participatory GIS (P-GIS) and its use in mapping coastal resource use. P-GIS involves communities in creating maps of resources, hazards, and land use to inform decision-making. It was used in Hawaii to map coastal activities like fishing and diving to understand overlaps and impacts. Workshops identified areas of general and dominant use, which were compiled into maps, a report, and online viewer to guide conservation planning.
The document provides guidelines for the knowledge and skills needed by hydrographic survey technicians. It describes their job functions like conducting surveys, managing data, and maintaining equipment. Technicians need expertise in fields like oceanography, physics, navigation, and acoustic systems. Their work involves using various tools and technologies under demanding conditions. The document outlines the educational background, personal qualities, and technical skills required to perform the essential tasks for this role.
This document summarizes data and data products available from various NOAA agencies in the Pacific region, including the National Ocean Service, National Marine Fisheries Service, and National Environmental Satellite, Data and Information Service. It provides an overview of datasets such as satellite imagery, elevation data, land cover maps, marine boundaries, and climatology products. Contact information is given for each agency to learn more about specific datasets and how to access them.
The Coastal Change Analysis Program (C-CAP) produces national coastal land cover maps every 5 years using consistent data and methods. C-CAP maps land cover for coastal areas, including wetlands and adjacent uplands. High resolution 2005 land cover and impervious surface maps have been completed for many Hawaiian islands using Quickbird satellite imagery. Moderate resolution 2001 land cover maps also exist and will be re-released as part of a national effort. The maps and analysis tools help understand coastal environment changes.
This project aims to develop cyberinfrastructure to preserve the legacy of research in Barrow, Alaska through databases and web applications. Specifically, it will:
1) Maintain and update the Barrow Area Information Database (BAID) to catalog over 9,800 research projects since 1947 and provide tools to analyze and visualize spatial data.
2) Develop new web mapping applications to improve access to field data, maps, and decision support tools for coastal erosion monitoring and sustainable land management.
3) Build local expertise through training programs and collaborative efforts between researchers and local stakeholders to ensure the tools meet community needs.
Aerial Photography Mapping Patrick Coyle, P.E. – Belize Open Source This session will demonstrate Simple Aerial Photography Mapping with Balloons or Kites. Aerial photomaps can be very useful for EWB teams for their projects and the communities they work with. Example applications include: community planning, site planning, land boundary adjudication, agricultural planning, ecological evaluations, and documenting changes such as cutting of rain forest, clearing of land, etc. Weather permitting, we’ll meet outside and discuss how to do the mapping, covering what’s needed to take the photos and use software to stitch them together into a single georegistered photomap. We’ll fly kites or balloons to take pictures and afterwards make and share the map. We’ll briefly discuss advanced topics including integration of gps data, dual-camera based multispectral imagery, 3-D Digital Elevation Models, UAVs and automated image processing. Participants are making map from photos taken during session.
This document discusses the importance of technical soil services (TSS) in supporting effective conservation planning. TSS activities include providing soils information and training to support conservation planning and initiatives. Conservation planning by the NRCS focuses on identifying problems, determining objectives, and evaluating alternatives to implement conservation plans. In FY2017, TSS provided over 16,000 instances of support and over 63,000 hours to conservation planning, primarily through compliance determinations and on-site assessments. Examples from the field show how TSS assistance informed infrastructure rehabilitation in Minnesota, guided a large wetland restoration project in Massachusetts through ground-penetrating radar, and helped identify suitable habitat for an endangered butterfly species through a soils-based interpretation. The document emphasizes that soils
The document discusses the need for a shared earth model to manage big data from subsea and subsurface exploration. It notes requirements like managing large volumes of seismic, bathymetry and other data; being open, scalable, and cost-efficient; and enabling sharing and collaboration. A shared earth model is needed for exploration, development, production planning, environmental management, and delineating maritime boundaries. It proposes using ArcGIS and Geocap tools to integrate subsurface data and interpretations with GIS, allowing visualization and sharing of big data while avoiding data duplication.
Bruce Carlisle Massachusetts Ocean Management: Implementation Progress and Re...riseagrant
The document summarizes Massachusetts' progress in implementing its Ocean Management Plan. Key points include:
- The plan established siting standards and identified/mapped special marine habitats and areas of high existing ocean use to guide protection and development.
- Agencies are coordinating regulatory decisions and prioritizing science like improved mapping of habitats and recreational boating data.
- A case study showed how standards guided a cable project to avoid sensitive habitats through routing changes and construction methods.
- An Ecological Valuation Index was developed to systematically evaluate habitat importance, though it has limitations due to data availability.
Cameron Finlayson is a young geology professional with a Bachelor's degree in geology from Laurentian University and over 10 years of experience in the field. He has worked on projects in Ontario, Nunavut, and the Northwest Territories. His experience includes compiling databases, identifying mineralization, supervising stripping and mapping projects, logging drill cores, and assisting with sampling, drilling, and environmental work. He has demonstrated leadership abilities and an aptitude for self-directed work.
Mark Thomas_A digital soil mapping approach for regolith thickness in the com...TERN Australia
This document summarizes research on modeling regolith depth in the Mt Lofty Ranges of South Australia. Regolith includes all weathered material above bedrock and plays an important role in hydrology, biology, energy transfer, biogeochemistry, land use, and more. While some regolith maps exist, coverage is limited. The researchers collected over 700 depth measurements and used environmental data like topography, climate, and geology in a regression model to predict regolith depth across the 128,000 hectare study area. Their goal is to develop a consistent national regolith map to support biophysical modeling. Future work includes testing the approach in other regions and integrating results to create a comprehensive national map.
Landmap provides geospatial datasets and resources for education. It aims to increase awareness of geospatial data and provide learning materials structured into courses, units, and topics. The learning zone covers topics from basic to advanced levels and includes software, data, theory, and workflows. It has a technological framework based on Joomla and a pedagogical framework following a six-part educational model. Future plans include making some resources openly available and developing new content areas and engagement with researchers.
Navigating the Marine Geophysical Data Life CycleVicki Ferrini
I gave this presentation at the University of New Hampshire's Center for Coastal and Ocean Mapping on April 18, 2014 describing the marine geophysical data life cycle and a variety of resources available to help investigators navigate the world of data management, as well as efforts focused on optimizing high-quality publicly available data.
The Marine Geoscience Data System provides online resources for exploring ocean mapping data including the Global Multi-Resolution Topography Synthesis (GMRT), GeoMapApp, and the Marine-Geo Digital Library. The GMRT is an open-access global digital elevation model of ocean bathymetry and lands at varying resolutions. It is compiled from over 800 cruises and updated biannually. Data is accessible through web map services, desktop and web applications. The Marine-Geo Digital Library archives over 600,000 data files and links them to publications. These resources support both specialists and non-specialists in visualizing and accessing ocean mapping data.
This document summarizes a project to support community monitoring of forests in indigenous territories in Panama. The project's goals were to develop the capacity of indigenous technicians in remote sensing, GIS and forest inventories, standardize data collection, and generate geo-referenced forest information. Activities included training technicians, collecting forest data, and drafting a traditional knowledge protocol. Drones were used to monitor inaccessible areas and support legal proceedings. Lessons learned include the importance of participation, sustainability, and credibility of community-generated data, as well as the roles of COONAPIP and indigenous technicians in enabling project success.
This document summarizes Steven Eglinton's work using GIS and mapping technologies to support conservation efforts at the Iracambi Atlantic Rainforest Research and Conservation Centre in Brazil. The center uses GIS to map land use, monitor threats from mining activities, and engage local communities. Maps have helped the center legally challenge mining proposals, illustrate proximity to protected areas, and develop a web map for information sharing. Future plans include expanding the web map, focusing on metadata and information management, and providing web services.
Geological field activities at the HI-SEAS planetary surface analog mission s...Brian Shiro
Presented on July 23, 2014 at the NASA Exploration Science Forum in Moffett Field, California. Summarizes the geological field tasks assigned to HI-SEAS crews during simulated long-duration Mars missions on Mauna Loa, Hawaii.
Demonstrate and discuss Simple Aerial Photography Mapping with Balloons or Kites. Aerial photomaps can be very useful for EWB teams for their projects and the communities they work with. Example applications include: Community Planning, Site Planning, Land boundary adjudication, Agricultural planning, Ecological evaluations such as counting species, map mapping vegetation and habitat, etc. Document changes such as cutting of rain forest clearing of land, etc.
We'll cover how to do the mapping, covering what's needed to take the images and use software to stitch them together into a single photomap and georegister the photomap to tie it into Google Earth imagery. Weather permitting, we'll go outside and fly kites or balloons to take pictures and afterwards make and share the map.
This document discusses streaming 3D maps as a high return, low risk investment for cities. Streaming 3D maps are 100% web-based solutions that enable maximum communication and awareness. They have benefits such as being browser-based so no additional software is needed, turnkey assembly of content is available, and superior 3D technologies can be used in an open architecture with minimal costs, training needs, and risks.
The document discusses the U.S. Army Military Land Tract Project to convert paper records of Army real estate holdings into a digital database and GIS system. It provides an overview of the project objectives and tasks. As a case study, it summarizes the history of land holdings at Fort Shafter in Hawaii from 1899 to present day, showing how the single tract has been subdivided over time into 50 active tracts today. Maps of Army sites on Oahu and Hawaii islands are also presented.
More Related Content
Similar to Data, Tools, Training, and Technical Assistance
This document summarizes a participatory mapping project in Hawaii that engaged local stakeholders to map human uses of coastal areas. The project goals were to understand spatial patterns of human activities to inform coral reef management and priority site designations. Researchers worked with local fishermen, cultural practitioners, and other experts to map where and when various extractive and non-extractive uses occurred. The spatial data collected was synthesized into maps and tools to help managers understand human-environment interactions and potential conflicts. The project facilitated stakeholder engagement and empowered local communities while generating previously unavailable spatial data on coastal resource use.
This document summarizes participatory GIS (P-GIS) and its use in mapping coastal resource use. P-GIS involves communities in creating maps of resources, hazards, and land use to inform decision-making. It was used in Hawaii to map coastal activities like fishing and diving to understand overlaps and impacts. Workshops identified areas of general and dominant use, which were compiled into maps, a report, and online viewer to guide conservation planning.
The document provides guidelines for the knowledge and skills needed by hydrographic survey technicians. It describes their job functions like conducting surveys, managing data, and maintaining equipment. Technicians need expertise in fields like oceanography, physics, navigation, and acoustic systems. Their work involves using various tools and technologies under demanding conditions. The document outlines the educational background, personal qualities, and technical skills required to perform the essential tasks for this role.
This document summarizes data and data products available from various NOAA agencies in the Pacific region, including the National Ocean Service, National Marine Fisheries Service, and National Environmental Satellite, Data and Information Service. It provides an overview of datasets such as satellite imagery, elevation data, land cover maps, marine boundaries, and climatology products. Contact information is given for each agency to learn more about specific datasets and how to access them.
The Coastal Change Analysis Program (C-CAP) produces national coastal land cover maps every 5 years using consistent data and methods. C-CAP maps land cover for coastal areas, including wetlands and adjacent uplands. High resolution 2005 land cover and impervious surface maps have been completed for many Hawaiian islands using Quickbird satellite imagery. Moderate resolution 2001 land cover maps also exist and will be re-released as part of a national effort. The maps and analysis tools help understand coastal environment changes.
This project aims to develop cyberinfrastructure to preserve the legacy of research in Barrow, Alaska through databases and web applications. Specifically, it will:
1) Maintain and update the Barrow Area Information Database (BAID) to catalog over 9,800 research projects since 1947 and provide tools to analyze and visualize spatial data.
2) Develop new web mapping applications to improve access to field data, maps, and decision support tools for coastal erosion monitoring and sustainable land management.
3) Build local expertise through training programs and collaborative efforts between researchers and local stakeholders to ensure the tools meet community needs.
Aerial Photography Mapping Patrick Coyle, P.E. – Belize Open Source This session will demonstrate Simple Aerial Photography Mapping with Balloons or Kites. Aerial photomaps can be very useful for EWB teams for their projects and the communities they work with. Example applications include: community planning, site planning, land boundary adjudication, agricultural planning, ecological evaluations, and documenting changes such as cutting of rain forest, clearing of land, etc. Weather permitting, we’ll meet outside and discuss how to do the mapping, covering what’s needed to take the photos and use software to stitch them together into a single georegistered photomap. We’ll fly kites or balloons to take pictures and afterwards make and share the map. We’ll briefly discuss advanced topics including integration of gps data, dual-camera based multispectral imagery, 3-D Digital Elevation Models, UAVs and automated image processing. Participants are making map from photos taken during session.
This document discusses the importance of technical soil services (TSS) in supporting effective conservation planning. TSS activities include providing soils information and training to support conservation planning and initiatives. Conservation planning by the NRCS focuses on identifying problems, determining objectives, and evaluating alternatives to implement conservation plans. In FY2017, TSS provided over 16,000 instances of support and over 63,000 hours to conservation planning, primarily through compliance determinations and on-site assessments. Examples from the field show how TSS assistance informed infrastructure rehabilitation in Minnesota, guided a large wetland restoration project in Massachusetts through ground-penetrating radar, and helped identify suitable habitat for an endangered butterfly species through a soils-based interpretation. The document emphasizes that soils
The document discusses the need for a shared earth model to manage big data from subsea and subsurface exploration. It notes requirements like managing large volumes of seismic, bathymetry and other data; being open, scalable, and cost-efficient; and enabling sharing and collaboration. A shared earth model is needed for exploration, development, production planning, environmental management, and delineating maritime boundaries. It proposes using ArcGIS and Geocap tools to integrate subsurface data and interpretations with GIS, allowing visualization and sharing of big data while avoiding data duplication.
Bruce Carlisle Massachusetts Ocean Management: Implementation Progress and Re...riseagrant
The document summarizes Massachusetts' progress in implementing its Ocean Management Plan. Key points include:
- The plan established siting standards and identified/mapped special marine habitats and areas of high existing ocean use to guide protection and development.
- Agencies are coordinating regulatory decisions and prioritizing science like improved mapping of habitats and recreational boating data.
- A case study showed how standards guided a cable project to avoid sensitive habitats through routing changes and construction methods.
- An Ecological Valuation Index was developed to systematically evaluate habitat importance, though it has limitations due to data availability.
Cameron Finlayson is a young geology professional with a Bachelor's degree in geology from Laurentian University and over 10 years of experience in the field. He has worked on projects in Ontario, Nunavut, and the Northwest Territories. His experience includes compiling databases, identifying mineralization, supervising stripping and mapping projects, logging drill cores, and assisting with sampling, drilling, and environmental work. He has demonstrated leadership abilities and an aptitude for self-directed work.
Mark Thomas_A digital soil mapping approach for regolith thickness in the com...TERN Australia
This document summarizes research on modeling regolith depth in the Mt Lofty Ranges of South Australia. Regolith includes all weathered material above bedrock and plays an important role in hydrology, biology, energy transfer, biogeochemistry, land use, and more. While some regolith maps exist, coverage is limited. The researchers collected over 700 depth measurements and used environmental data like topography, climate, and geology in a regression model to predict regolith depth across the 128,000 hectare study area. Their goal is to develop a consistent national regolith map to support biophysical modeling. Future work includes testing the approach in other regions and integrating results to create a comprehensive national map.
Landmap provides geospatial datasets and resources for education. It aims to increase awareness of geospatial data and provide learning materials structured into courses, units, and topics. The learning zone covers topics from basic to advanced levels and includes software, data, theory, and workflows. It has a technological framework based on Joomla and a pedagogical framework following a six-part educational model. Future plans include making some resources openly available and developing new content areas and engagement with researchers.
Navigating the Marine Geophysical Data Life CycleVicki Ferrini
I gave this presentation at the University of New Hampshire's Center for Coastal and Ocean Mapping on April 18, 2014 describing the marine geophysical data life cycle and a variety of resources available to help investigators navigate the world of data management, as well as efforts focused on optimizing high-quality publicly available data.
The Marine Geoscience Data System provides online resources for exploring ocean mapping data including the Global Multi-Resolution Topography Synthesis (GMRT), GeoMapApp, and the Marine-Geo Digital Library. The GMRT is an open-access global digital elevation model of ocean bathymetry and lands at varying resolutions. It is compiled from over 800 cruises and updated biannually. Data is accessible through web map services, desktop and web applications. The Marine-Geo Digital Library archives over 600,000 data files and links them to publications. These resources support both specialists and non-specialists in visualizing and accessing ocean mapping data.
This document summarizes a project to support community monitoring of forests in indigenous territories in Panama. The project's goals were to develop the capacity of indigenous technicians in remote sensing, GIS and forest inventories, standardize data collection, and generate geo-referenced forest information. Activities included training technicians, collecting forest data, and drafting a traditional knowledge protocol. Drones were used to monitor inaccessible areas and support legal proceedings. Lessons learned include the importance of participation, sustainability, and credibility of community-generated data, as well as the roles of COONAPIP and indigenous technicians in enabling project success.
This document summarizes Steven Eglinton's work using GIS and mapping technologies to support conservation efforts at the Iracambi Atlantic Rainforest Research and Conservation Centre in Brazil. The center uses GIS to map land use, monitor threats from mining activities, and engage local communities. Maps have helped the center legally challenge mining proposals, illustrate proximity to protected areas, and develop a web map for information sharing. Future plans include expanding the web map, focusing on metadata and information management, and providing web services.
Geological field activities at the HI-SEAS planetary surface analog mission s...Brian Shiro
Presented on July 23, 2014 at the NASA Exploration Science Forum in Moffett Field, California. Summarizes the geological field tasks assigned to HI-SEAS crews during simulated long-duration Mars missions on Mauna Loa, Hawaii.
Demonstrate and discuss Simple Aerial Photography Mapping with Balloons or Kites. Aerial photomaps can be very useful for EWB teams for their projects and the communities they work with. Example applications include: Community Planning, Site Planning, Land boundary adjudication, Agricultural planning, Ecological evaluations such as counting species, map mapping vegetation and habitat, etc. Document changes such as cutting of rain forest clearing of land, etc.
We'll cover how to do the mapping, covering what's needed to take the images and use software to stitch them together into a single photomap and georegister the photomap to tie it into Google Earth imagery. Weather permitting, we'll go outside and fly kites or balloons to take pictures and afterwards make and share the map.
Similar to Data, Tools, Training, and Technical Assistance (20)
This document discusses streaming 3D maps as a high return, low risk investment for cities. Streaming 3D maps are 100% web-based solutions that enable maximum communication and awareness. They have benefits such as being browser-based so no additional software is needed, turnkey assembly of content is available, and superior 3D technologies can be used in an open architecture with minimal costs, training needs, and risks.
The document discusses the U.S. Army Military Land Tract Project to convert paper records of Army real estate holdings into a digital database and GIS system. It provides an overview of the project objectives and tasks. As a case study, it summarizes the history of land holdings at Fort Shafter in Hawaii from 1899 to present day, showing how the single tract has been subdivided over time into 50 active tracts today. Maps of Army sites on Oahu and Hawaii islands are also presented.
NOAA's Coastal Change Analysis Program provides nationally standardized data on land cover and land use collected every five years. It includes high resolution data for several Pacific islands at 2.4m resolution. This level of detail is useful for small-scale analysis, extracting specific land cover components, and site-specific studies. The high resolution data has been used for applications like vulnerability assessments, studying climate change impacts, and modeling sediment erosion. It is made more useful through data products like the Land Cover Atlas, sea level rise viewer, and other tools to analyze and understand the land cover data.
This document summarizes the status of orthoimagery for Hawaii and the US Pacific Basin. It discusses the various satellite sensors used to acquire the imagery, including WorldView-2 and WorldView-3. It provides timelines of imagery acquisition for different islands from 1997 to 2015. It also describes how the imagery data is distributed and the costs associated with acquiring the imagery from 2013 to 2015.
The document discusses the ArcGIS platform which enables employees to easily discover, use, make and share maps from any device. It provides mapping, analysis, data management and collaboration capabilities through an integrated web GIS platform including ArcGIS Desktop, ArcGIS Online and Portal for ArcGIS. The ArcGIS platform supports embedding web maps across various business systems and on any device through web browsers and applications.
The document discusses NOAA's Digital Coast website and tools for coastal management. Digital Coast provides data like LiDAR, land cover maps, historical imagery, and ocean use maps for several Pacific islands. It also offers tools like a tsunami information tool, land cover atlas, sea level rise viewer, and economic data. Training is provided through various methods. The goal is to bring geospatial and coastal management communities together on an integrated platform to support coastal resource management.
This document discusses key threats to Hawaiian reefs from various human activities and natural stressors. It provides details on potential data sources that could be used to map the spatial distribution and intensity of each threat, such as sediment export models, land use maps, commercial fishing records, buoy locations, and satellite sea surface temperature data. The goal is to develop comprehensive spatial datasets characterizing multiple threats to better understand their combined impacts and inform management decisions.
The document discusses how The Trust for Public Land uses geographic information systems (GIS) to connect communities through conservation planning. It explains that TPL works with communities to create "Greenprints", which are plans that identify local conservation priorities through public engagement and GIS modeling. Greenprints incorporate weighted criteria like recreation, habitat protection, and water quality to create composite maps of conservation value. These maps guide land prioritization and stakeholder action planning. The document provides examples of TPL's Greenprinting work in Hawaii and its Climate Smart Cities initiative, which uses GIS to help communities increase greenspace and mitigate climate impacts.
This document discusses using low-altitude aerial surveys with unmanned aerial vehicles to assess coral reef health in Kaneohe Bay, Hawaii. The goals are to develop a cheap, fast, and spatially accurate technique to survey entire reef areas at a high resolution. Test flights with a DJI Phantom 2 drone captured imagery over 1500 square meters that was processed into orthomosaics and used texture/color models to classify and map coral species, bleaching, and health. This could create a reef atlas for Kaneohe Bay, inform management, and increase understanding of reef dynamics by providing long-term monitoring at various spatial scales.
This presentation compares speed data from Hawaii DOT monitoring stations to the National Performance Measurement Research Data Set (NPMRDS) probe data. It finds that the two data sources match fairly well overall but that finer-grained Hawaii DOT data is needed for detailed analysis. The presentation demonstrates how to link NPMRDS travel time data to road network maps using open-source tools and provides examples of mapping and animating travel times using this data to estimate the impacts of traffic events. It concludes that the NPMRDS and Hawaii DOT data can both be used to analyze traffic conditions when combined with open-source spatial analysis tools.
This document summarizes Donald Hayes' presentation on the use of geographic information systems (GIS) technology and community level data visualization to inform planning efforts in Hawaii. Some key points:
- The Hawaii Department of Health uses a variety of health and socioeconomic datasets to identify needs, support grant applications, research, legislation and program evaluation.
- Data is compiled into a Primary Care Data Book which provides indicators by community on health outcomes, risk factors and socioeconomics using data sources like the census and vital records.
- The Data Book is used to assess primary care needs, highlight differences between communities, and facilitate data-driven decision making. It has supported funding and policy decisions and is utilized by various organizations.
The document discusses how GIS was used to enhance collaboration and decision making for the Honolulu Rail Transit Project. GIS provided a platform for HART, HDOH, and contractors to easily share and access environmental, planning, and construction data. Task-based apps within the GIS system allowed non-technical and technical users to efficiently view relevant project information. Organizing data within the GIS cloud-based system reduced data management costs and improved access to real-time project data compared to traditional approaches. Overall, the use of GIS created a powerful collaborative decision making tool that improved project planning, oversight and efficiency.
The Women in Technology project in Hawaii aims to encourage girls, women, Native Hawaiians, and other underrepresented groups to pursue STEM education and careers. It works to build a homegrown technical workforce through various initiatives like STEMWorks, which partners students with industry mentors on projects that address community needs. Key elements of STEMWorks include service-learning courses, promoting equity and cultural understanding, and facilitating self-directed learning through critical thinking and teamwork skills. The program also offers teacher professional development, student internships, and GIS training and workshops across various Hawaiian islands.
Zachary Smith outlines a plan to upgrade the organizational GIS system at the Office of Hawaiian Affairs. The current system uses outdated software and individual project files stored on a network drive. The upgrade will implement an enterprise GIS by moving all data and maps to a centralized geodatabase on a SQL Server, publishing feature services, and hosting web applications on ArcGIS Online. This will allow for better sharing of maps and data across the organization and with the public. The implementation will involve contracting a developer, upgrading servers and software, and publishing all assets as web services on the new system.
Geodesy is the science of measuring and monitoring the shape and size of the Earth. It provides the foundation for geospatial data through establishing accurate coordinate systems. The National Geodetic Survey is working to modernize and improve the National Spatial Reference System through new geometric and vertical datums by 2022, which will change coordinates by up to a few meters. Users should adopt the latest realizations of NAD 83 to prepare for these changes and ensure accurate positioning into the future.
This document summarizes the capabilities of aerial cameras used for unmanned aerial vehicle (UAV) imaging and mapping. It provides details on fixed-wing and rotary-wing UAVs, including payload, flight time, and advantages. The document discusses historical map-making techniques like plane table surveying and photogrammetry. It also demonstrates the high quality data and 3D models that can be generated from UAV imagery, including orthomosaics, point clouds, digital surface models, and meshes. Accuracy is assessed by comparison to lidar elevation data. The document shows examples of UAV products like 3D meshes of structures.
The document discusses preparations for the 2020 Census and Geographic Partnerships. It provides updates on the 2020 Census program, the Geographic Support System Initiative (GSS-I), the Local Update of Census Addresses Program (LUCA), and the Redistricting Data Program (RDP). It summarizes various census tests conducted in 2015, 2016, and future tests planned for 2017 and 2018. The goals are to test new address canvassing methods, self-response optimization, use of administrative records, and field operations to improve the 2020 Census.
This document discusses real-time GNSS correction sources and their applications and accuracy levels. It describes satellite-based augmentation systems (SBAS), Omnistar satellite differential corrections, Trimble RTX internet and satellite corrections, single base radio/internet corrections, and real-time networks. Accuracies range from 10-15 meters for autonomous GNSS to 1-3 centimeters for fixed baseline survey systems using corrections. The document provides an overview of correction options for different uses like survey, mapping, and their availability in Hawaii.
The Honolulu Board of Water Supply (BWS) uses geographic information systems (GIS) to manage its water infrastructure data and provide services to over 500 employees. BWS' GIS program started in 1989 and maintains spatial data for over 160,000 service connections and 2,100 miles of pipelines. Key GIS applications include HONU for web mapping, MANO for mobile workforce management, and GISMO for work order integration. BWS shares data with the City/County and other agencies and is developing live data feeds. The GIS program supports asset management, field data collection, and enterprise mapping, analysis, and collaboration tools.
The document outlines Hawaii's plans for height modernization from 2015 to 2026. Digital leveling of Oahu is underway from 2015 to 2016. Maui plans to issue an RFP for leveling consultants. Leveling of the Big Island and Kauai is planned from around 2018 to 2022. Lidar data collection for the islands is planned to begin in 2025. A new geoid model for Hawaii incorporating the leveling and lidar data is planned for 2026. The effort aims to benefit the private sector, government, and public utilities through improved vertical accuracy and control across the state.
More from Hawaii Geographic Information Coordinating Council (20)
5. Data - What’s New and Where Is It?
• Land Cover
• Imagery
• Lidar
• IfSAR
• Benthic Habitat
• NOAA Composite Shorelines
• U.S. Marine Boundaries
• Decision Support Tools
• Georegulations
6. High Resolution
Land Cover
• Derived from 2.4 meter
Quickbird multispectral
imagery (2005)
• Detailed and up-to-date
• Island of Oahu available
• Islands of Maui, Molokai,
Lanai, and Kahoolawe in
progress
– Will be released as completed
– Anticipated to be complete by
December 2008
7. High Resolution
Impervious
• Derived from 2.4 meter
Quickbird multispectral
imagery (2005)
• Provides detailed
information on location
and extent of man-made
impervious surfaces
• Developed in partnership
with State of Hawaii Office
of Planning
8. Moderate Resolution
Land Cover
• The Hawaiian islands will be part of
the 2001 national effort
– NOAA and USGS cooperative effort
• We are making use of existing land
cover information for the islands
– C-CAP and HI GAP (2001)
• We are not remapping the islands
• This is not an updated land cover
• This effort could be expanded to
the rest of the Pacific Islands
9. Hawai`i Land Cover
Complete Maui County
December 2008
2005 In
1992 2001
Progress
Land Cover
11. …and American Samoa and Guam
Guam
Tutuila
Ofu Olosega
Ta`u
Impervious Surfaces - Available Now
Impervious Surfaces – March 2009
Land Cover – June 2009
29. Training
• GeoSpatial Technology
• Coastal Management Training
• Building Process Skills
Training course in Guam
30. Training
GeoSpatial Technology
• Coastal Applications Using ArcGIS
• GIS For Managers
• Assessing GIS for Your Organization
• Introduction to ArcGIS I
• Remote Sensing
• GIS Tools for Strategic Conservation Planning
• Conservation Data Documentation
Homer, Alaska
• Coastal Inundation Mapping
31. Training
GeoSpatial Technology
GIS For Managers
• Four-hour course
• ArcView 9.2
• Lectures, demos, group discussions, hands-on
problem solving
• Participants will learn how to define a GIS
describe the key capabilities of a GIS, become
familiar with GIS terms and concepts, and
recognize the limitations of a GIS.
32. Training
GeoSpatial Technology
Remote Sensing for Spatial Analysts
• Two-day course
• ArcView 9.2
• Lectures, demos, group discussions, hands-
on problem solving
• Participants will learn how to use remote
sensing to investigate issues such as land
cover and use, shoreline erosion, and
fisheries and benthic habitat assessment.
33. Training
GeoSpatial Technology
Coastal Inundation Mapping
• Two-day course
• ArcView 9.2
• Lectures, demos, group discussions, hands-
on problem solving
• Participants will learn how to understand
inundation terminology and datum issues,
access topographic data, create a digital
elevation model, and conduct a risk and
vulnerability assessment.
34. Training
How to Get Training
Partnerships:
• Partner with other local agencies in order to maximize training
benefits and minimize costs
Assess Costs:
• Hosts are responsible for providing venue and equipment (for
attendees).
Coordination:
• A local lead contact needs to be established between partners
http://www.csc.noaa.gov/cms/cls/remote_training_requirements.pdf
35. Geospatial Technical Assistance
What we can help you with?
• Finding the right GIS tools and data
• Assessing appropriateness of tools or data to a specific question
• Using GIS tools and data
What we can’t help you with…
• We can’t do the work for you
• We can help you to ask the right questions – but we can’t tell you
what the answers to those questions should, or shouldn’t be
36. The Magic Planet
• Weather / Climate Datasets
• Marine Mammal / Sea Bird Migrations
• Oceans Health / Human Health Datasets
• Marine Geology and Biology
To coordinate Magic Planet for your event,
or for more information, contact:
Nadia.Sbeih@noaa.gov
(808) 532-3204
37. Data Visualization and Integration
Science on a Sphere
• Hawaii has two SOS installations
• Used in museum exhibits
• Reaches students and community
• Educates on a variety of topics
• Grabs audience attention
Humpback Whale Migration
With Sea Surface Temperature
Nadia.Sbeih@noaa.gov
(808) 532-3204
38. Modeling and Analysis Tools
• Developed through partnerships with end users
– Meet the needs of coastal resource managers
• Provide decision makers with more information
– Explore a wider range of management alternatives
– Develop better understanding of ecosystem processes and
possible responses to management actions
• Enhance the usability of remotely sensed data products
– Add value to existing data products
– Save time by automating processes
39. Featured Tools
1. Impervious Surface Analysis Tool (ISAT)
• Calculates the percentage of impervious surface cover for a given
geographic area
2. Nonpoint-Source Pollution and Erosion Comparison Tool
(N-SPECT)
• Examines land cover to calculate runoff, nonpoint source pollution,
and erosion
3. Habitat Priority Planner (HPP)
• Identifies priority locations for conservation and restoration
planning, and performs query visualizations
40. Common Characteristics
Cost of the tool • Free
Software requirements • ArcGIS 9.2 (SP 4)
• Spatial Analyst extension
Data requirements • Raster land cover
• Site-specific ancillary
information (free and
downloadable)
GIS skill level • Intermediate
Support • Documentation
• Online help files
• Training
41. ISAT Fundamentals
• Impervious surfaces impact water quality and quantity
• ISAT estimates the percentage of a given area covered by
impervious surfaces
• Impervious surface areas can be recalculated for different
land cover and land use scenarios
42. ISAT Data Needs
• Land cover • Impervious surface
• Analysis units coefficients
• Population density
(optional)
43. ISAT Outputs
• New shapefile based on analysis units
• Attributes updated with total area, impervious surface area,
and percent impervious surface
44. N-SPECT Fundamentals
• Nonpoint source pollutants impact water quality
• N-SPECT estimates storm runoff, eroded sediment, and
pollutant loads, and tracks these loads as they accumulate
downstream.
• Allows comparisons of different land cover and land use
scenarios
45. N-SPECT Data Needs
• Land cover
• Topography
• Soils
• Precipitation
• Rainfall erosivity
• Pollutant coefficients
• Water quality standards
47. HPP Fundamentals
• HPP is a geospatial planning tool that can be used to:
– Inventory habitat conditions
– Identify, rank, and prioritize restoration and/or conservation sites
– Provide spatial planning support to natural resource managers
– Analyze proposed changes in land use or land cover
– Create maps, reports, and queries
48. HPP Data Needs and Workflow
Data Needs Workflow
• Raster land cover • Step 1: Classify Habitats
• Project specific points, • Step 2: Habitat Analysis
lines, or polygons • Step 3: Explore Data
55. Land Cover Atlas
• Online land cover summary and analysis website
• Summarizes land cover for user defined areas
• Will not require GIS software
• Publicly available
56. Tool Considerations
• Broadly applicable screening tools
• Provide decision support, not decisions
• Require human interaction, stakeholder input
• Data are limiting factors, and don’t come with tool
• Analysis time dependent on extent, resolution, and process
complexity
57. For More Information:
Digital Coast www.csc.noaa.gov/digitalcoast
Legislative
www.csc.noaa.gov/legislativeatlas
Atlas
Training www.csc.noaa.gov/training
Jamie.Carter@noaa.gov Christine.Feinholz@noaa.gov
(808) 525-5387 (808) 532-3769
NOAA Pacific Services Center
737 Bishop St., Suite 2550
Honolulu, Hawaii 96813
www.csc.noaa.gov/psc/