Download to read offline


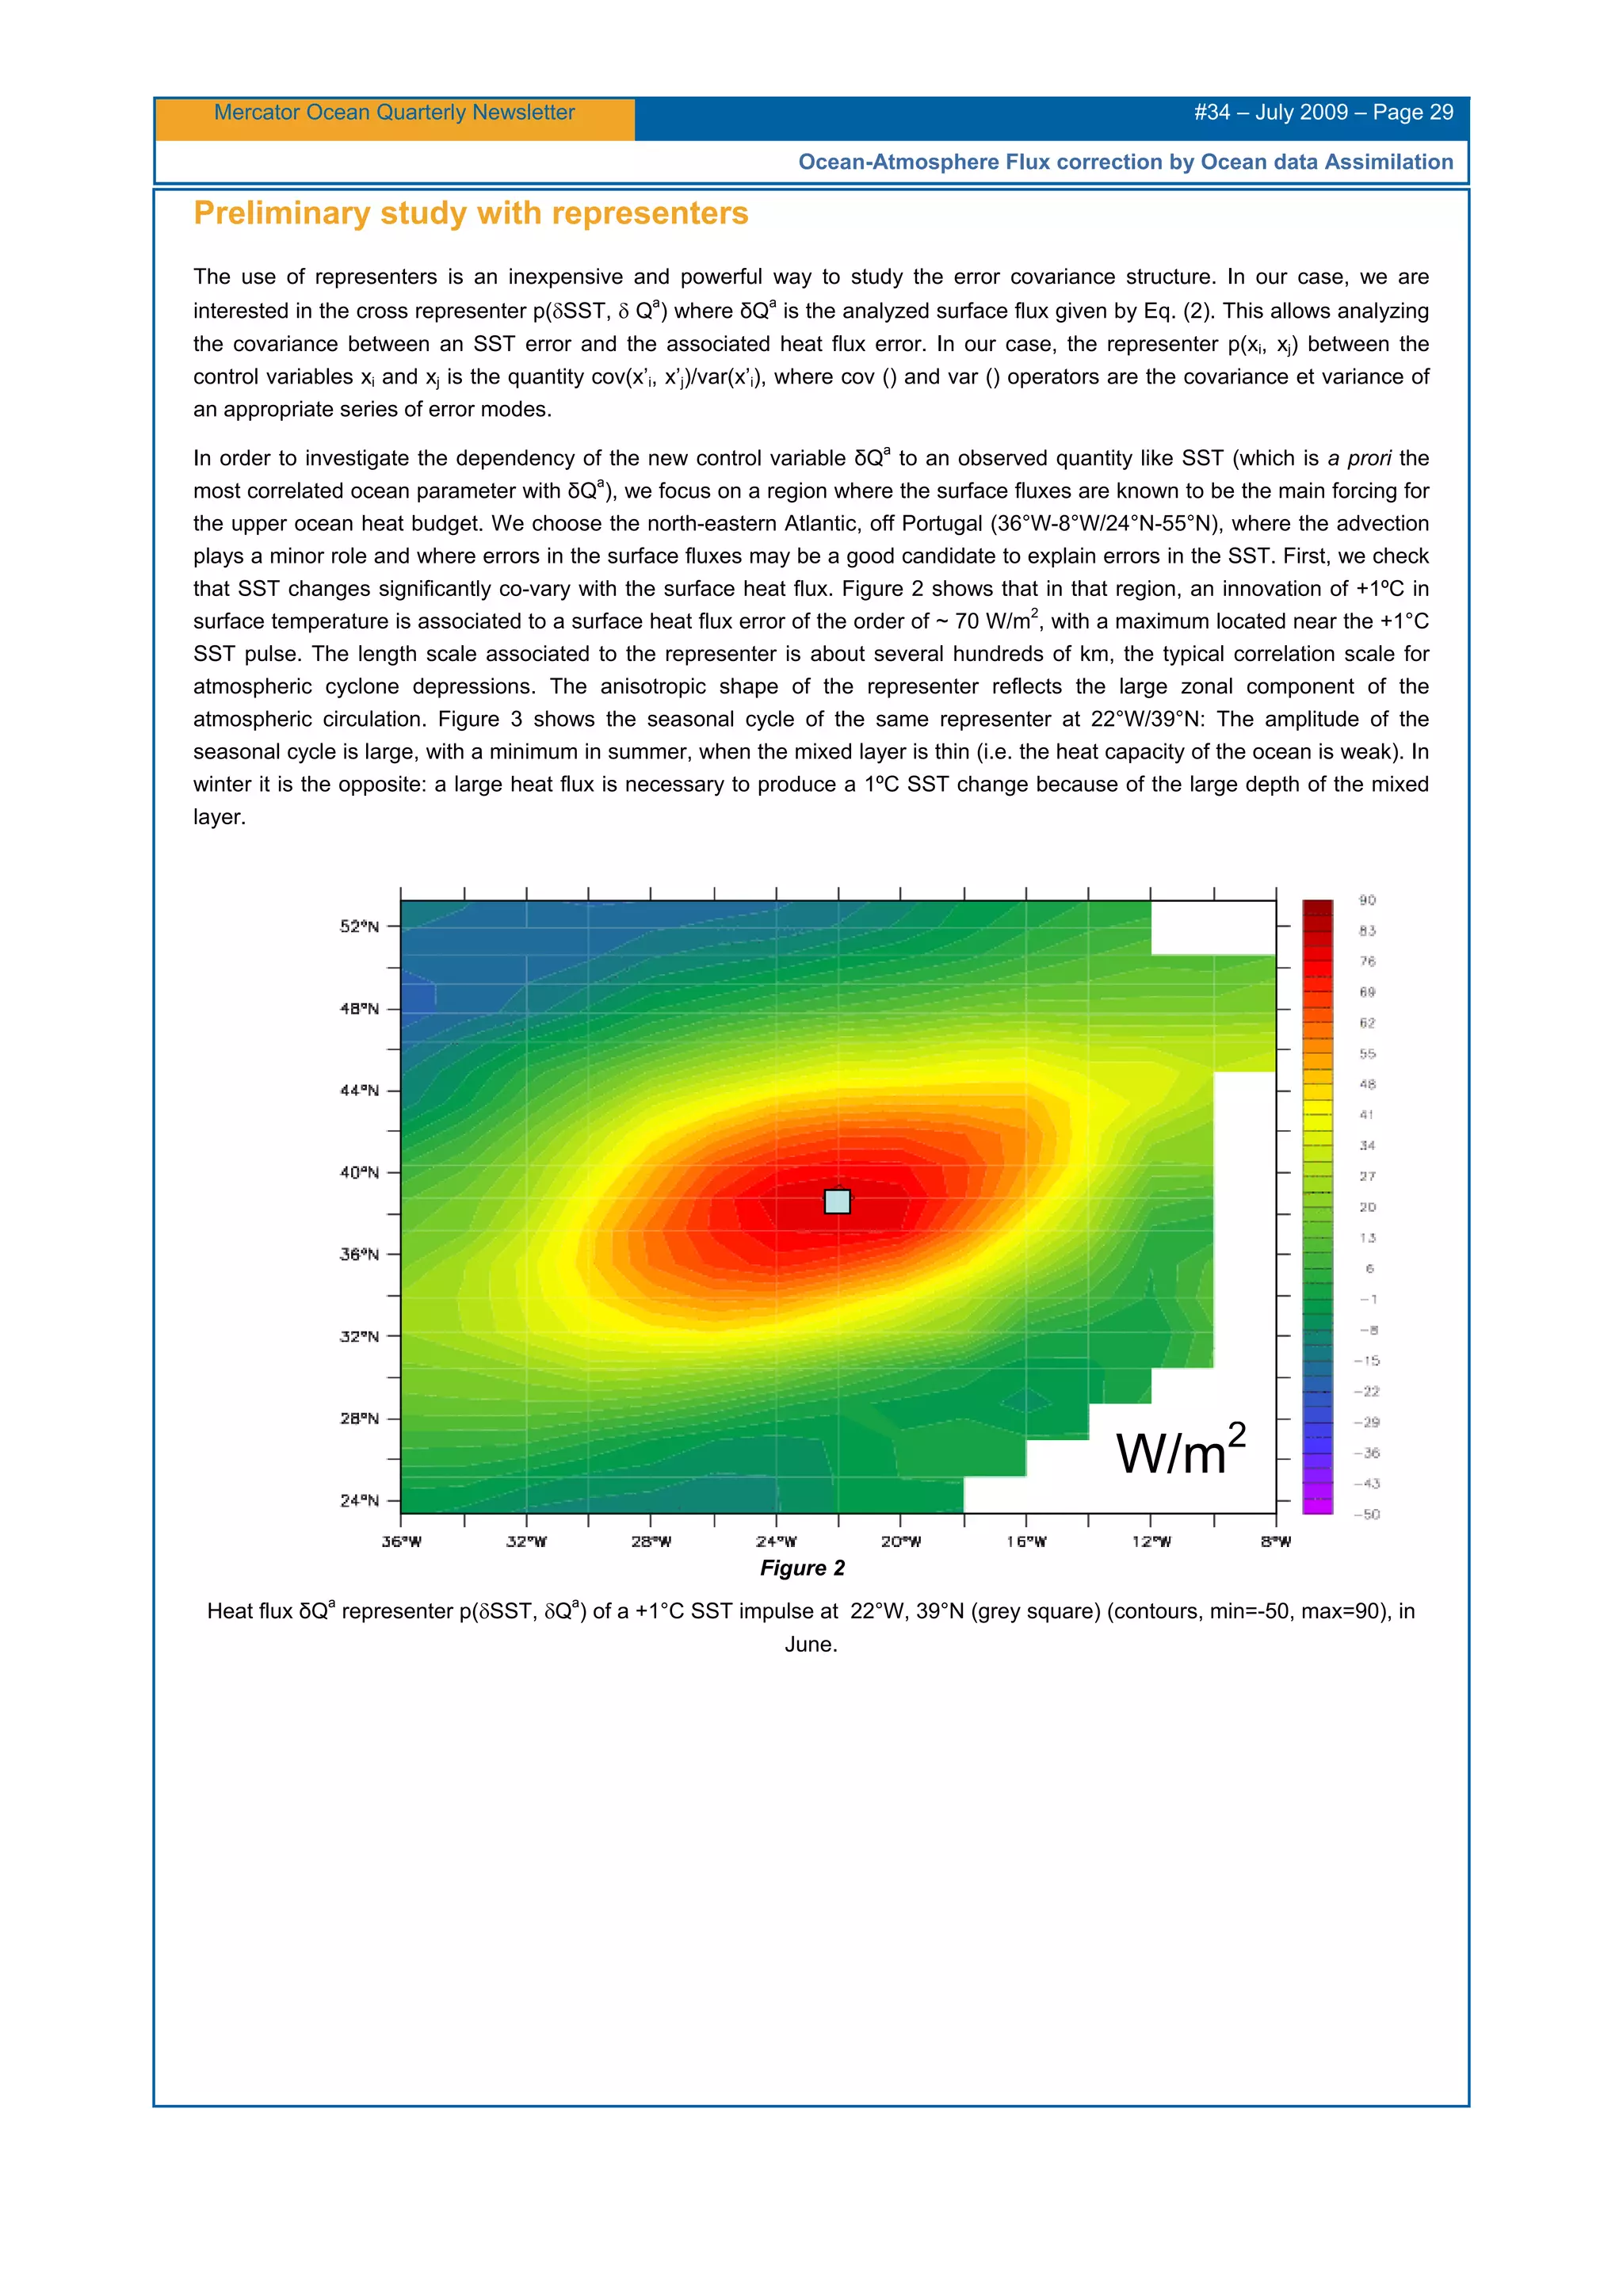
![Mercator Ocean Quarterly Newsletter #34 – July 2009 – Page 30
Ocean-Atmosphere Flux correction by Ocean data Assimilation
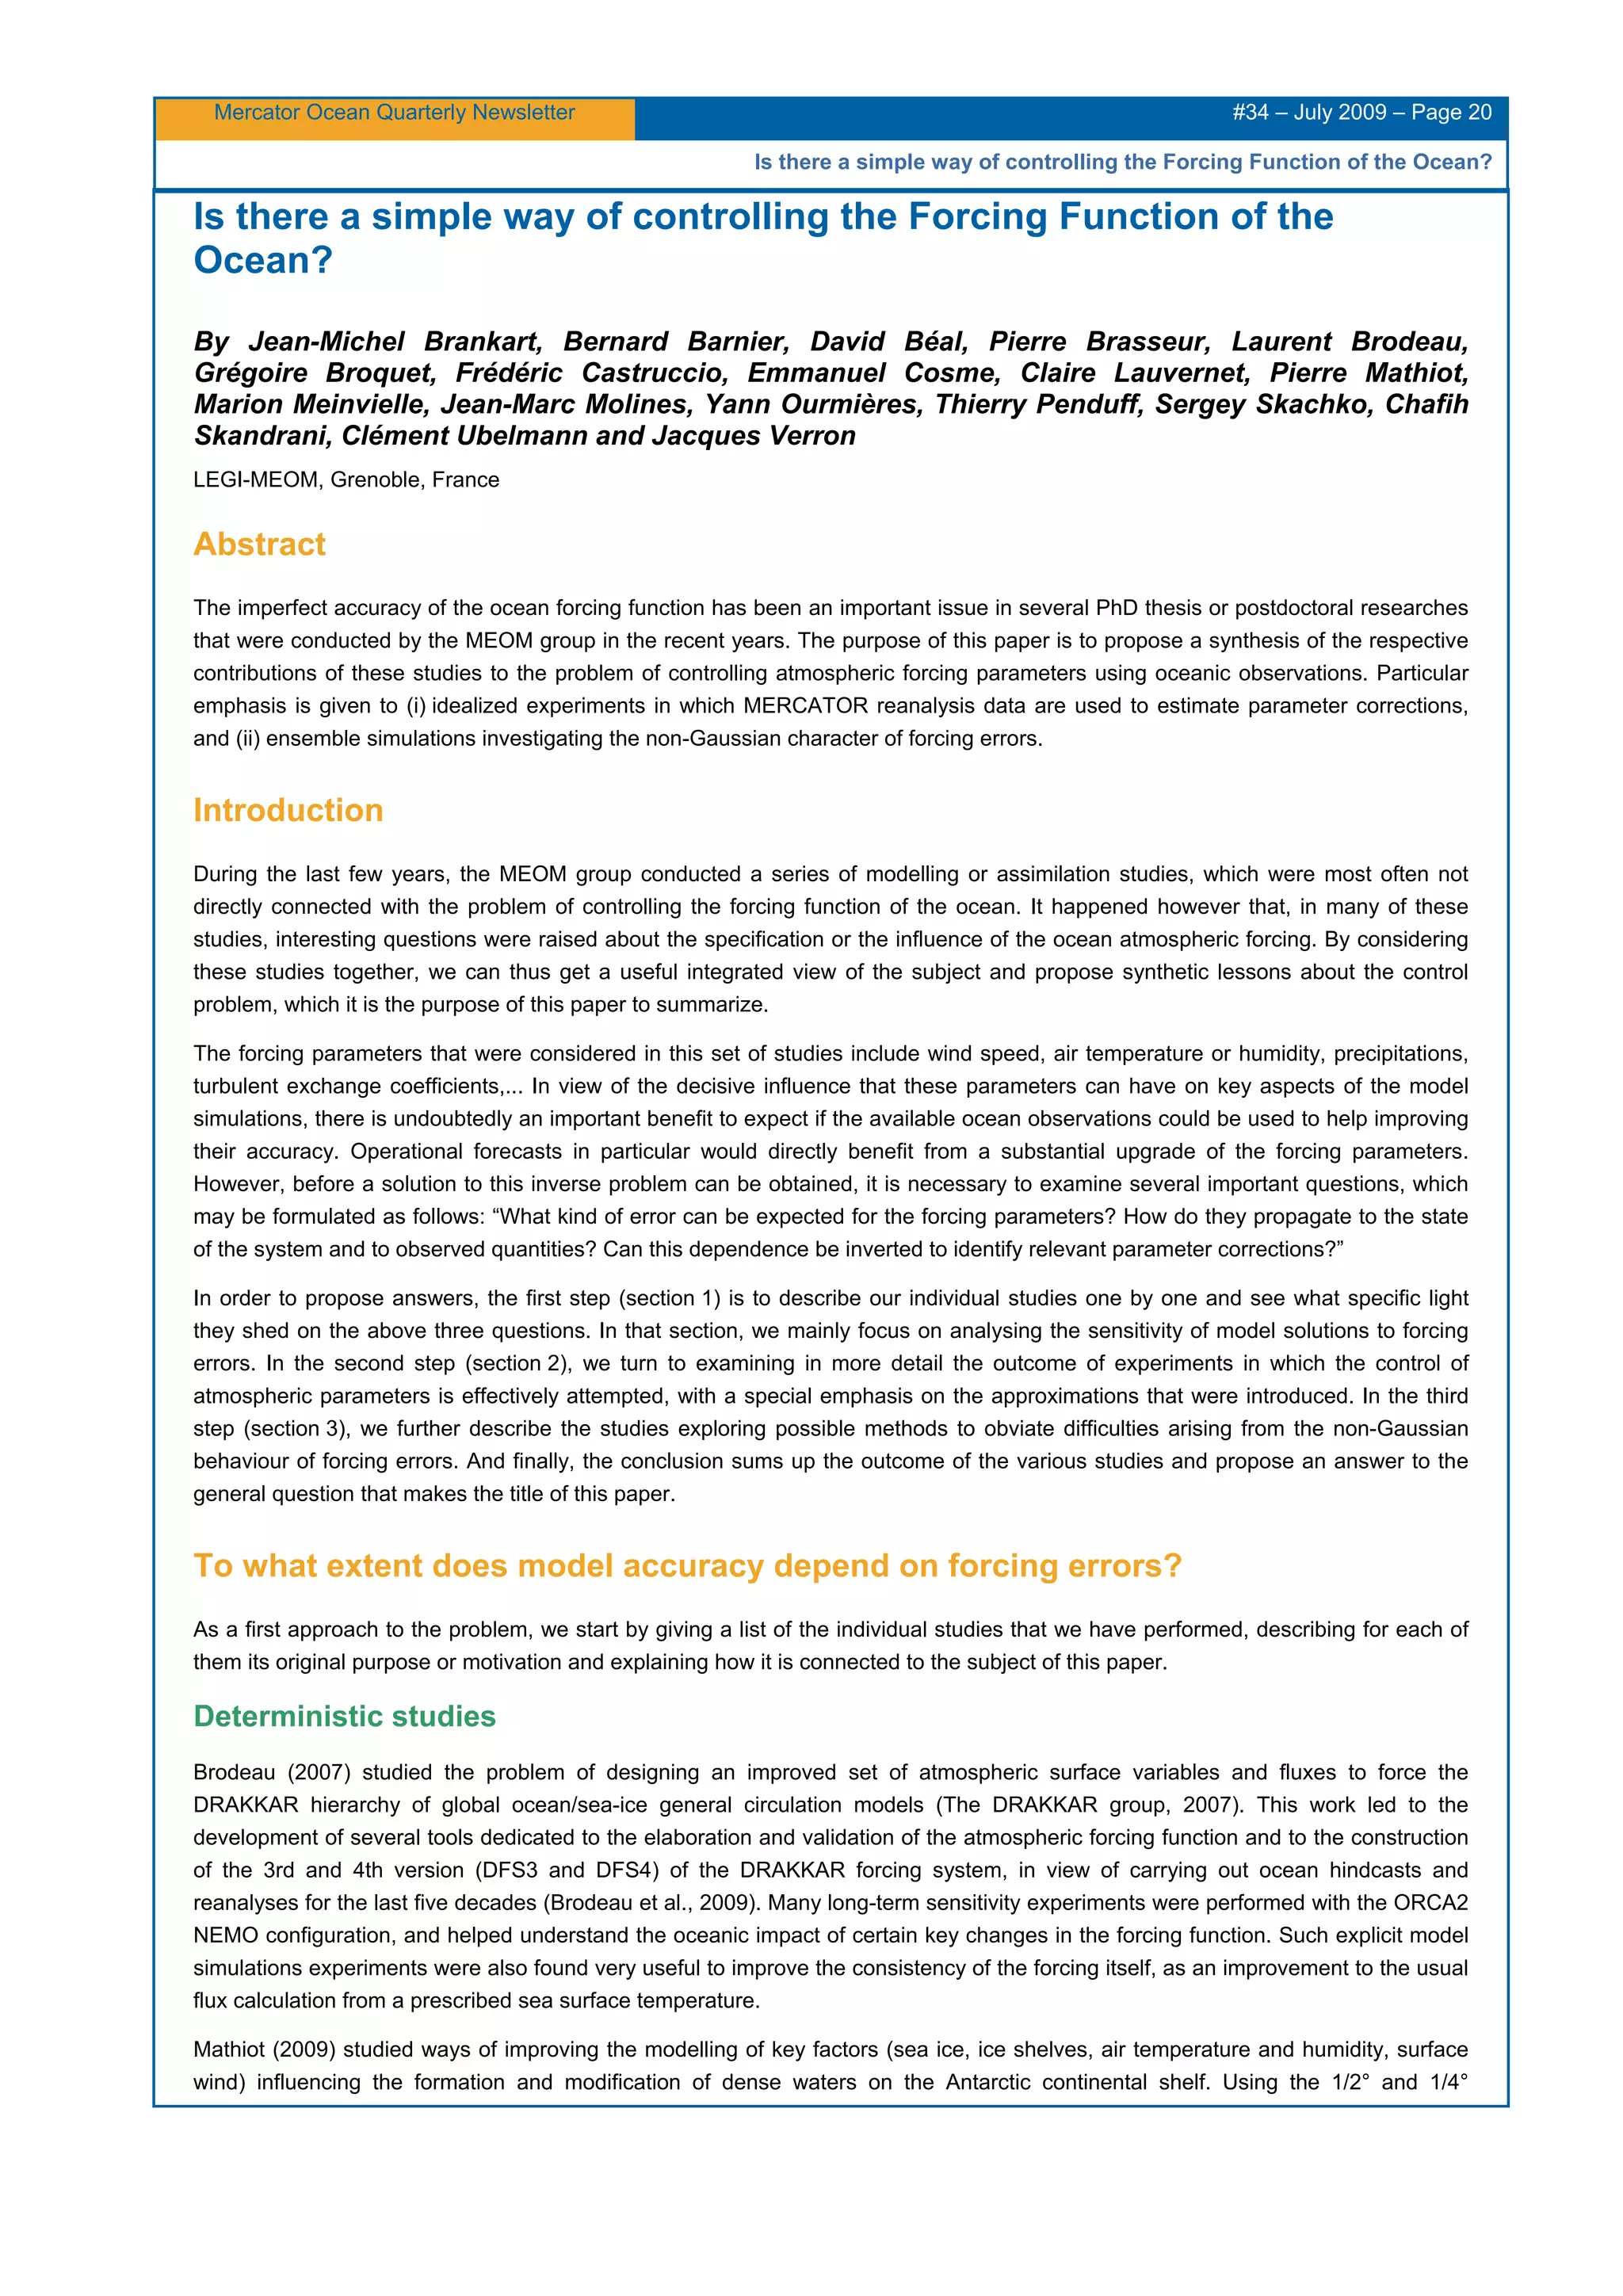
Figure 3
Seasonal variability of the covariance at the surface between the heat flux control variable δQ
a
and a +1°C SST impulse located
at (22°W, 39°N). Note the large surface heat flux (~ 300W/m2) in winter, consistent with a deep mixed layer (ie high heat
capacity of the ocean).
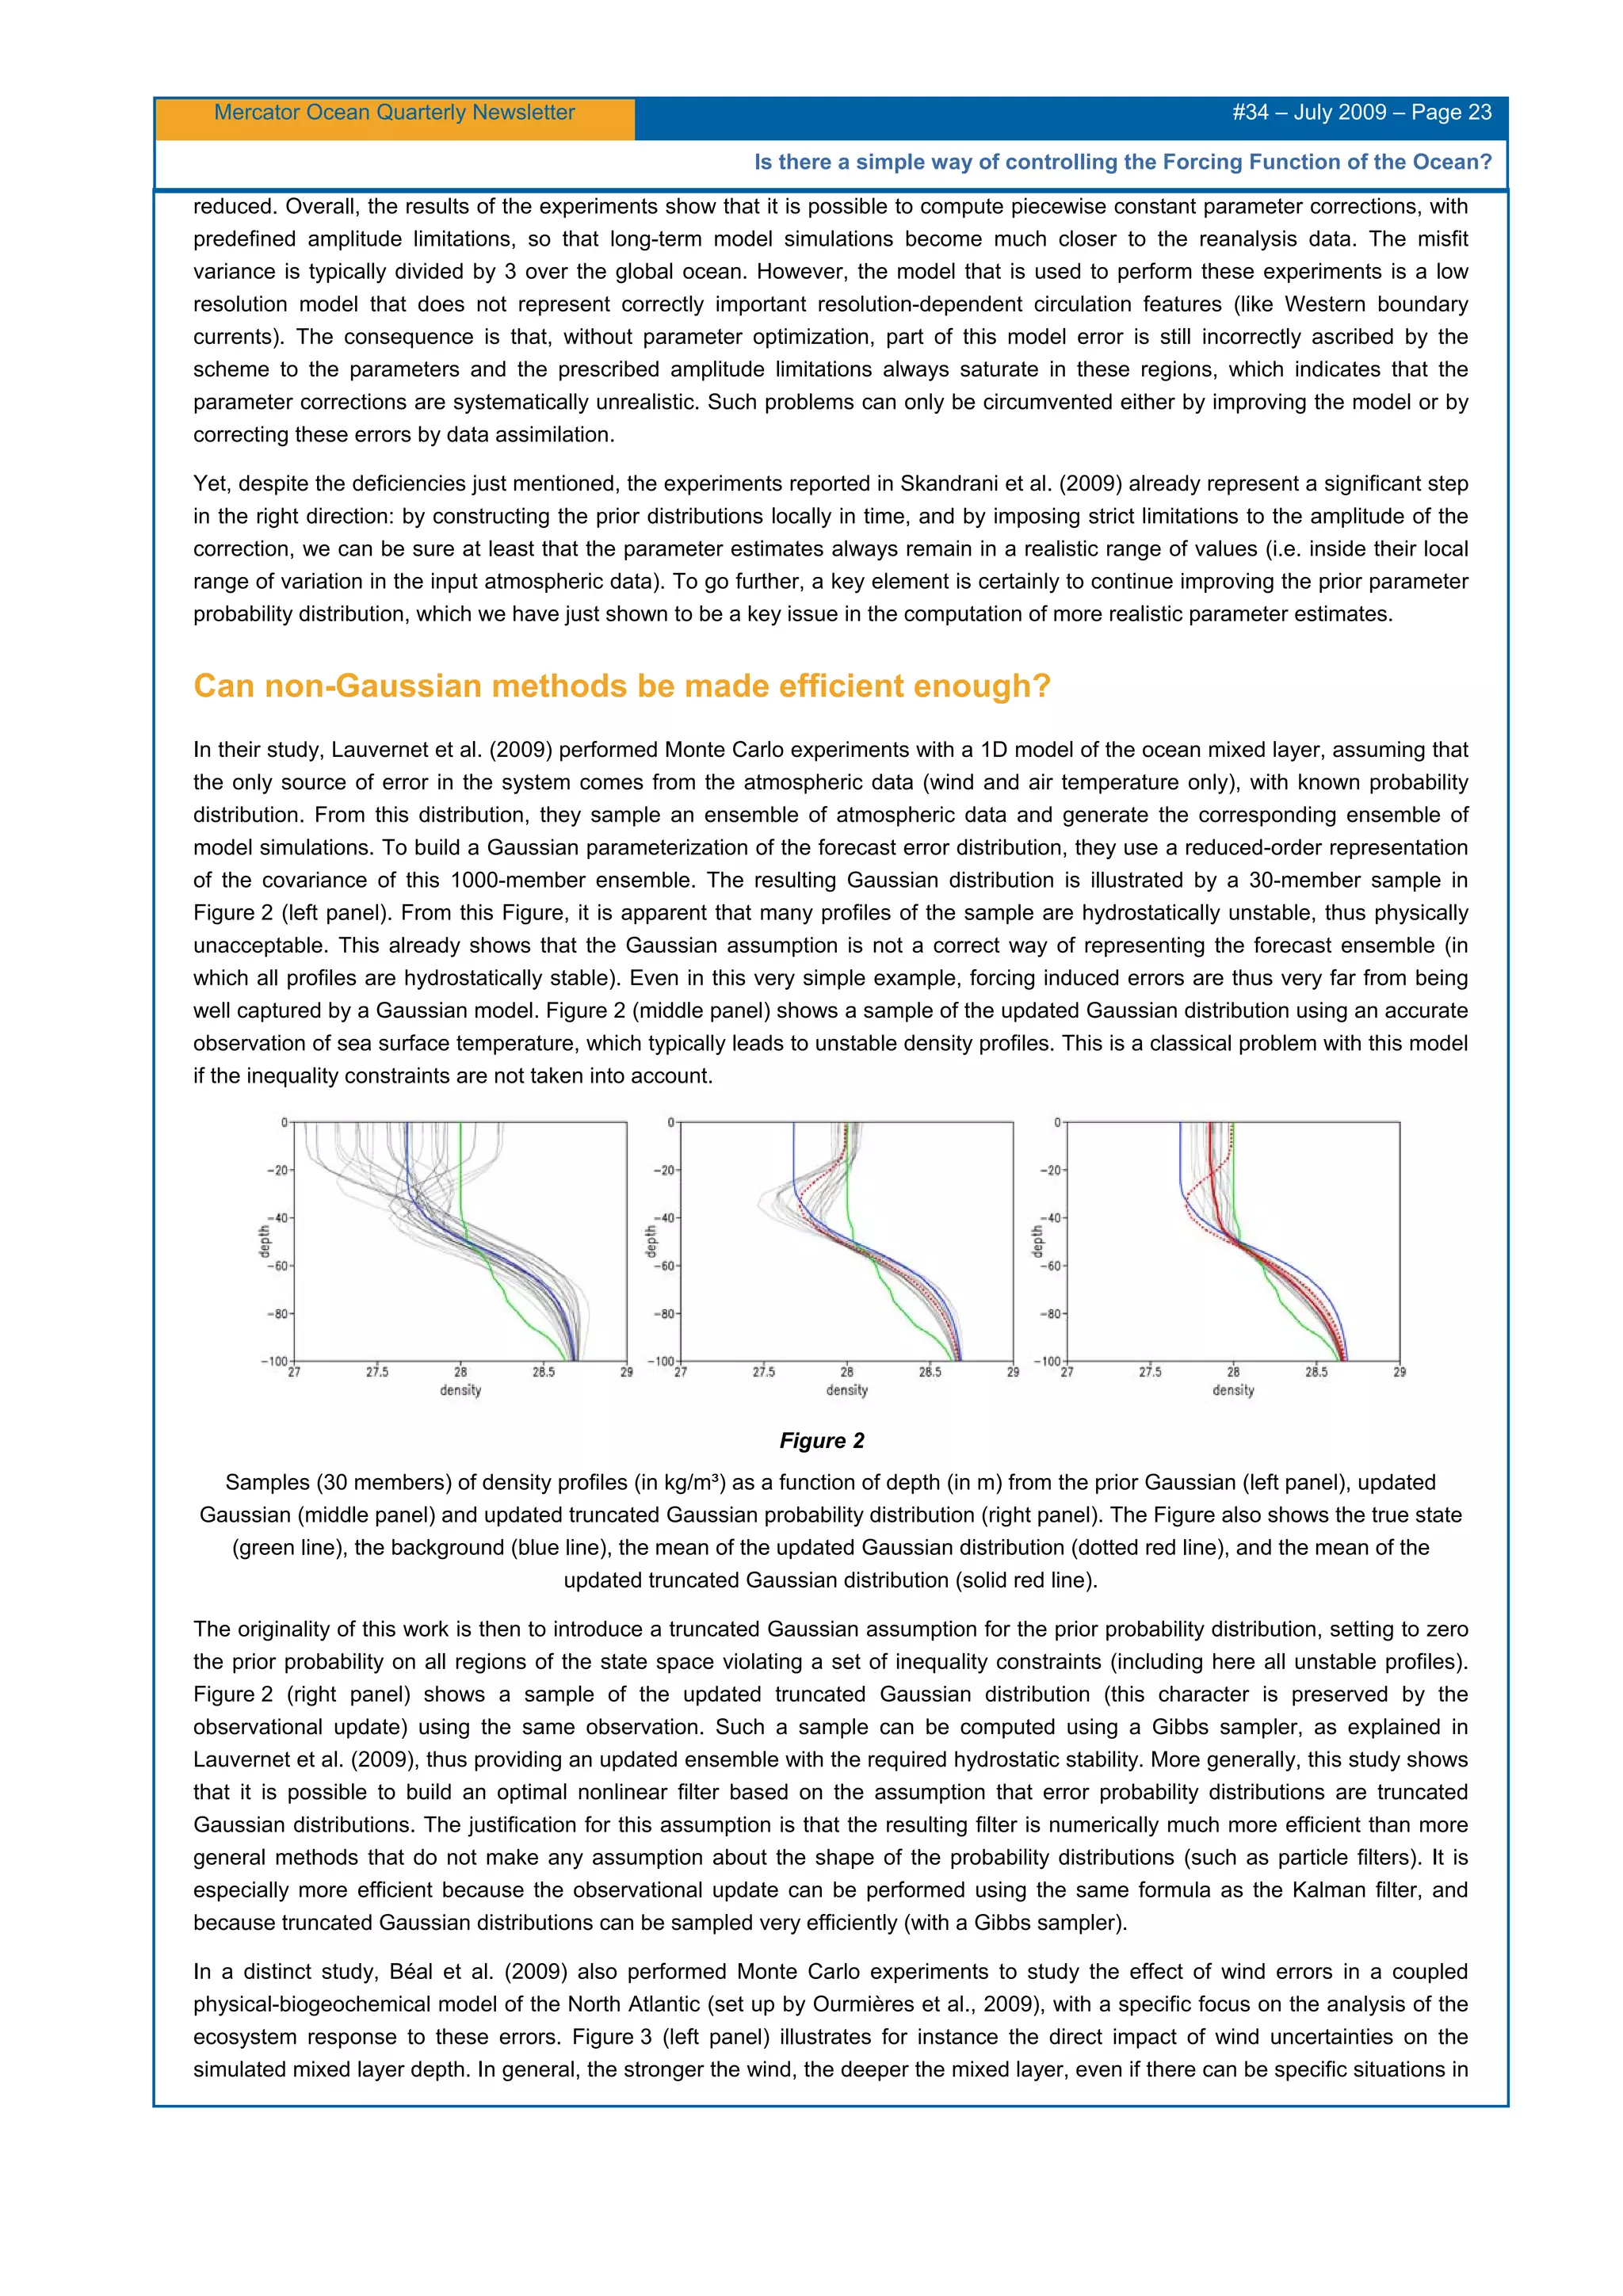
In general, covariances are used to project the observation information onto the control variable. In Figure 4 we show the
"reverse" representer p(δQ
a
, δSST) (i.e. control variable projected onto observation) of a +100 W/m
2
heat flux pulse during 7
days at 22°W/39°N. This means that if surface heat flux observation were available, the impact of a single perfect (no
observation error) observation would generate a temperature correction as illustrated in Figure 4. The temperature response
shows a strong seasonal cycle which results in summer in an intense correction in temperature localized within the first 10~20
meters of the ocean, which indicates the strong summer stratification. In winter, the same impulse of heat flux is associated to a
much weaker temperature correction, but spreads over a thicker ocean layer (~90 m depth). We can note that the representer
decorrelates as distance increases, without any “noisy” signals at distance. This is due to the choice of a large number of error
modes (~250) to build the model covariance.
Figure 4
Zonal vertical section of the representer p(δQ
a
, δSST). A +100W/m
2
impulse (during 7 days) located at (22°W, 39°N) is
associated to changes in the temperature field along the latitude 22°W. Scale: [-0.01, 0.24] °C for (a) and [-0.1, 1] °C for (b).
Note the strong seasonal variability of the vertical extension associated to the mixed layer seasonal cycle in summer and winter.
We studied the geographical structure of several representers between surface temperature and surface heat flux at mid
latitude in the North-eastern Atlantic, a place where significant correlation is expected between heat flux errors and upper ocean](https://image.slidesharecdn.com/mercatoroceannewsletter200934-150505023426-conversion-gate01/75/Mercator-Ocean-newsletter-34-30-2048.jpg)


![Mercator Ocean Quarterly Newsletter #34 – July 2009 – Page 33
Ocean-Atmosphere Flux correction by Ocean data Assimilation
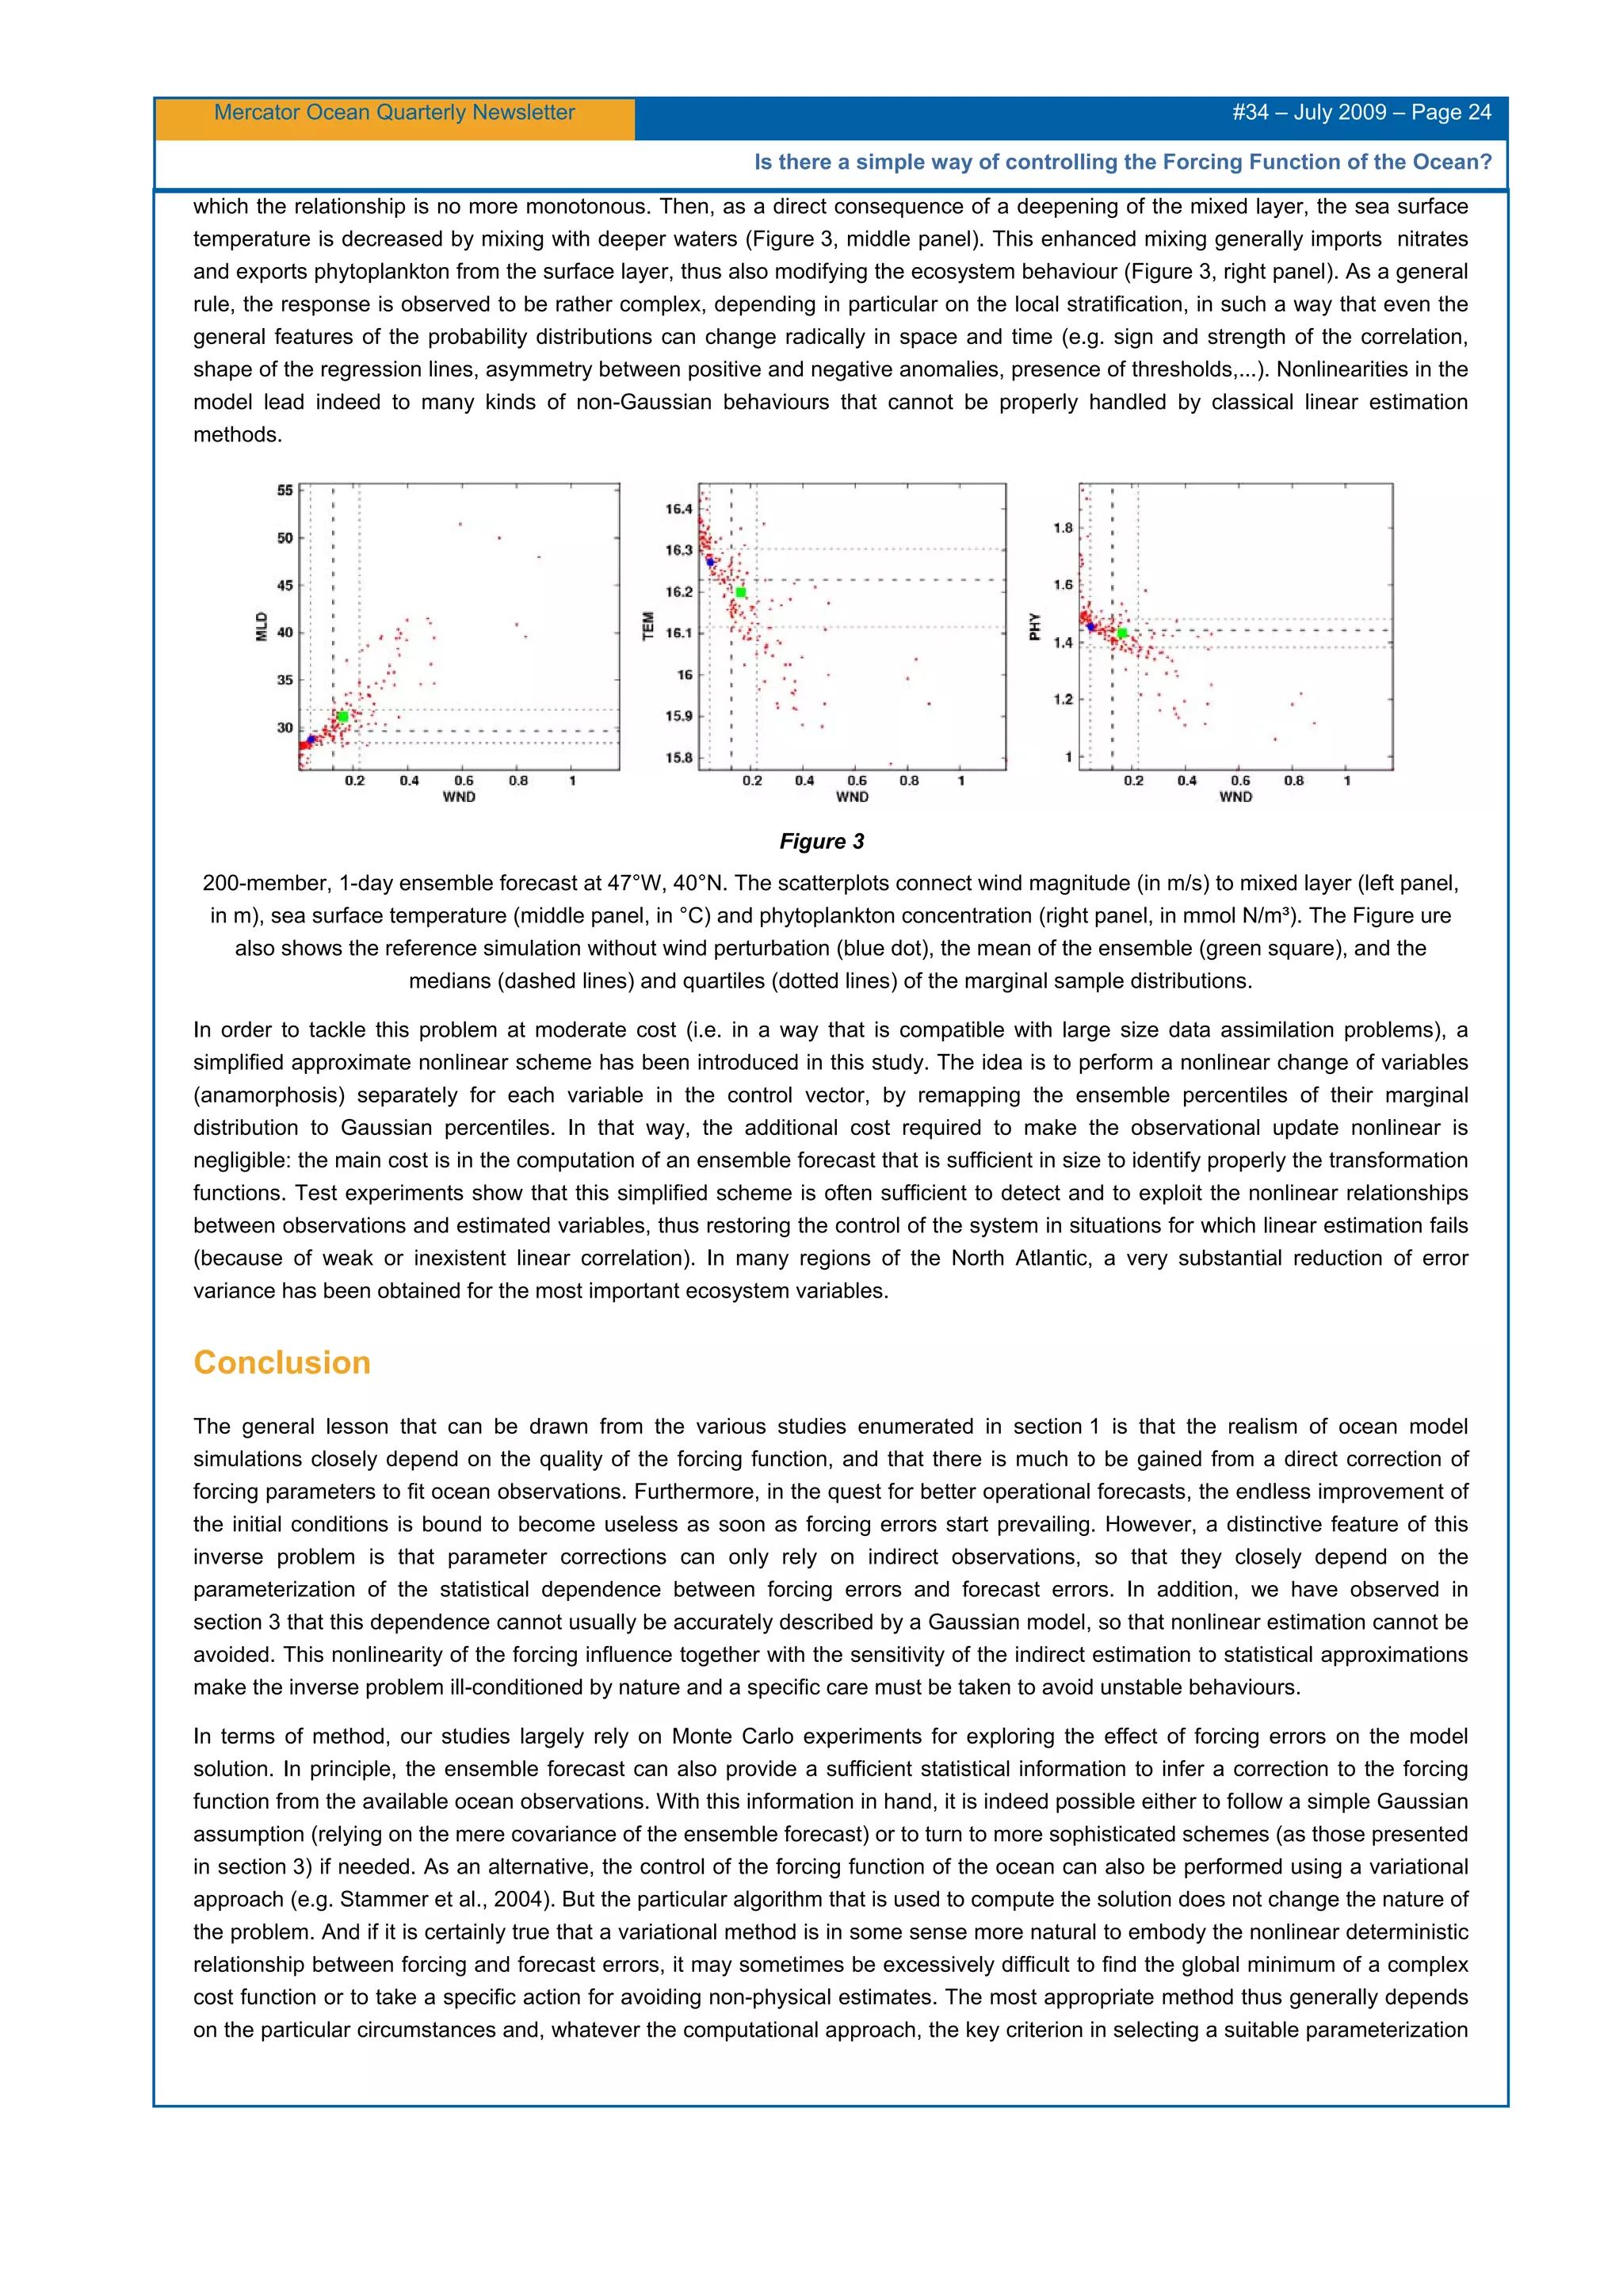
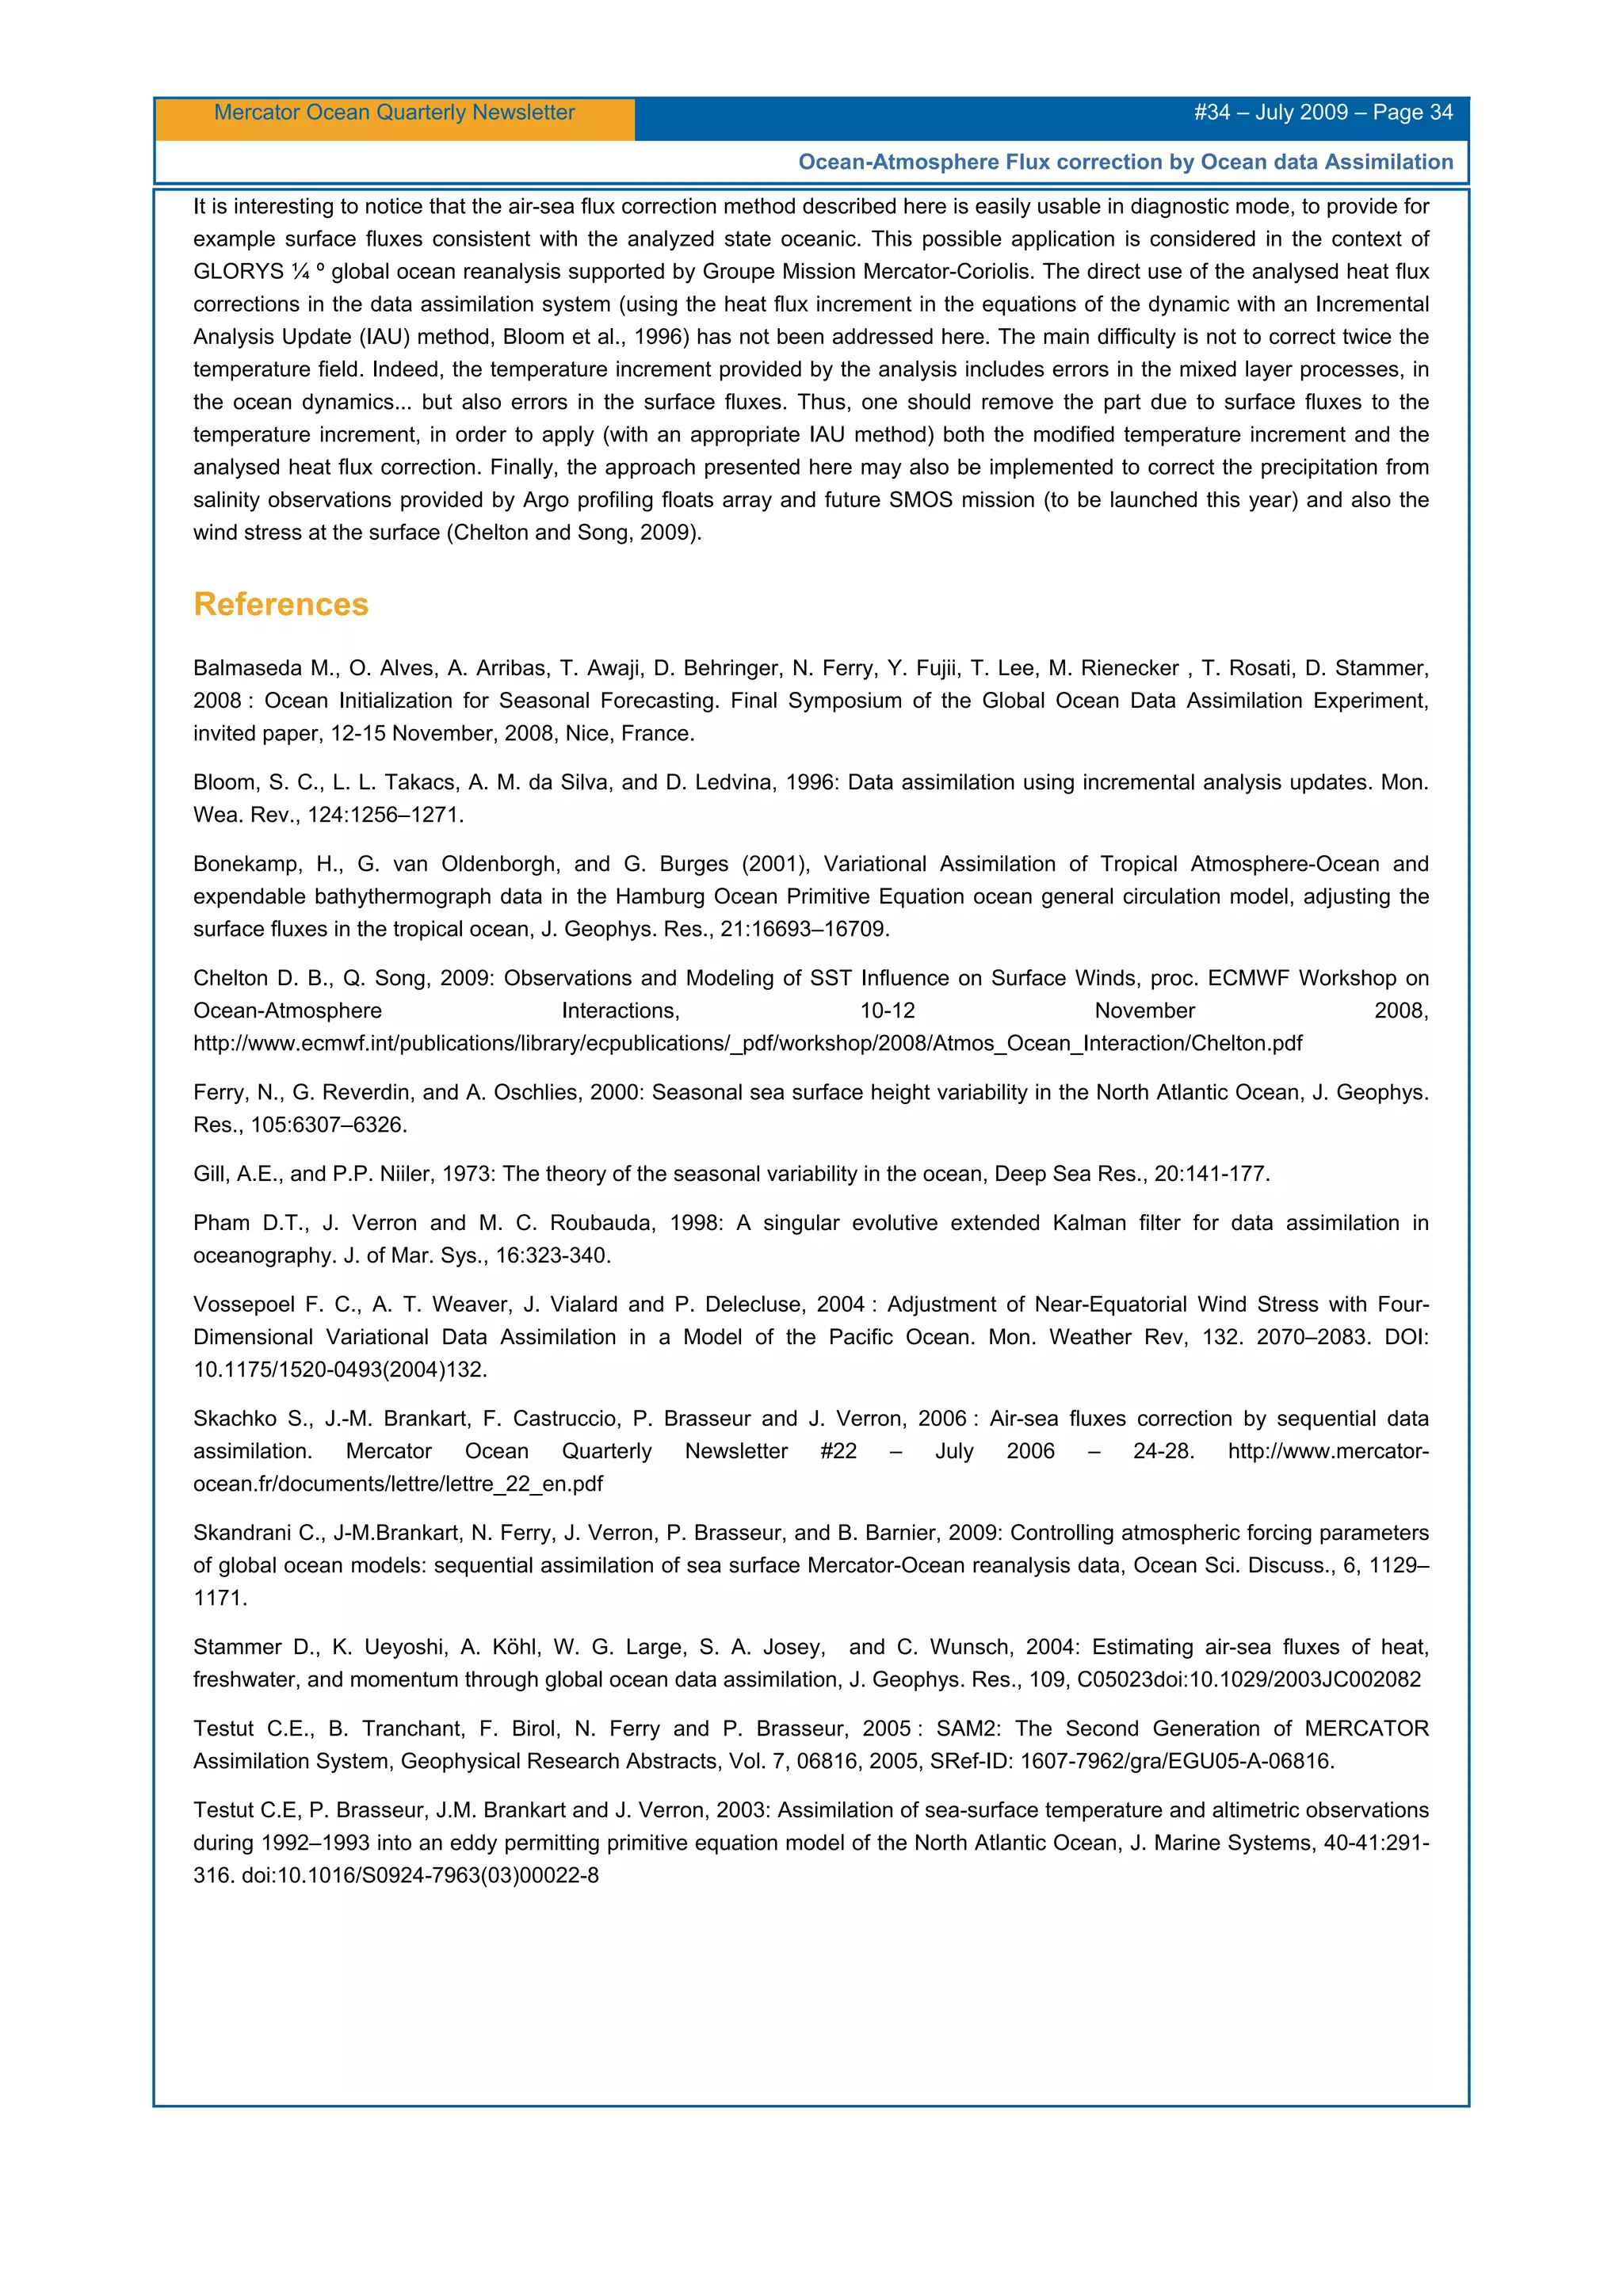
Figure 6
(a) annual mean temperature increment δT averaged within the mixed layer for ASSIM (in °C). (b) Annual mean of the heat flux
correction δQ
a
diagnosed in ASSIM and used in QCOR (in W.m
-2
). (c) Annual mean of δT
Q
, the equivalent temperature change
associated to the heat flux correction δQ
a
(see Eq. (2)) (in °C). (d) Ratio R = < δT
Q
>/< δT> of the mean equivalent temperature
change associated to the heat flux correction (i.e. Figure 6c) over the mean increment averaged within the mixed layer (i.e.
Figure 6c). A ratio close to 1 indicates that the heat flux is fully responsible for the forecast error in temperature; a ratio close to
0 indicates that other processes than surface heat flux may be related to the SST forecast error.
These results are however very encouraging with respect to that method of heat flux correction with ocean data assimilation.
Away from the strong current regions the diagnosed surface heat flux corrections seem realistic and physically consistent with
our knowledge of the ocean thermo-dynamics and of the model deficiencies.
Conclusions and perspectives
A method for correcting the air-sea heat flux by ocean data assimilation is presented. A new variable has been introduced in the
control vector which is the integral of the net surface heat flux received by the ocean. The heat flux correction is then deduced
from this new variable analysis increment, assuming that the increment is the integral of the error of heat flux on the window of
assimilation. A preliminary study of some representers shows a satisfactory behaviour of this new control variable in terms of
seasonal variations and spatial correlation lengths (horizontal and vertical).
This method is then implemented in a realistic framework. A data assimilation experiment with Mercator assimilation system
version 2 (SAM2) and coarse resolution model ORCA2 is used to obtain a series of net heat flux corrections for the year 2005.
These corrections have an order of magnitude similar to the error bars generally admitted on air-sea heat fluxes, except in areas
of strong meso-scale activity (i.e. frontal zones) where the corrections can be very large, because of SST biases in the model.
The temperature increment associated to the heat flux correction (average within the mixed layer), is compared to the mixed
layer temperature increment. The average ratio of these quantities (R = δT
Q
/δT) is close to 1 at middle and high latitudes, while
it is almost zero at the equator. This indicates that except in the tropical region and near western boundary currents, the error on
the temperature in the upper ocean layer is largely explained by the heat flux. This is consistent with our knowledge of the
ocean thermo-dynamics.
A twin experiment is then carried out with: (i) a control run and (ii) a model integration forced with the analysed surface heat
fluxes obtained previously. The results show that the SST misfit average and rms are dramatically reduced. In regions where
the SST bias (wrong position of the fronts for example) is large, the data assimilation system tries to correct this bias by
adjusting the surface heat flux. In these areas, the heat flux correction analysed is sometimes too strong and unrealistic, and
this may lead to too strong stratification / convection in the ocean upper layers. A limitation of the heat flux increment appears to
be necessary in these areas. A way to achieve this would be to limit the heat flux increment, i.e. to impose the ratio R to be in
the range [0;1].](https://image.slidesharecdn.com/mercatoroceannewsletter200934-150505023426-conversion-gate01/75/Mercator-Ocean-newsletter-34-33-2048.jpg)


The July 2009 issue of the Mercator Ocean Quarterly Newsletter focuses on data assimilation techniques in operational oceanography, highlighting the importance of international summer schools for training future oceanographers. It features several articles discussing advancements in ocean data assimilation methods, including correction of ocean state and surface forcing, and emphasizes the collective achievements of the global ocean observing system (GOOS) over the past decade. The newsletter also announces an upcoming summer school in Perth, Australia, aimed at educating professionals in ocean modeling and data assimilation.

![Physical Characteristics Of A Real Tidal Energy Resource [David Woolf]](https://cdn.slidesharecdn.com/ss_thumbnails/davidwoolf-physicalcharacteristicsofarealtidalenergyresource-101117084345-phpapp02-thumbnail.jpg?width=640&height=640&fit=bounds)


