Downloaded 2,202 times

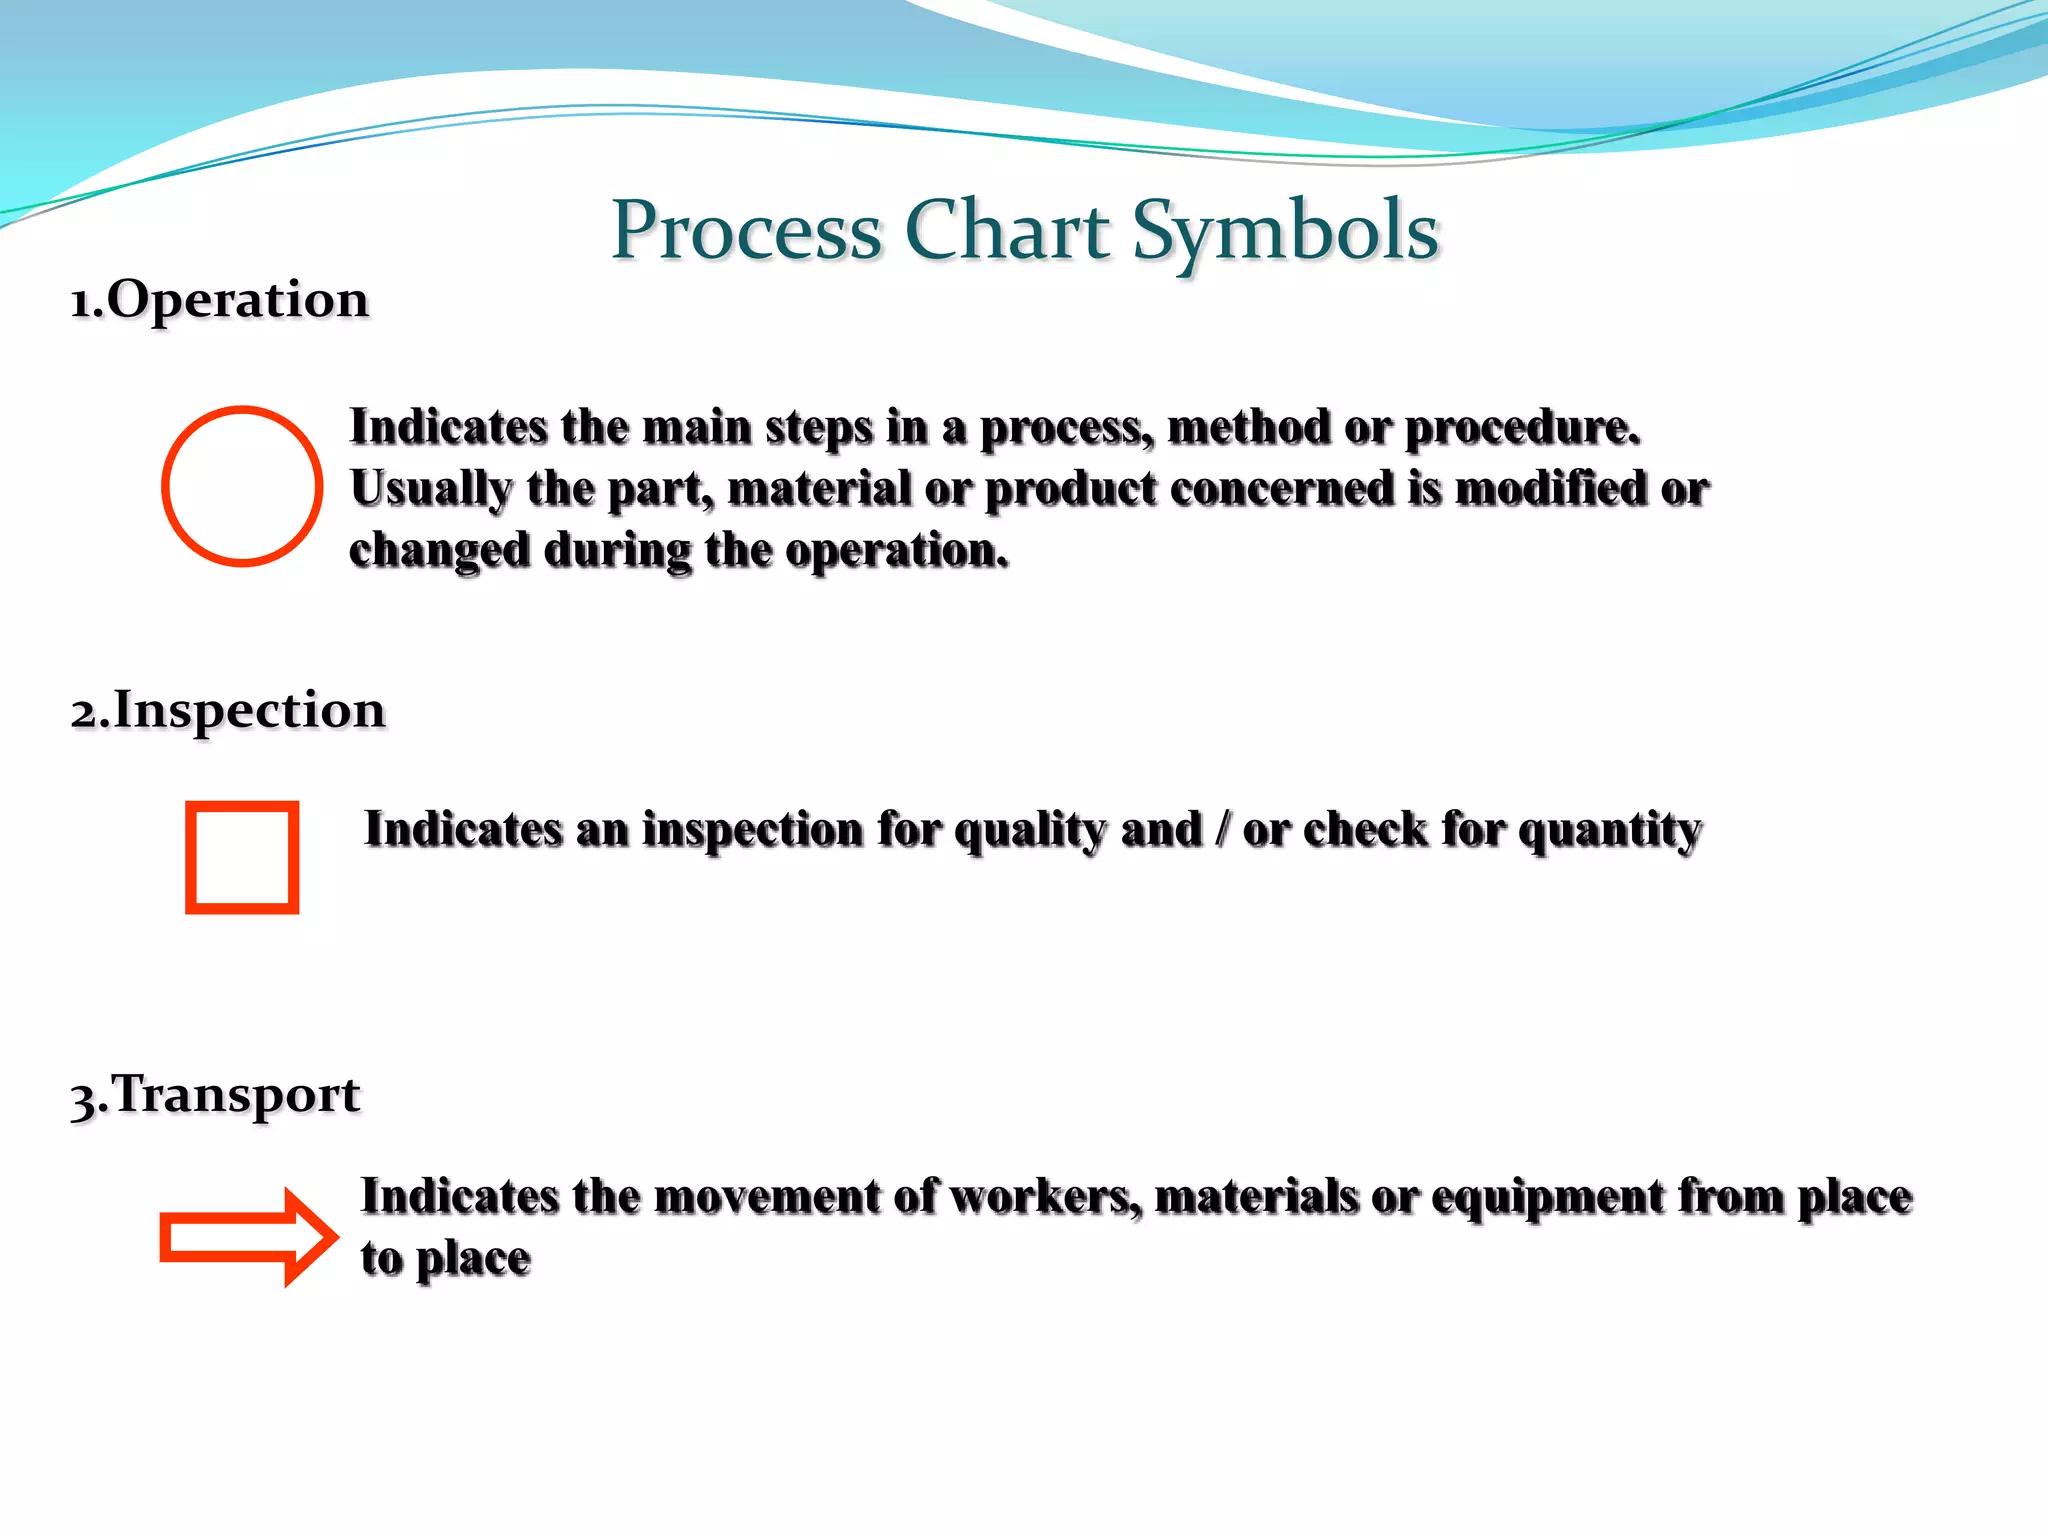
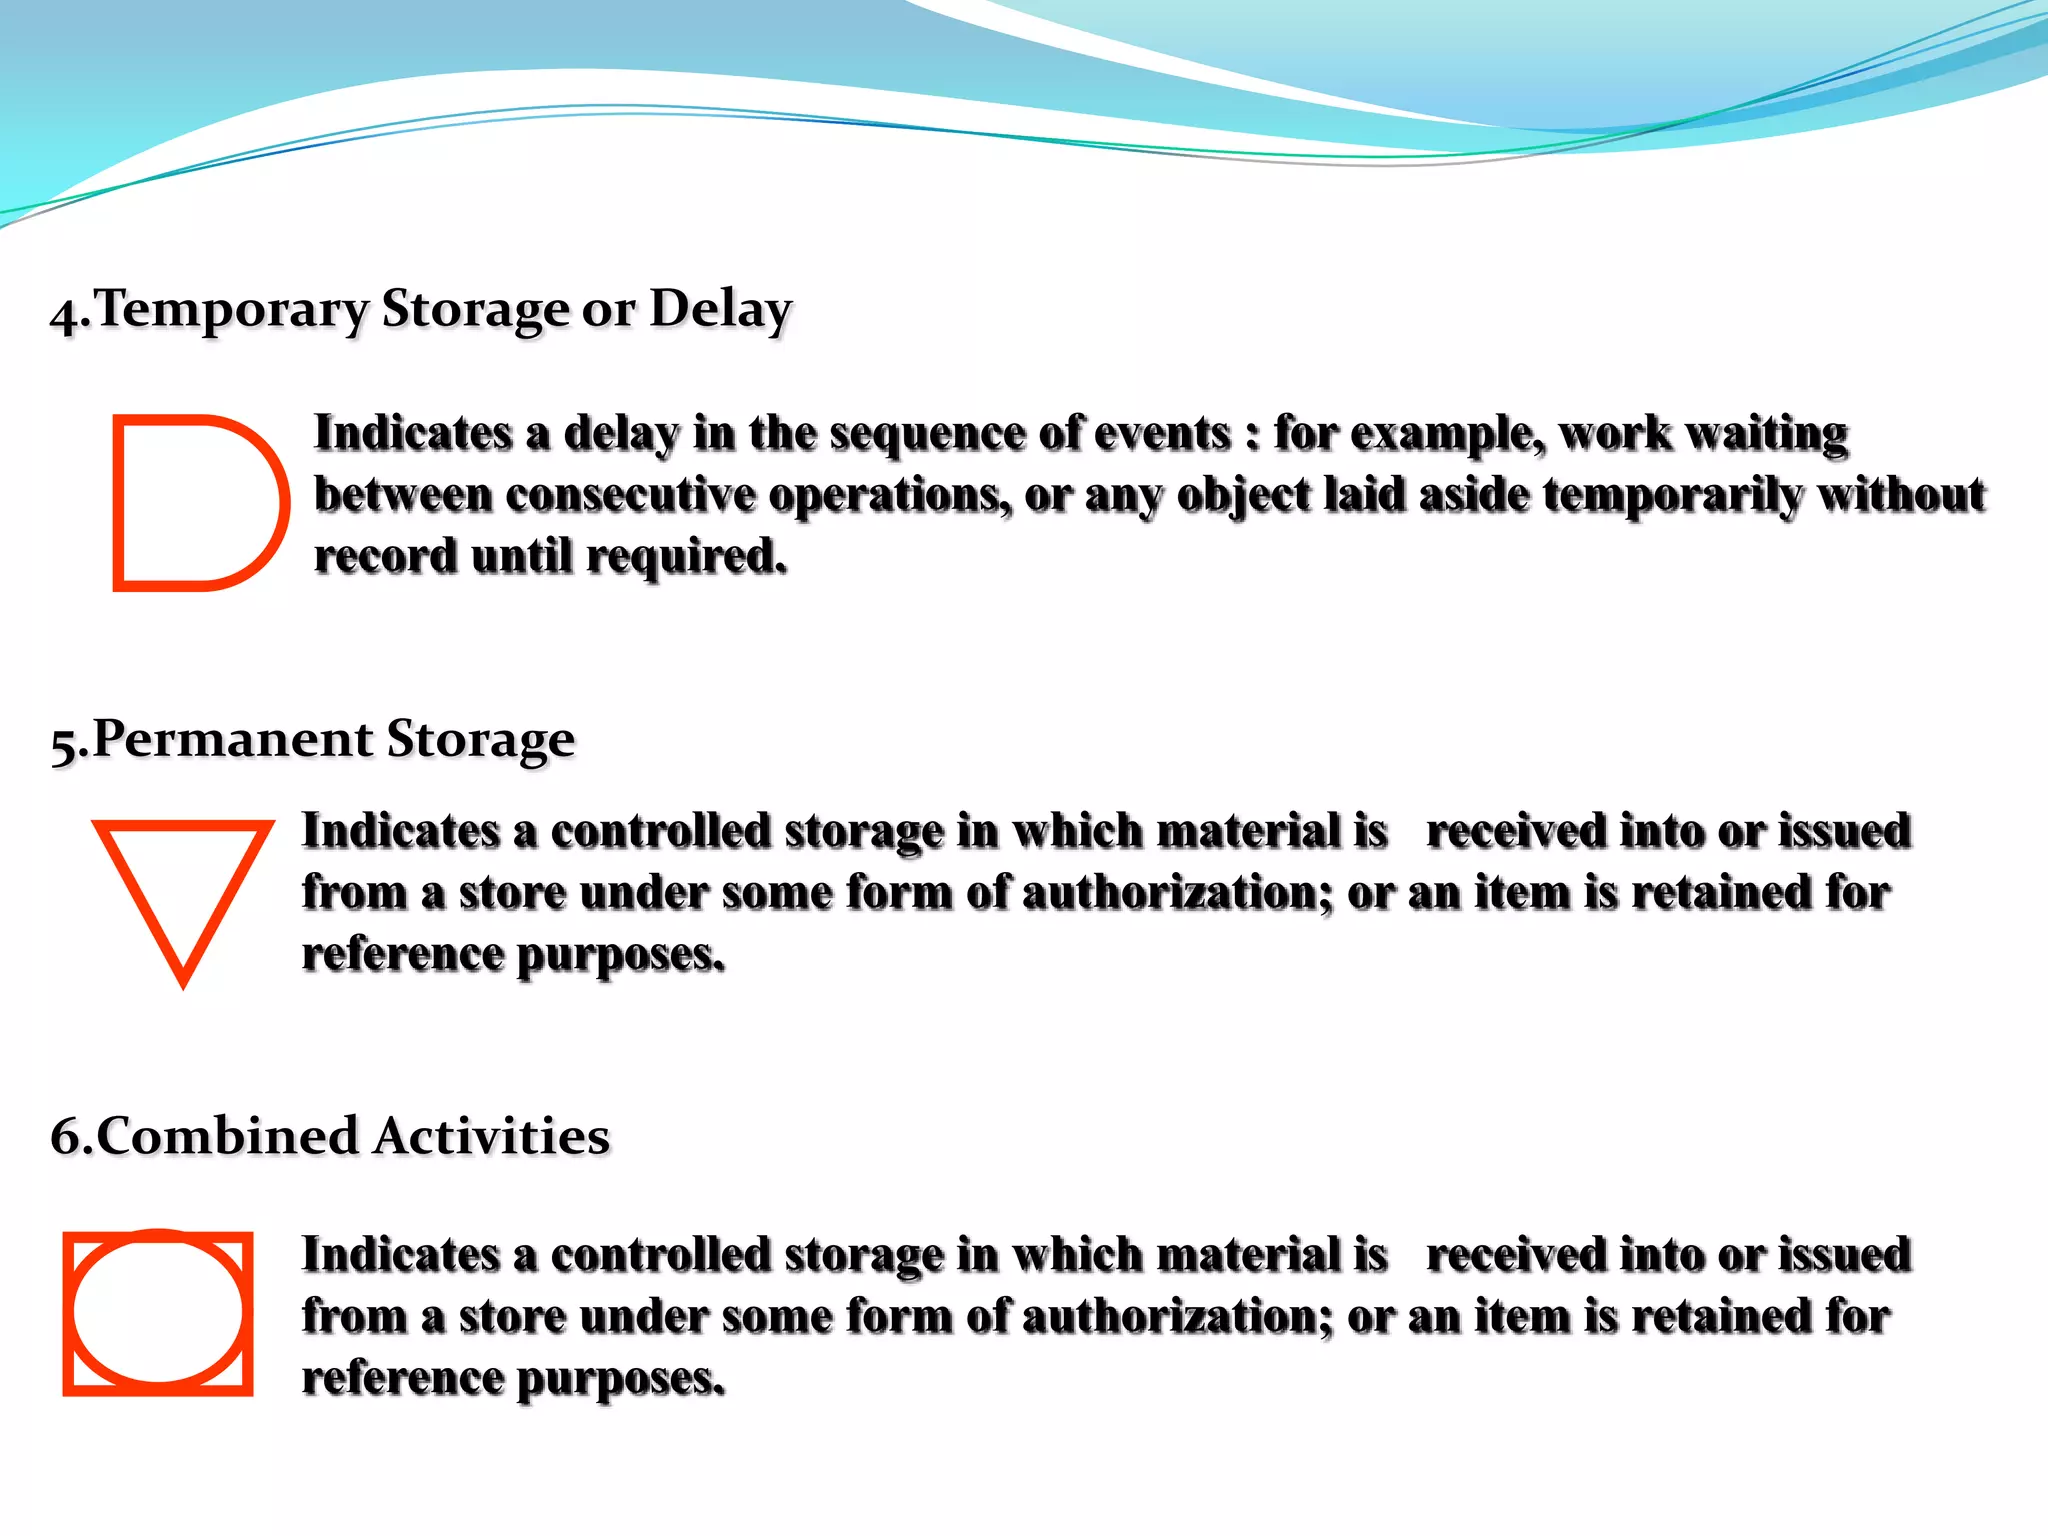
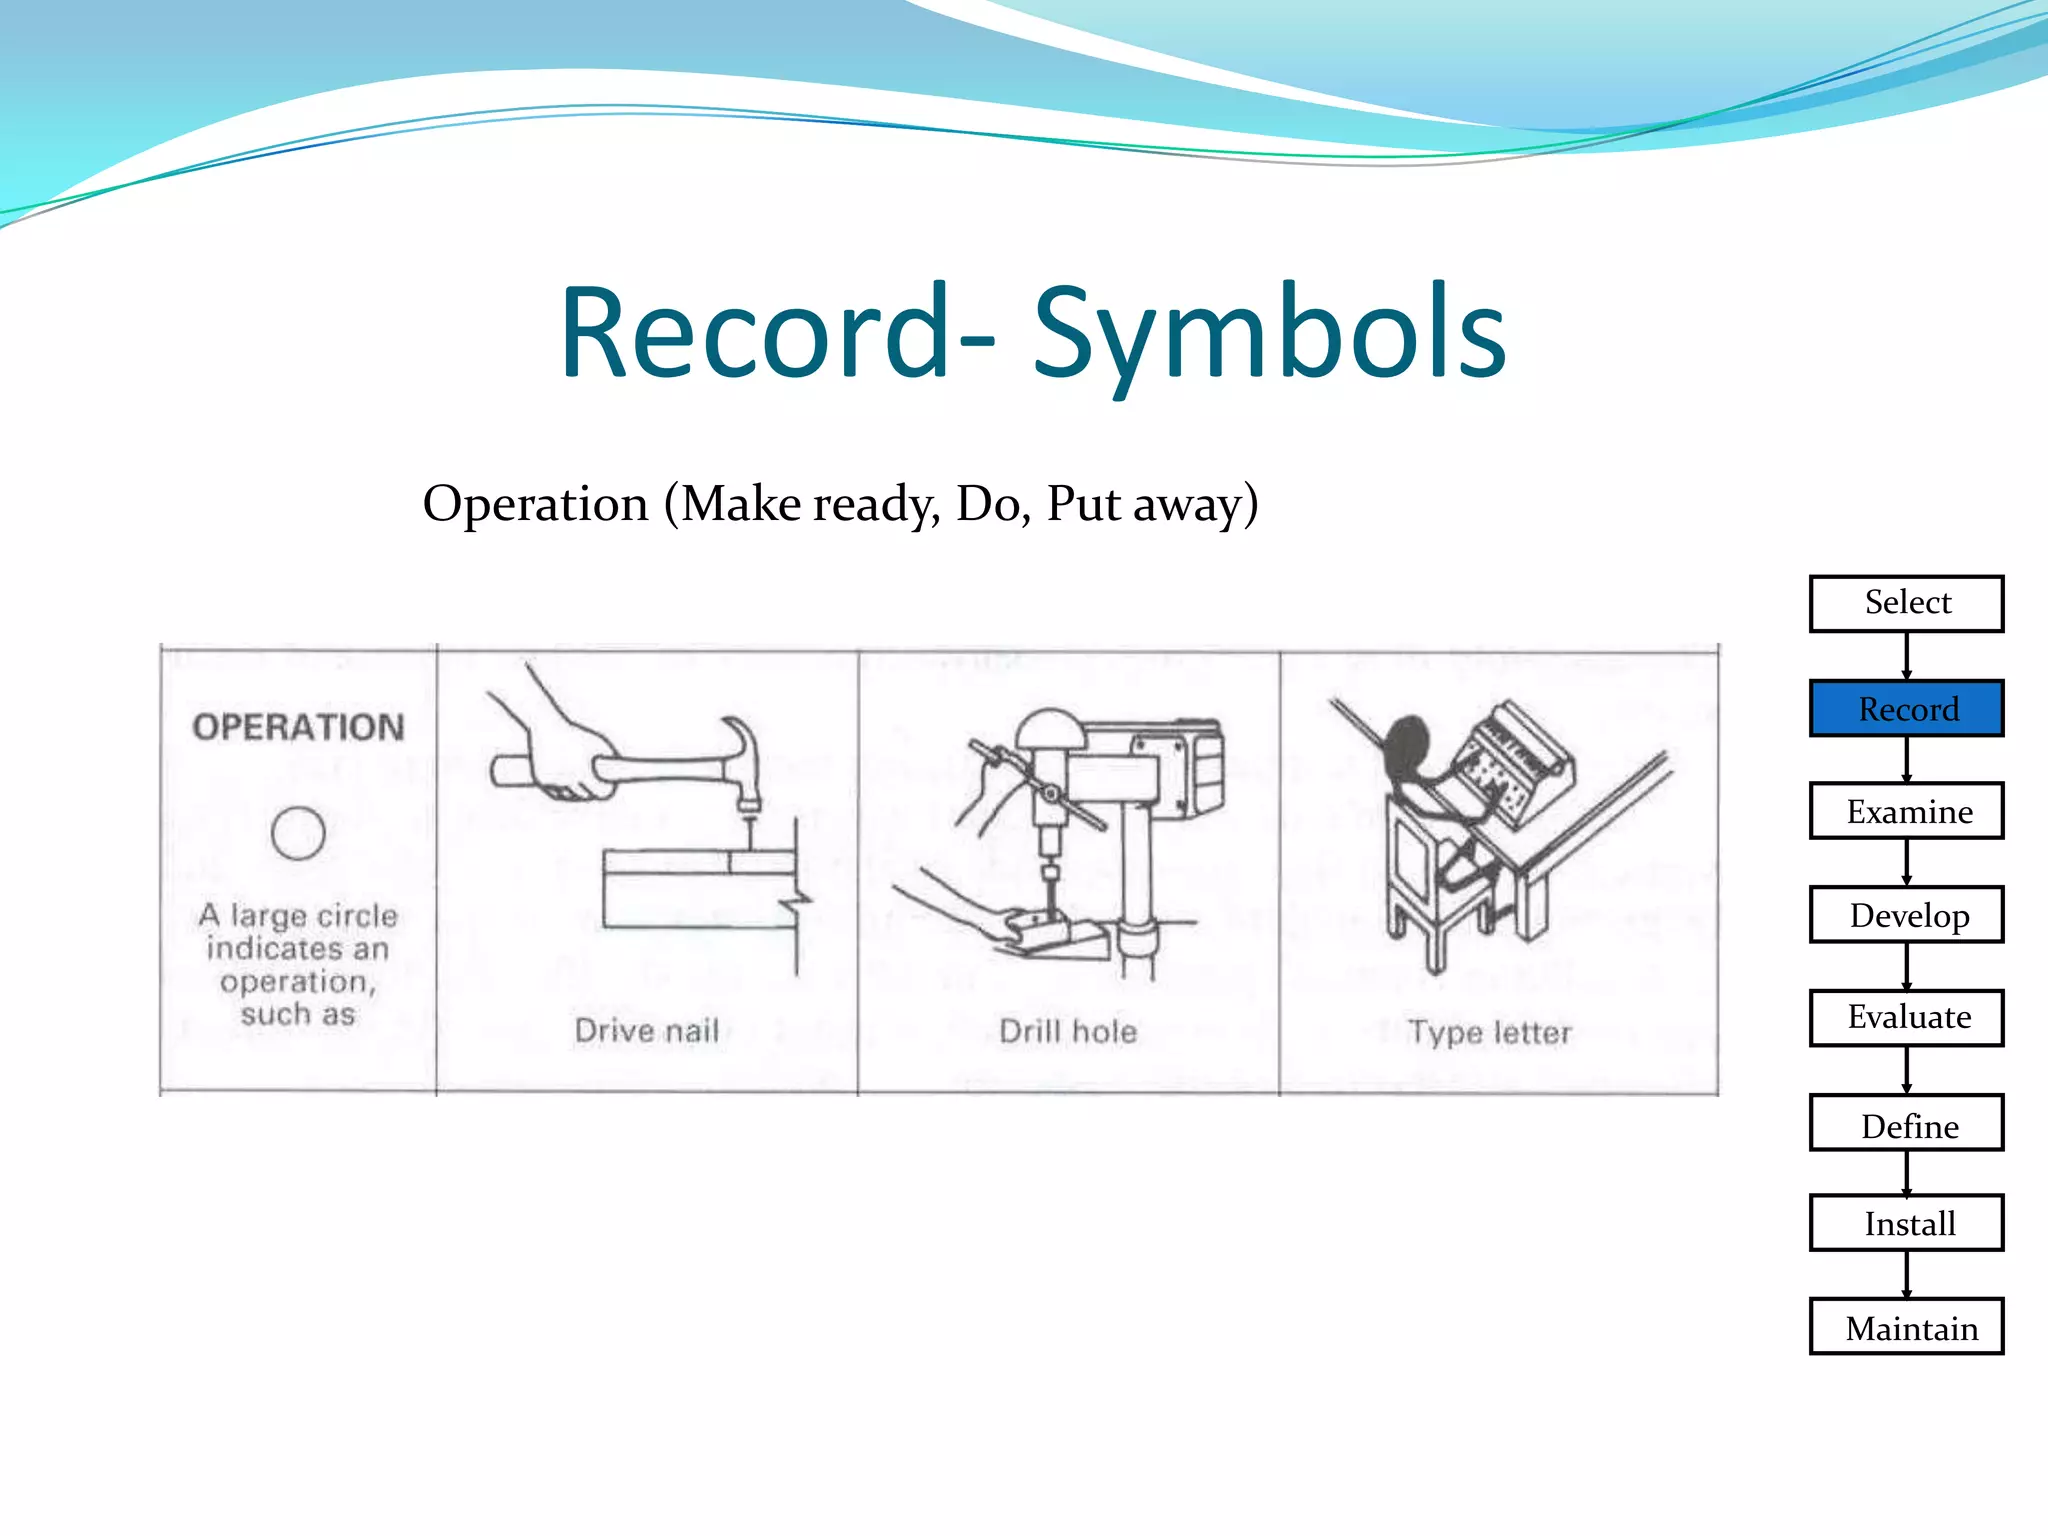
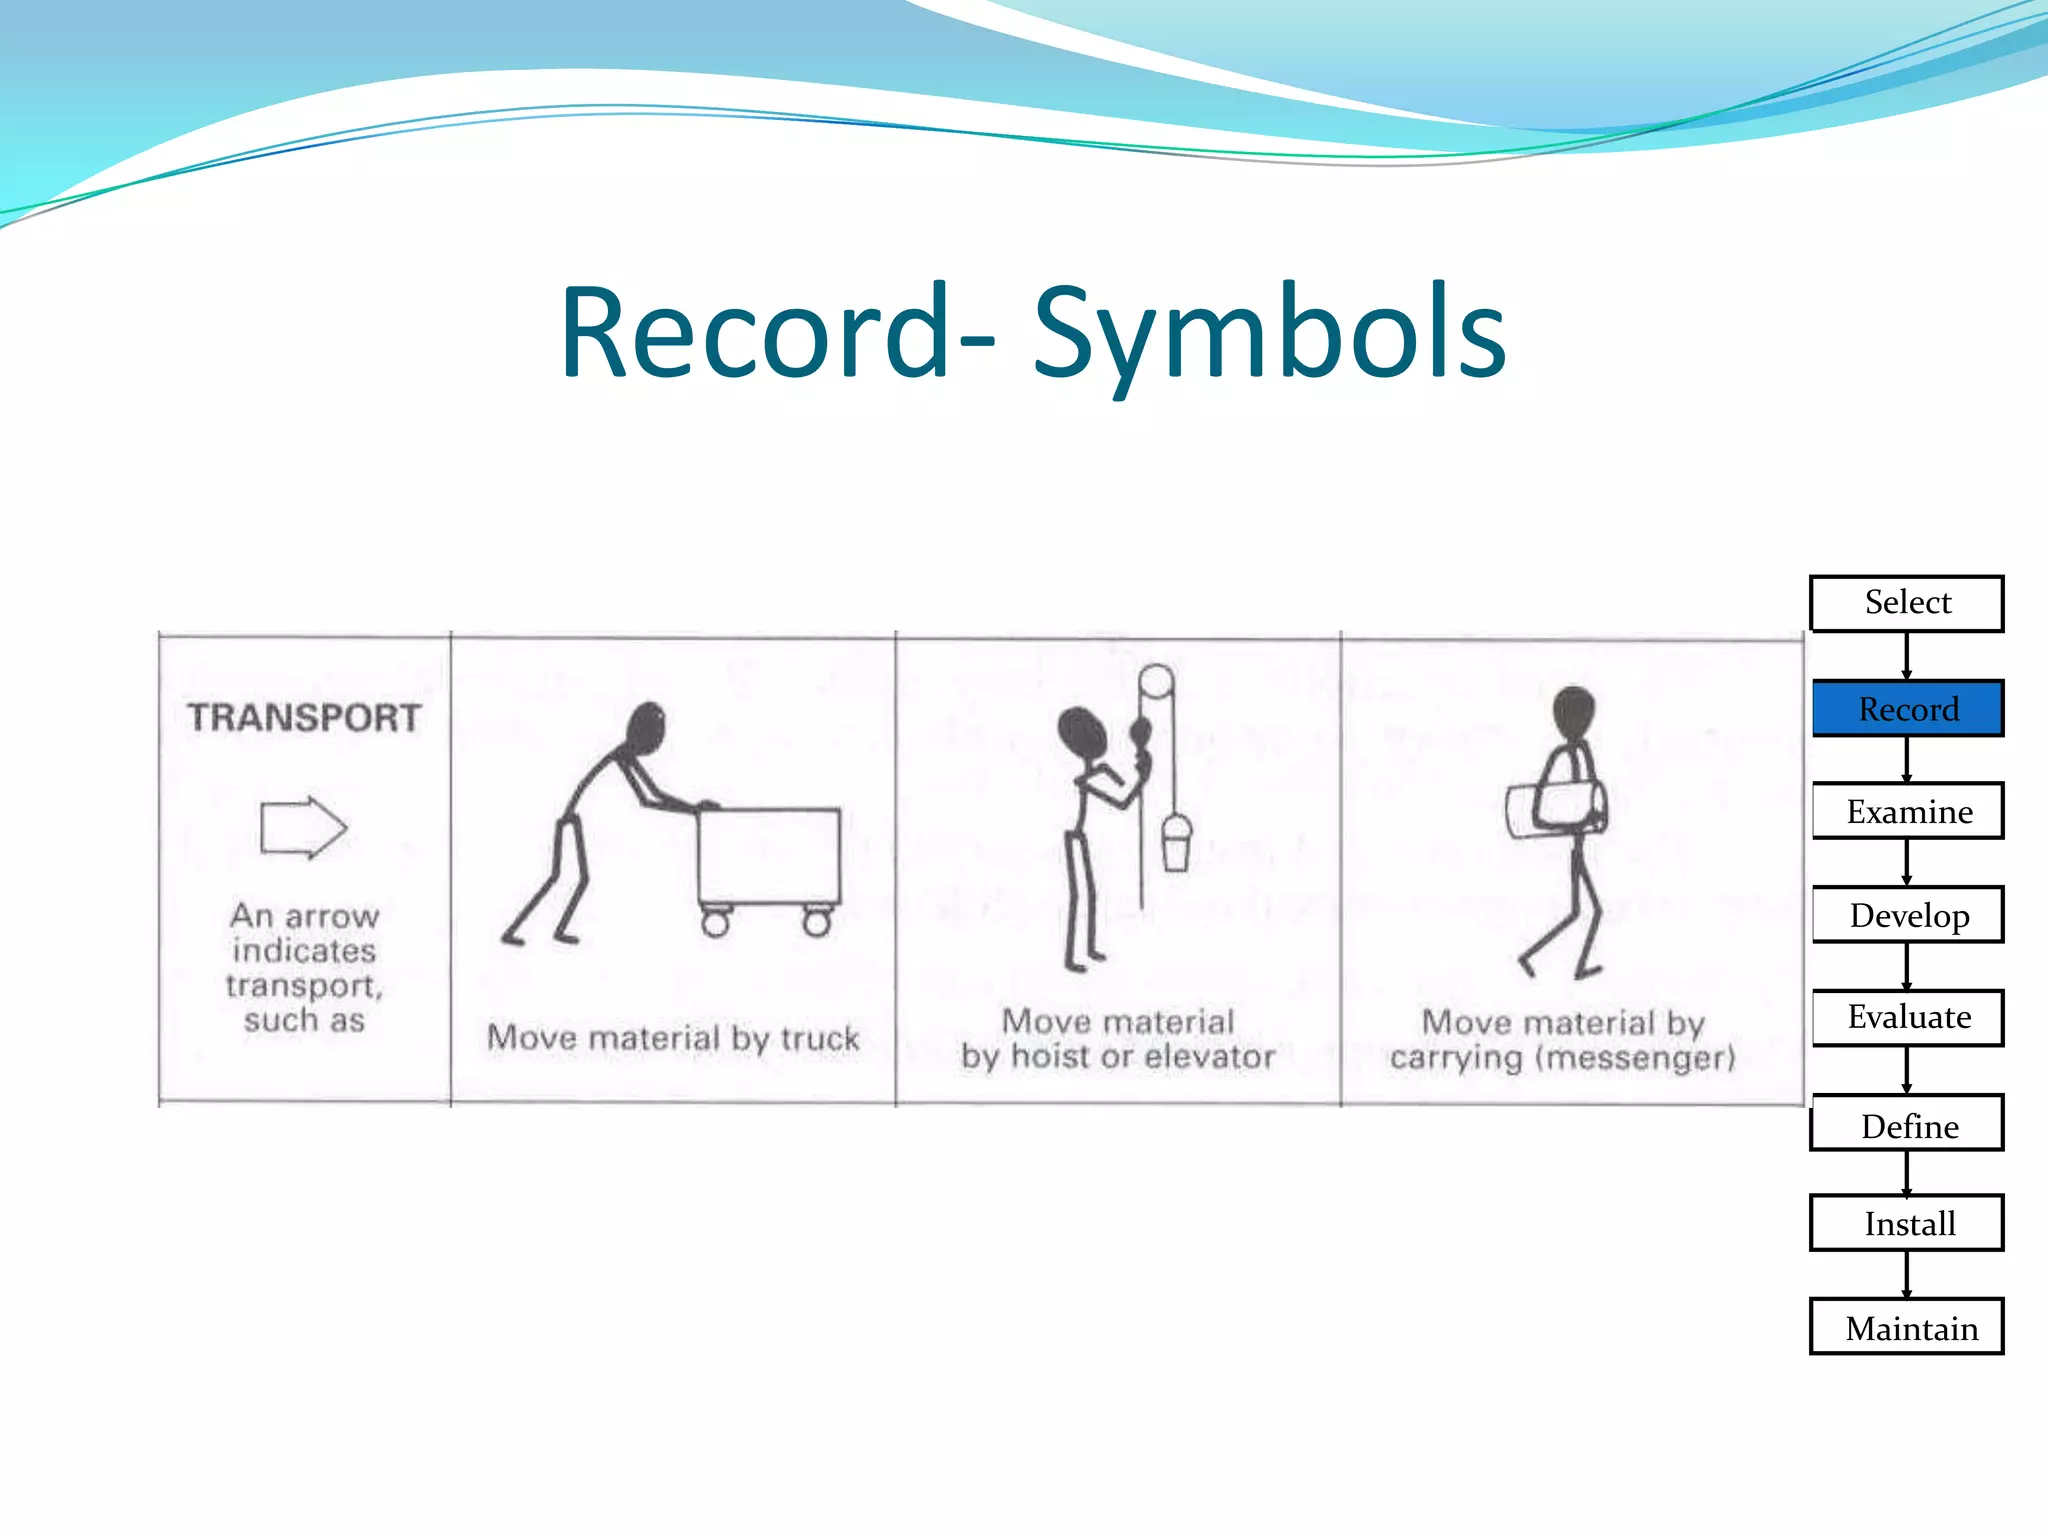
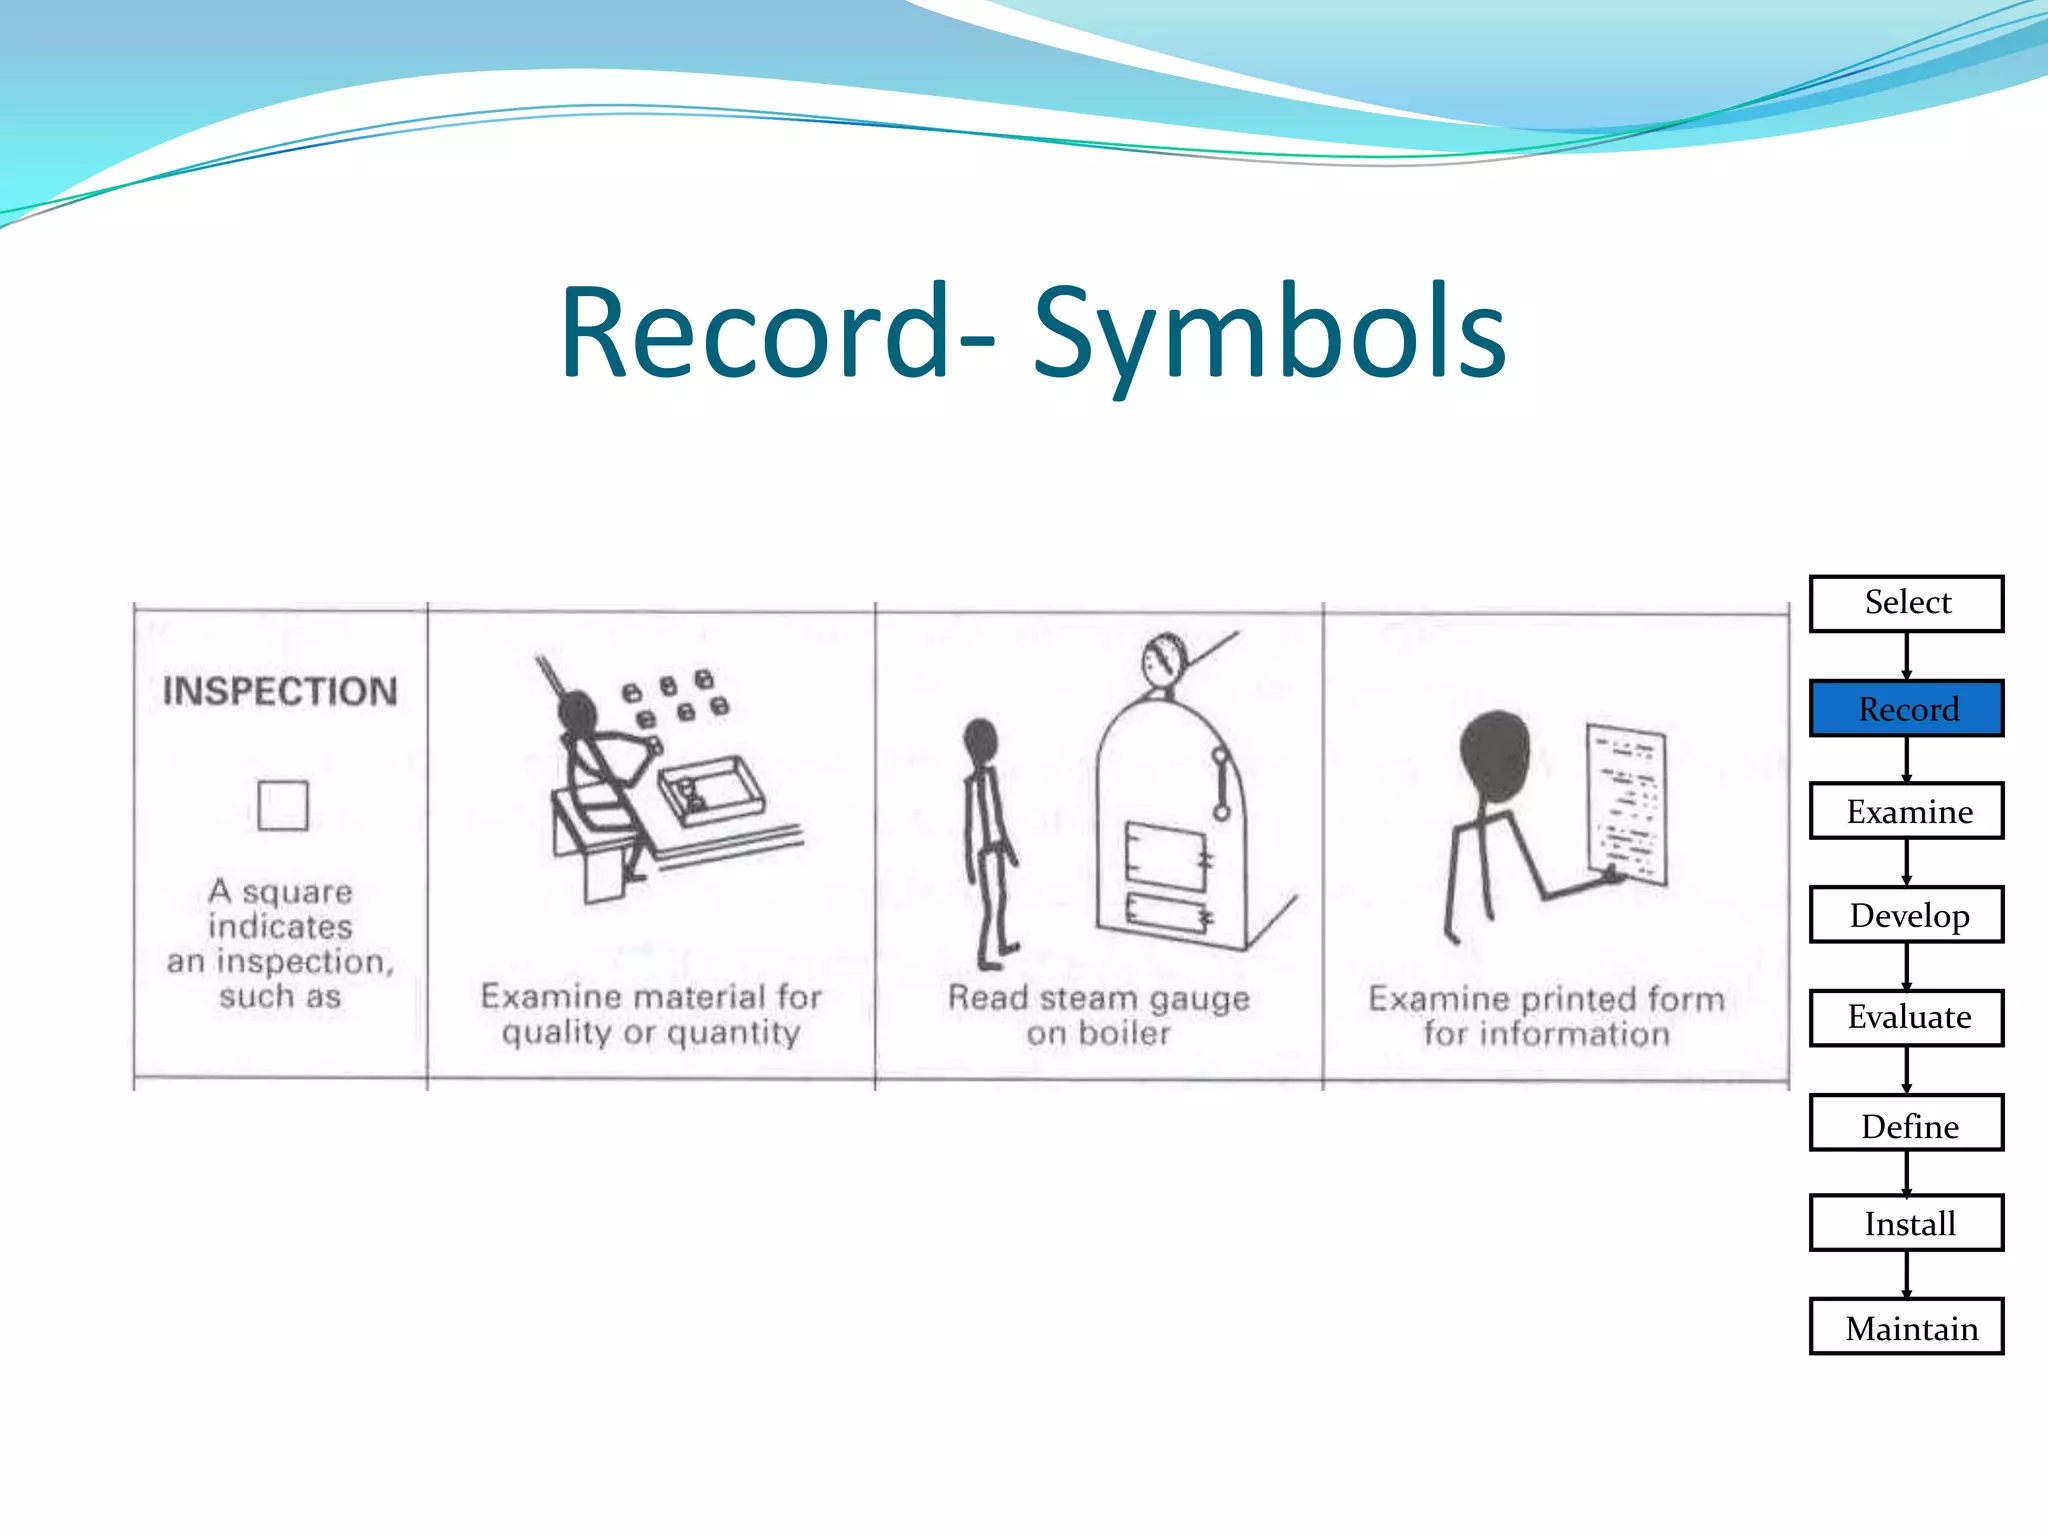
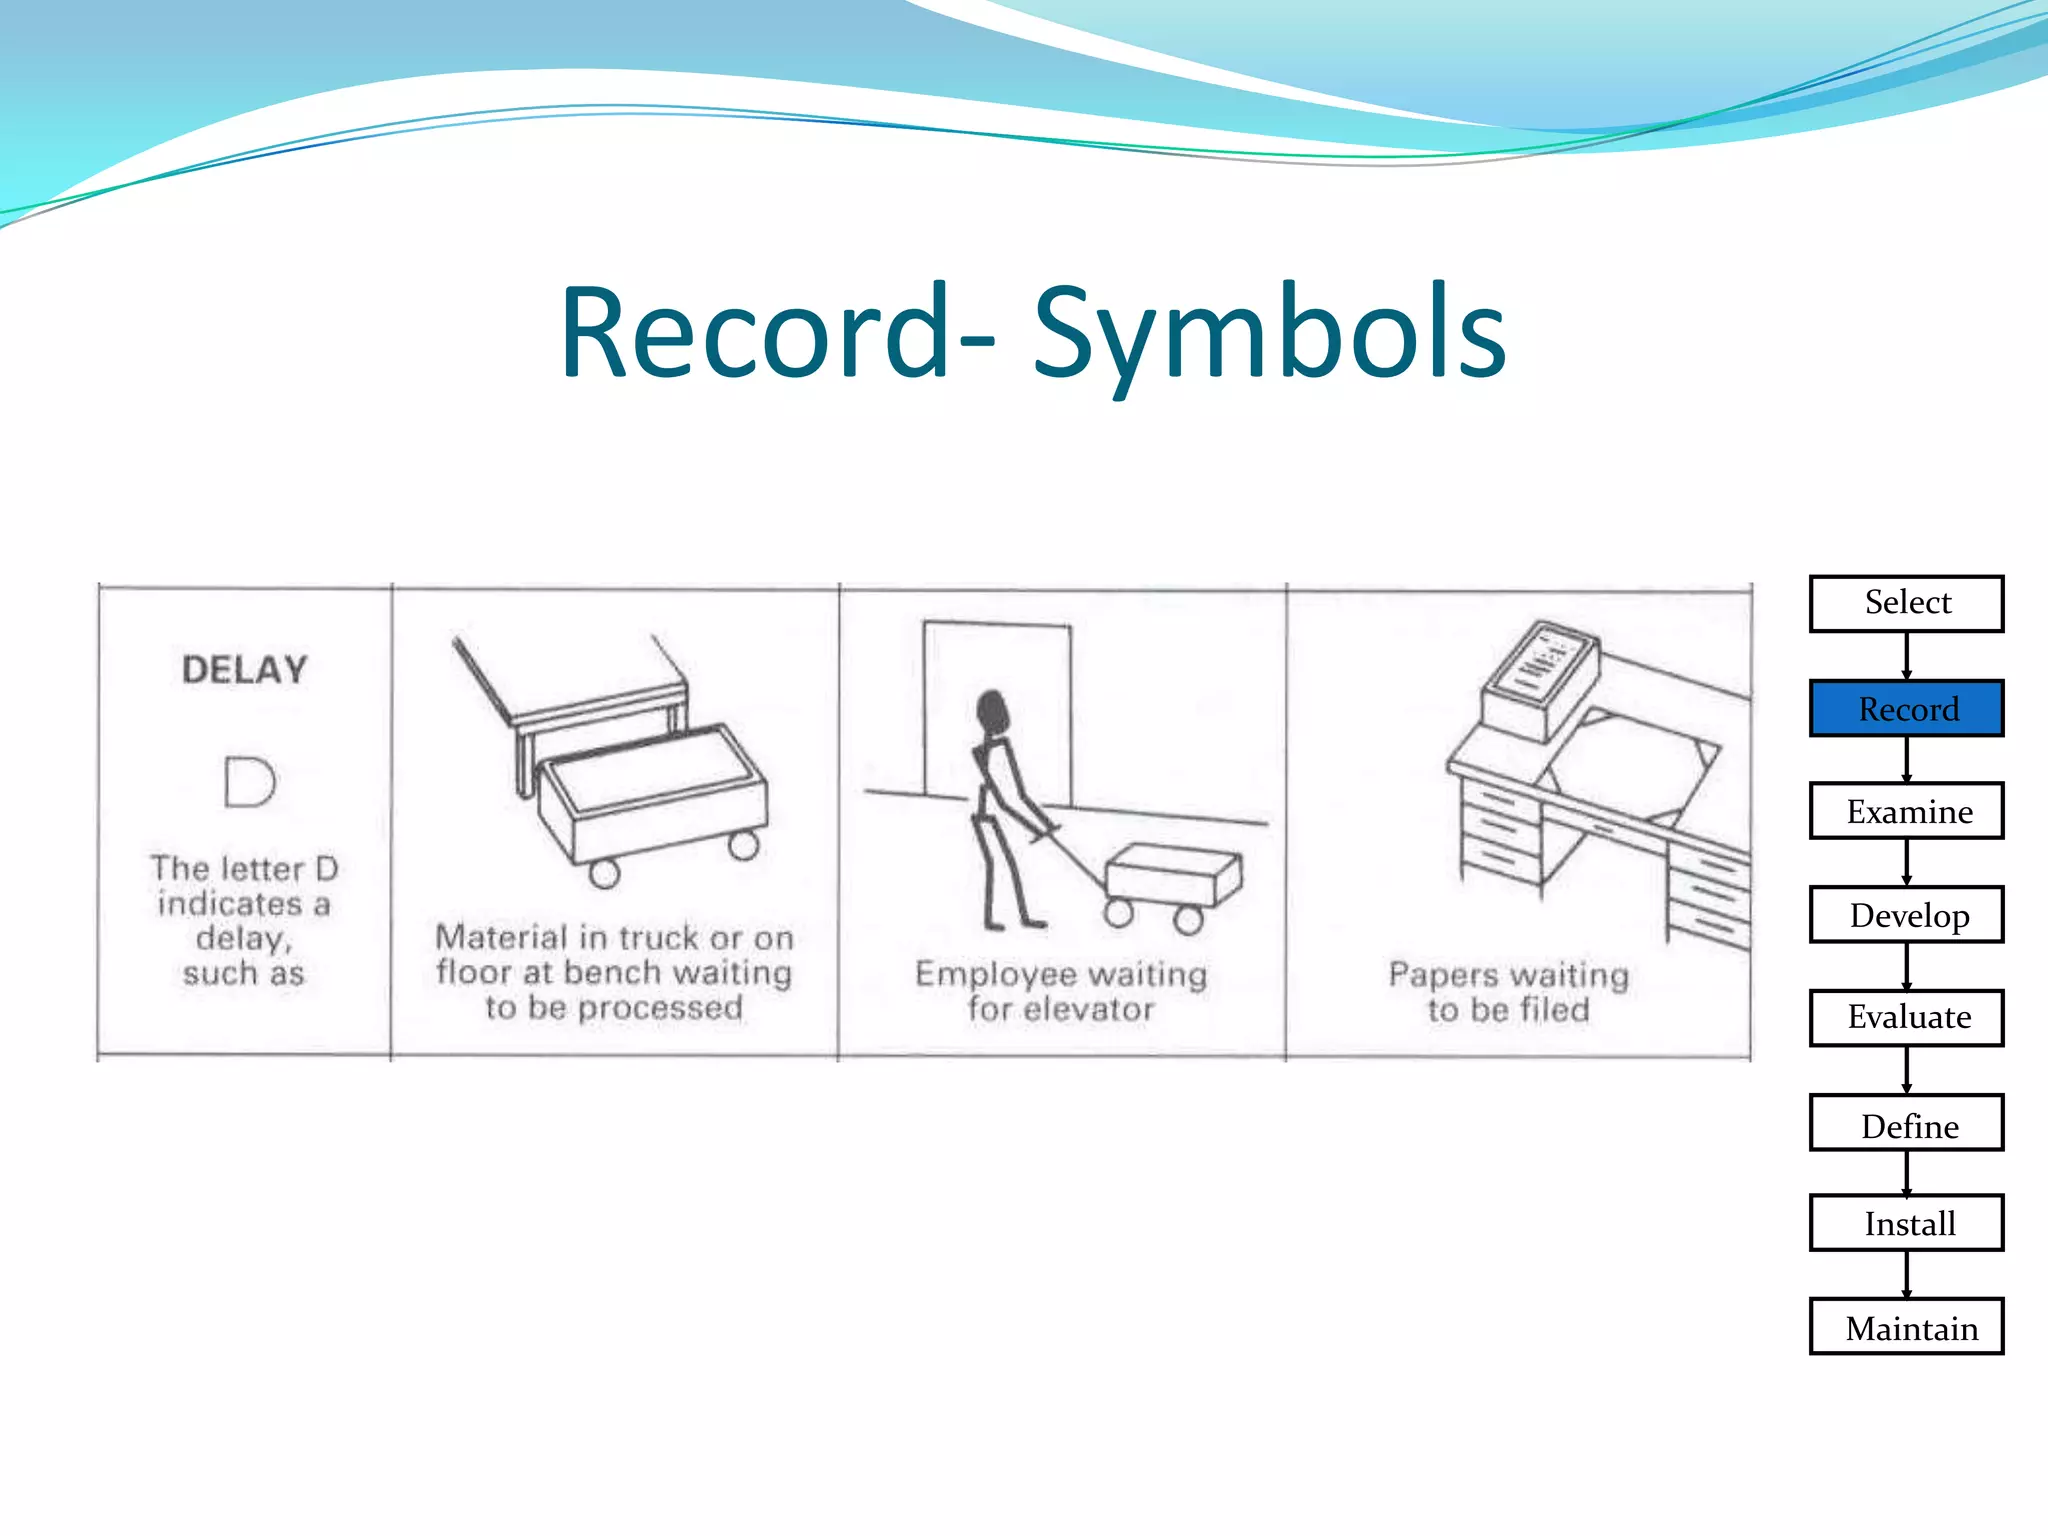
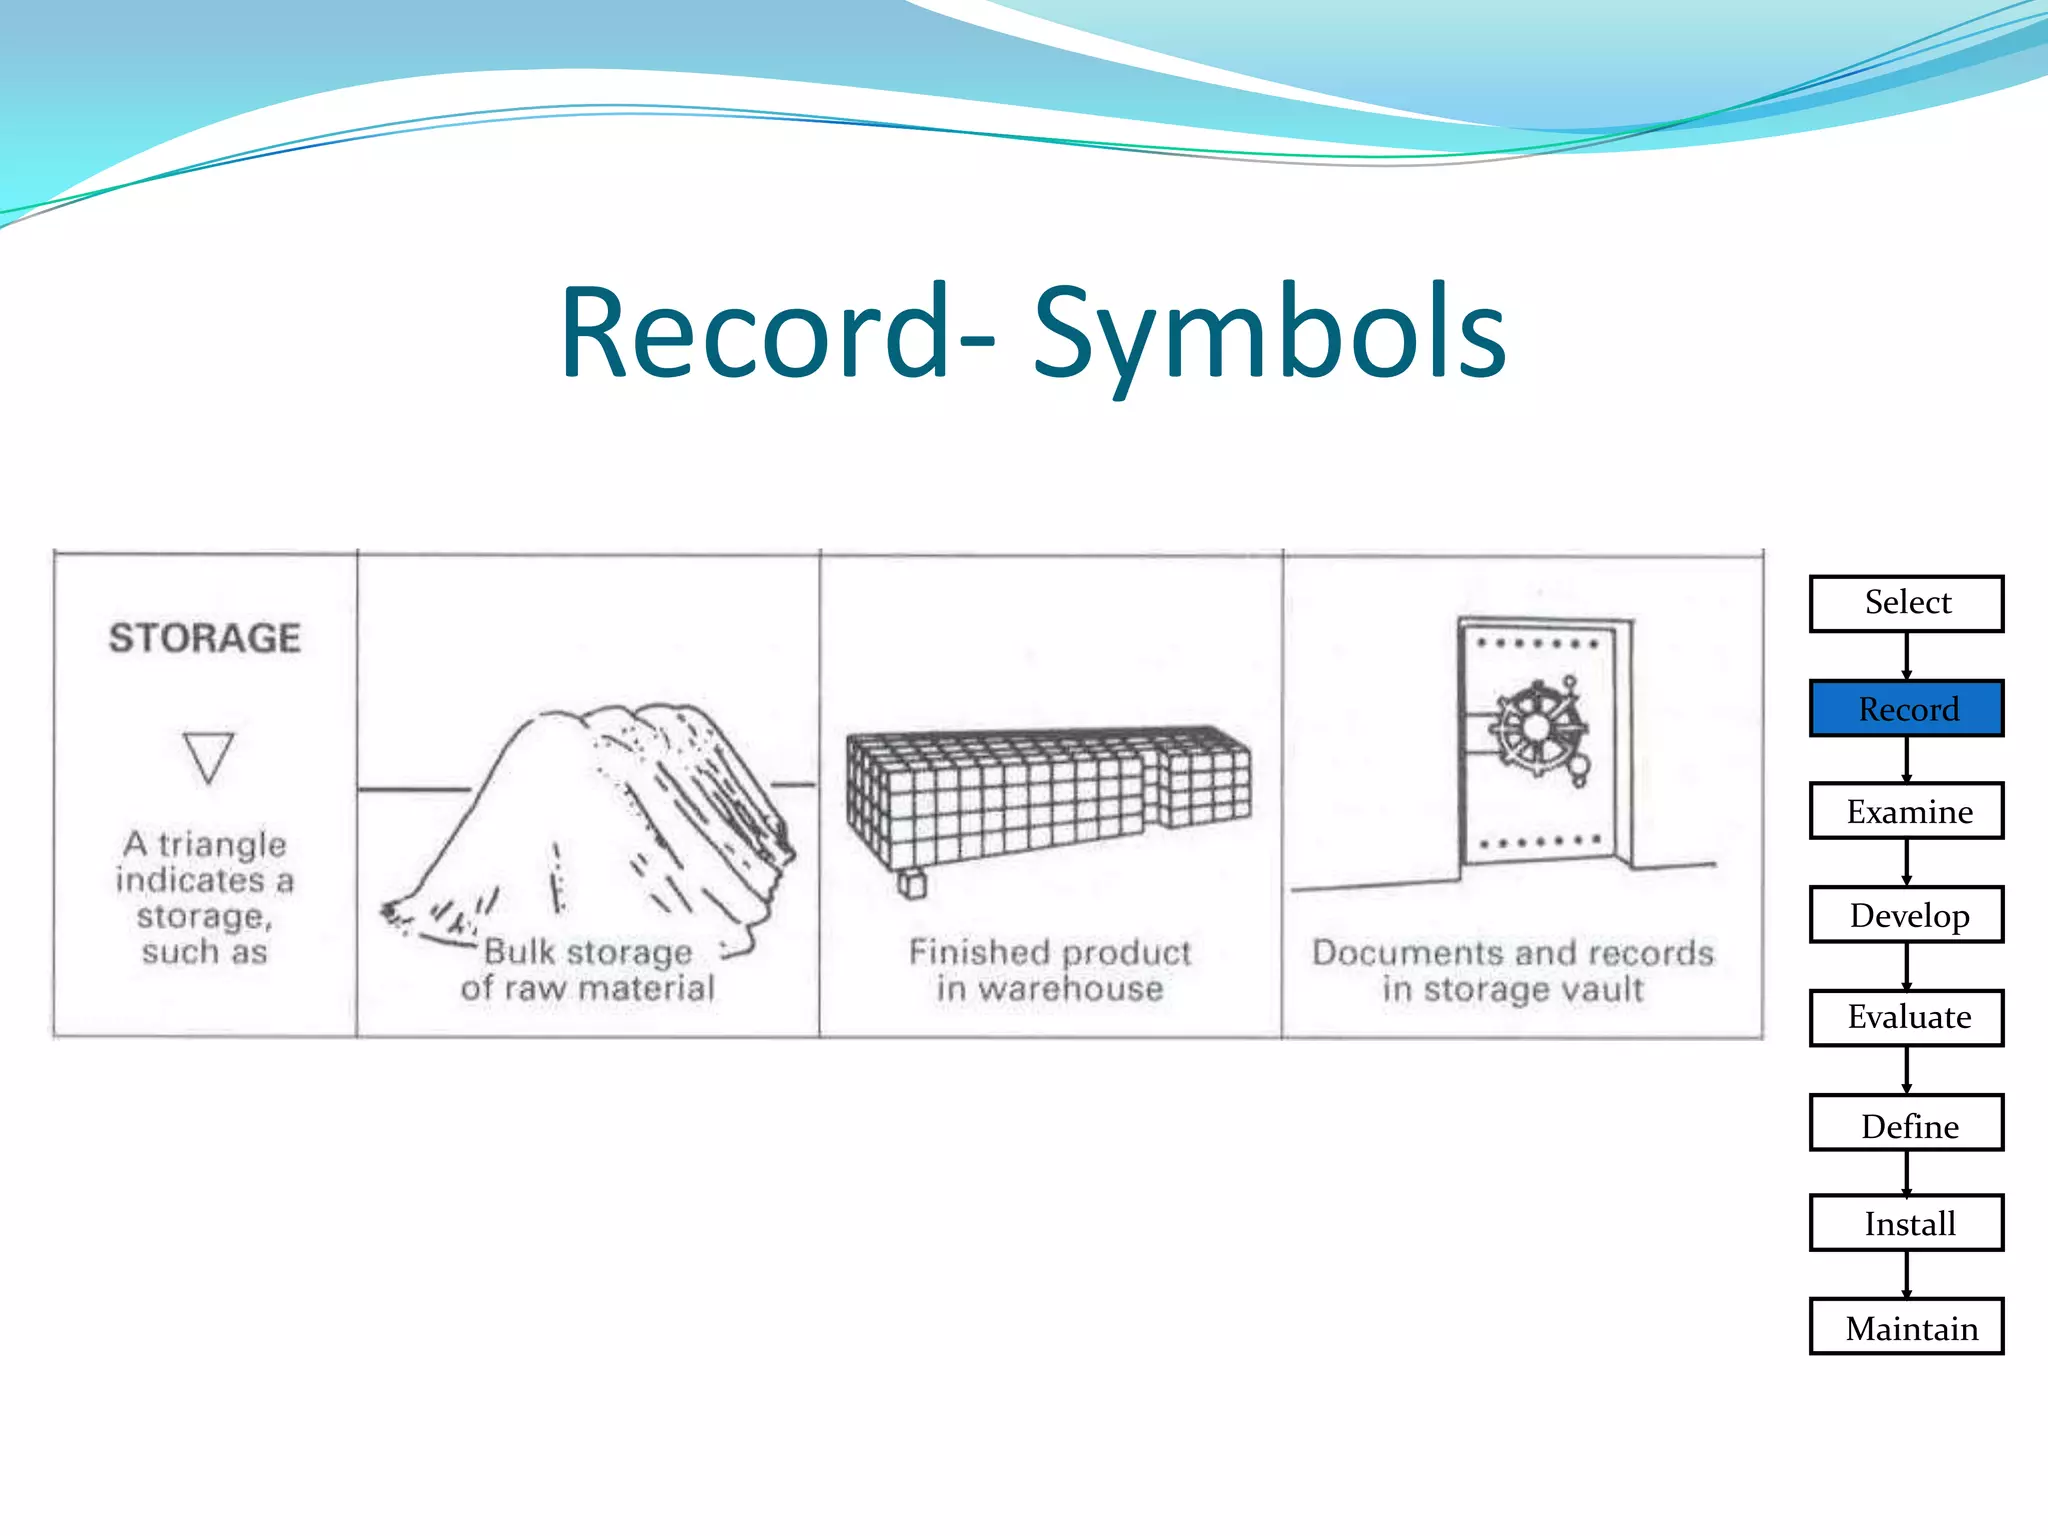
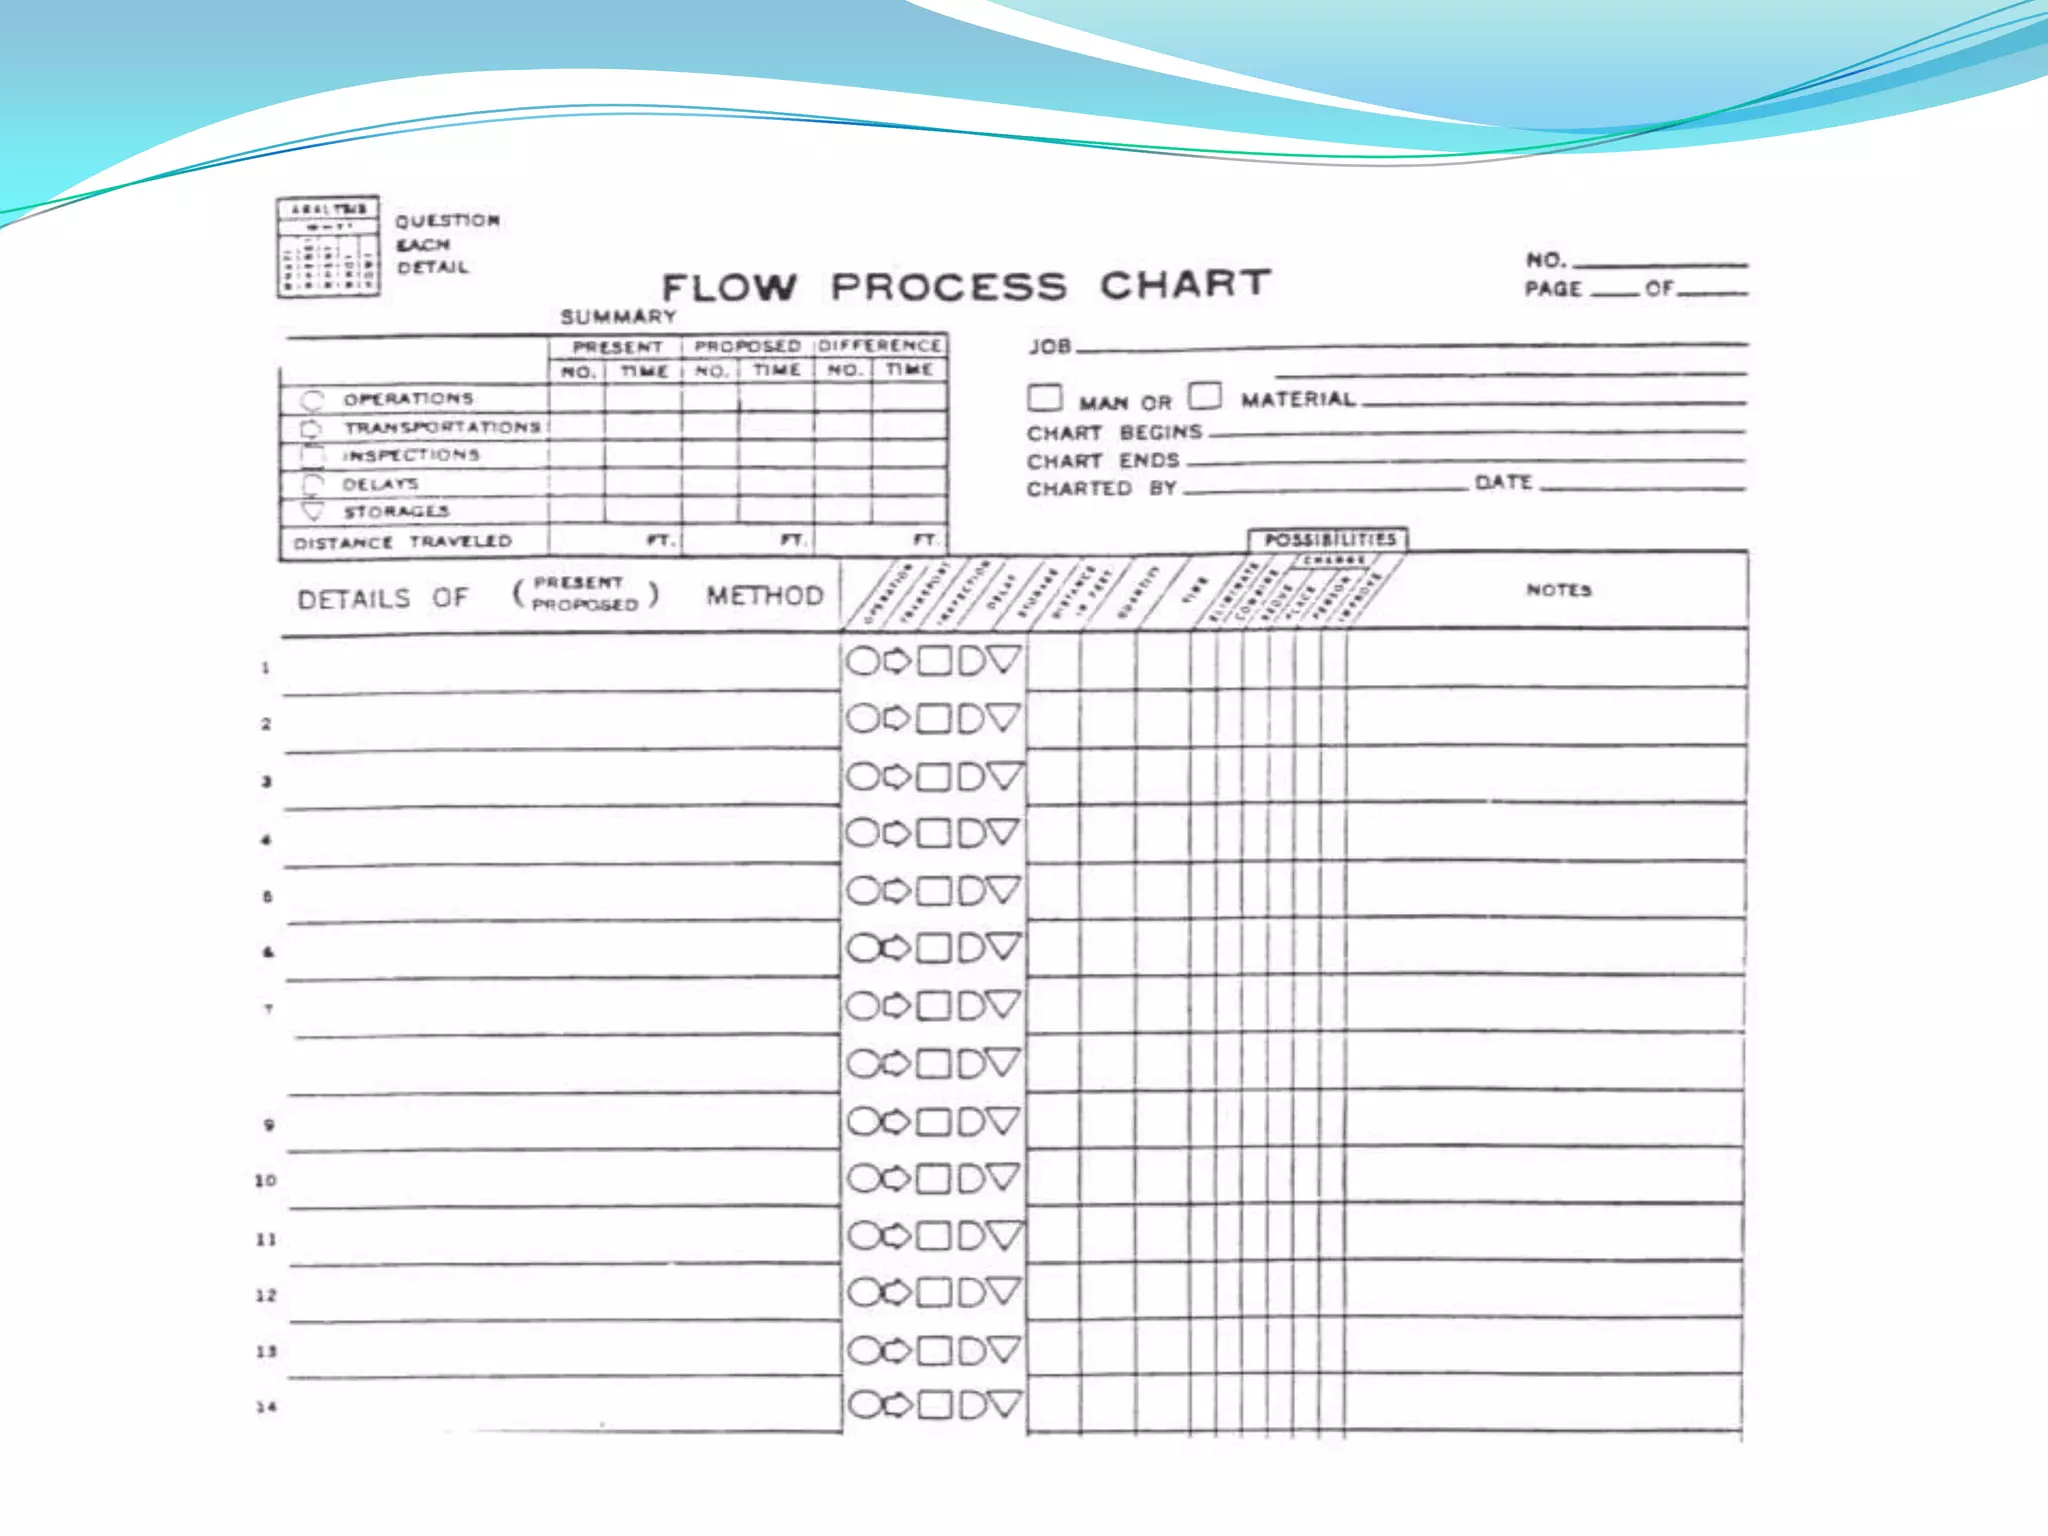
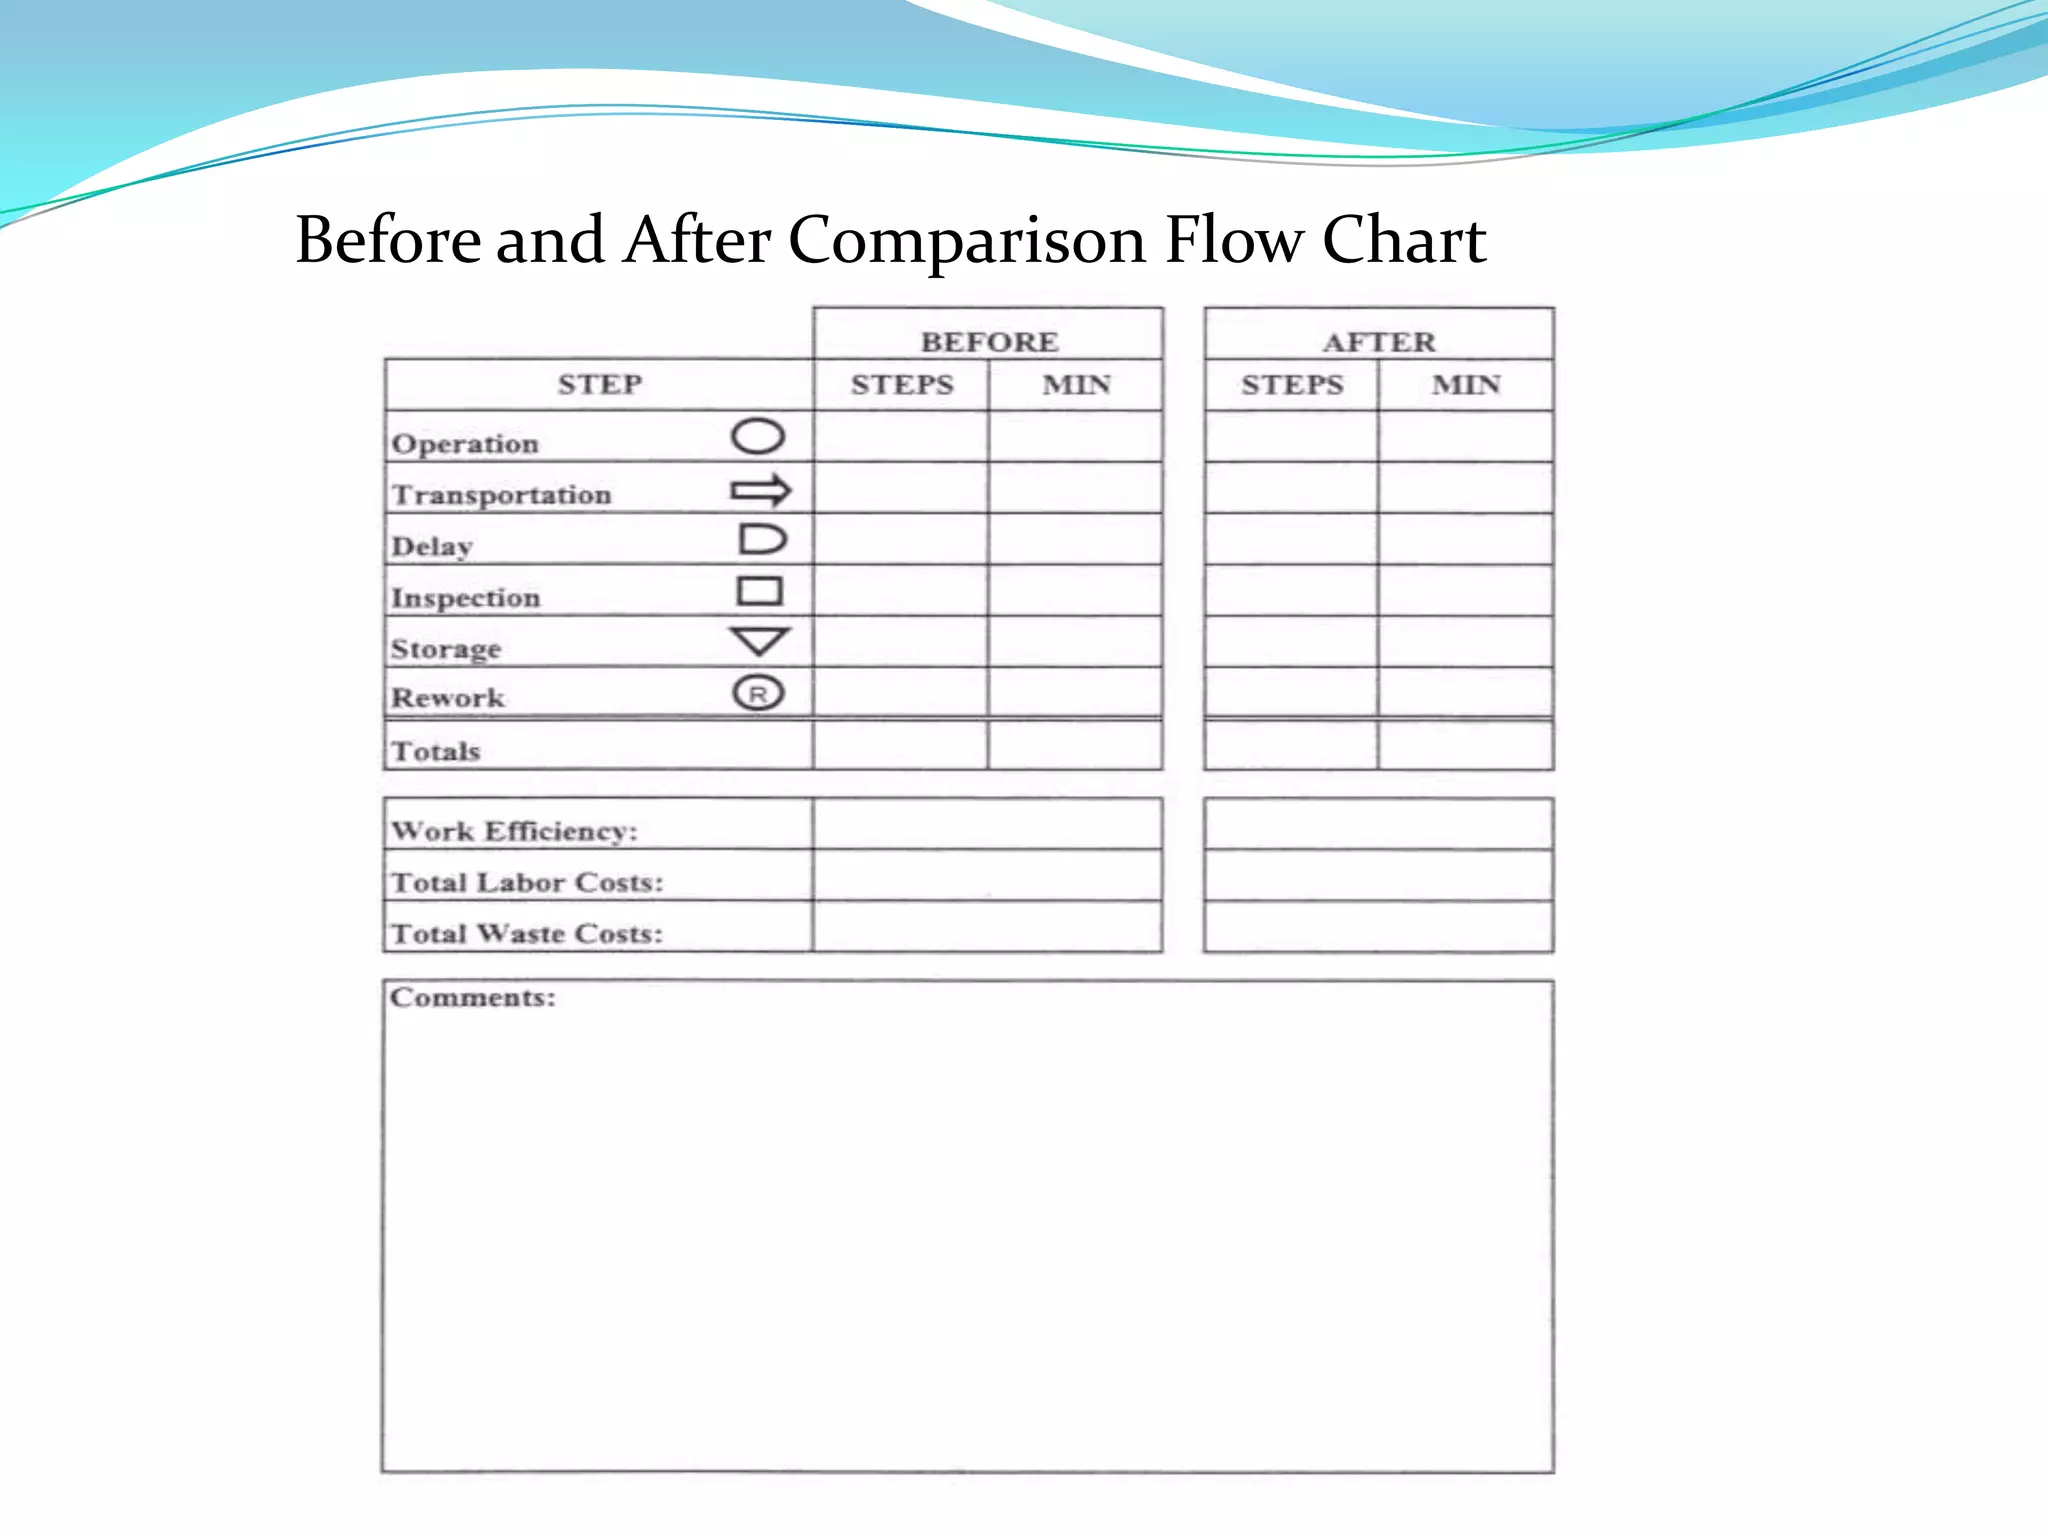
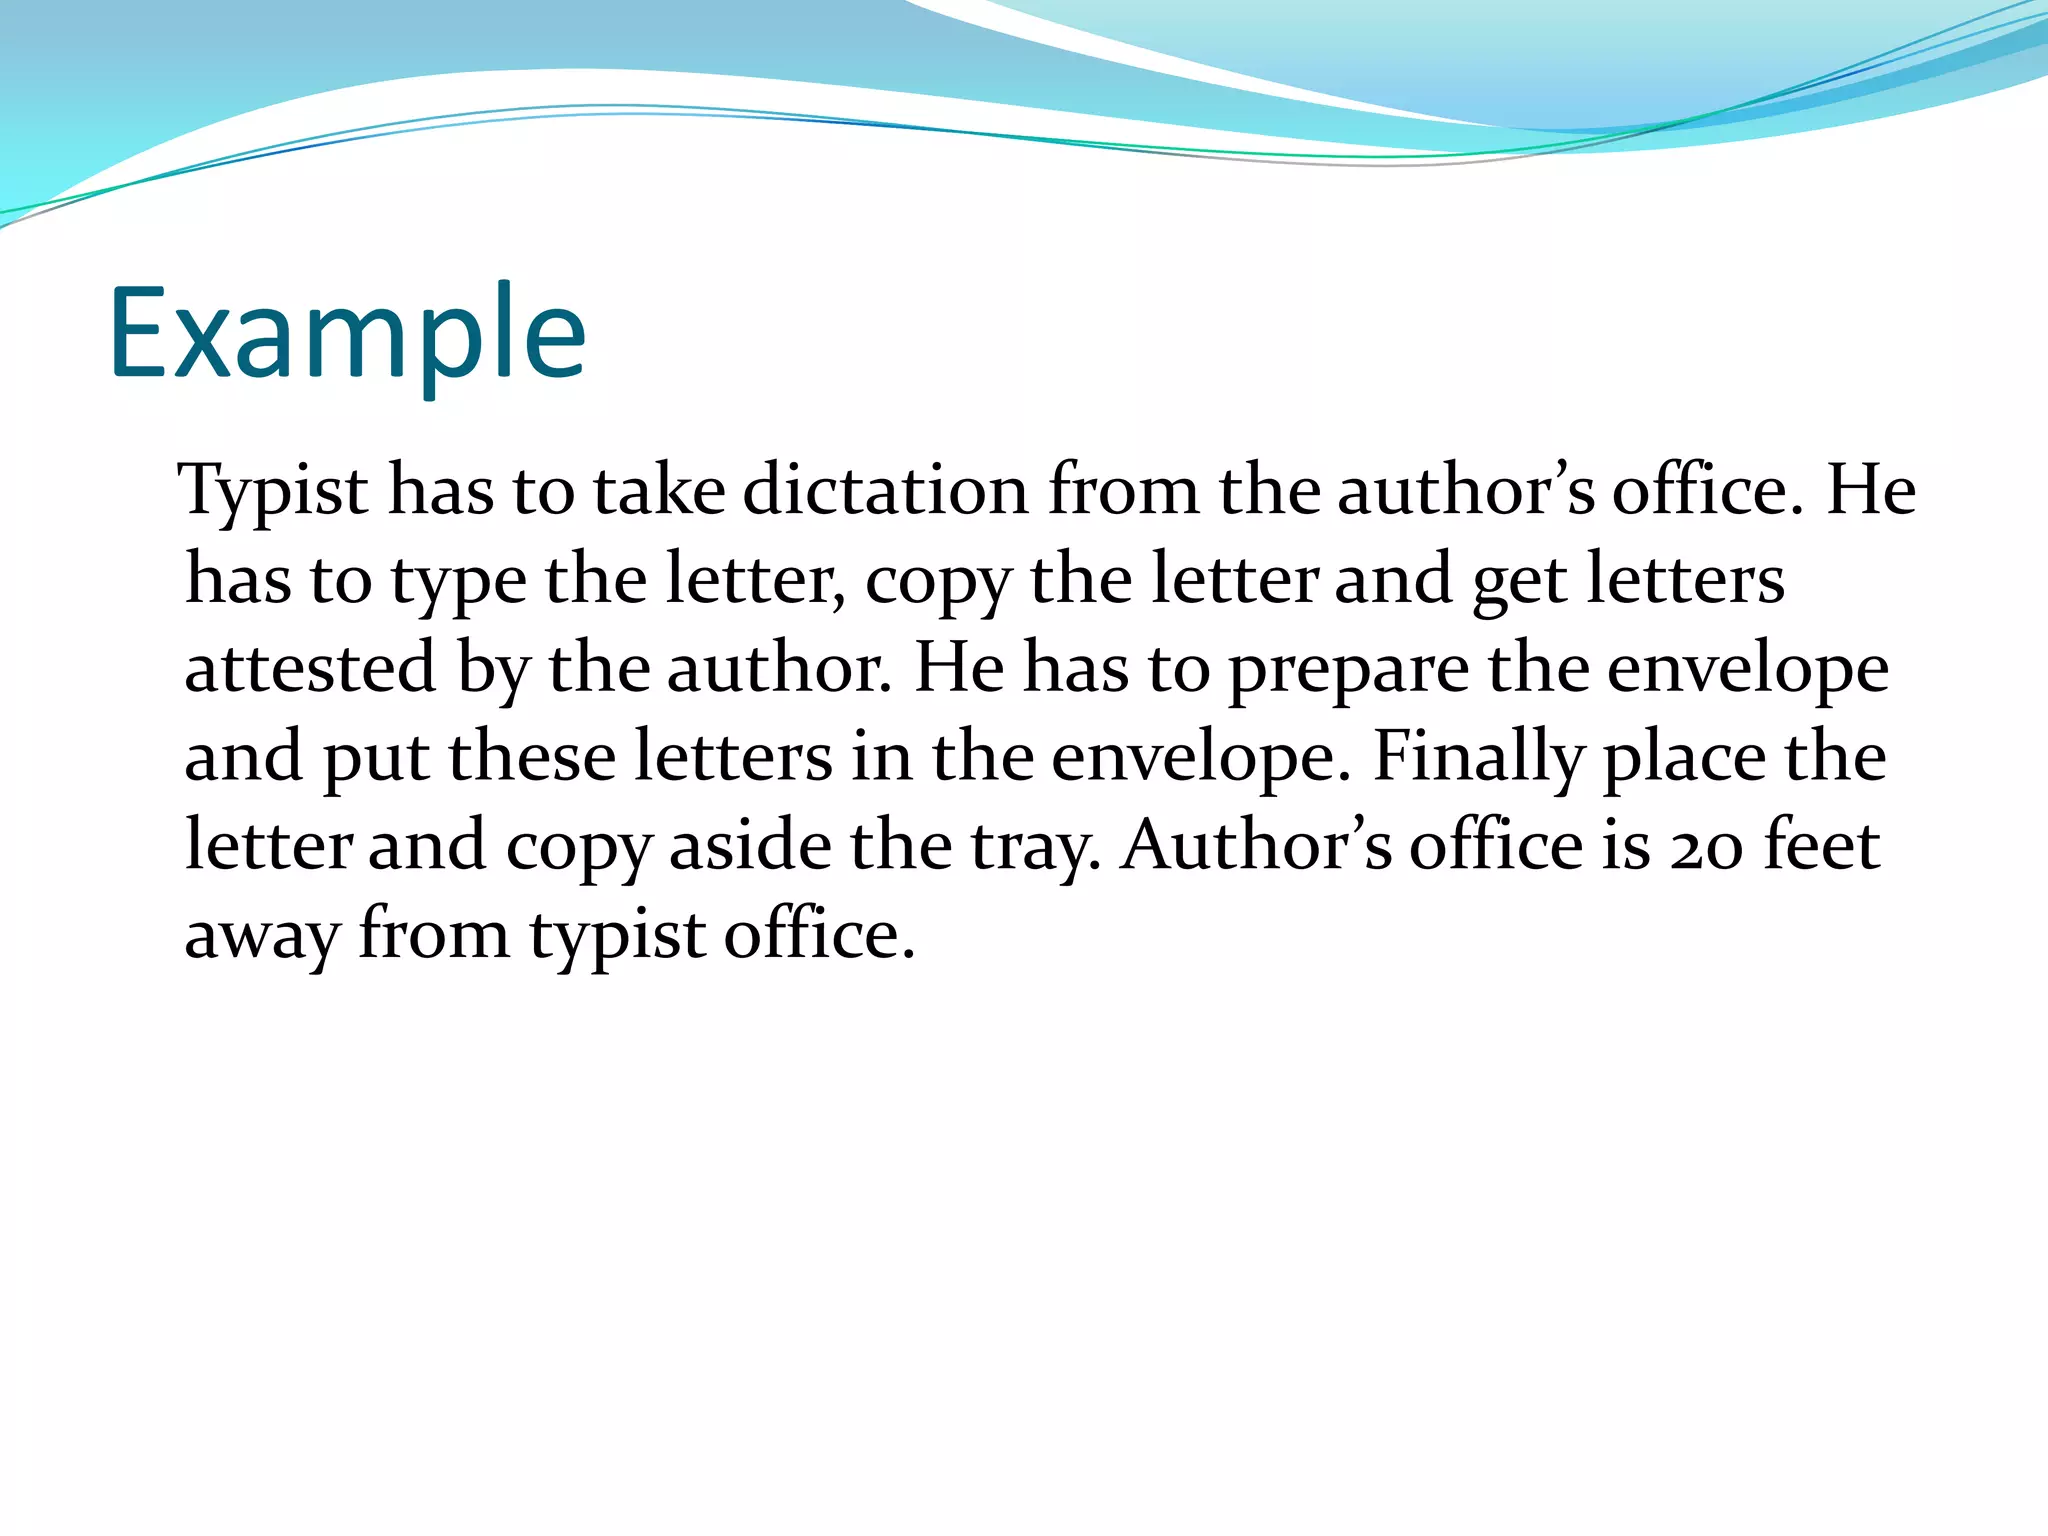
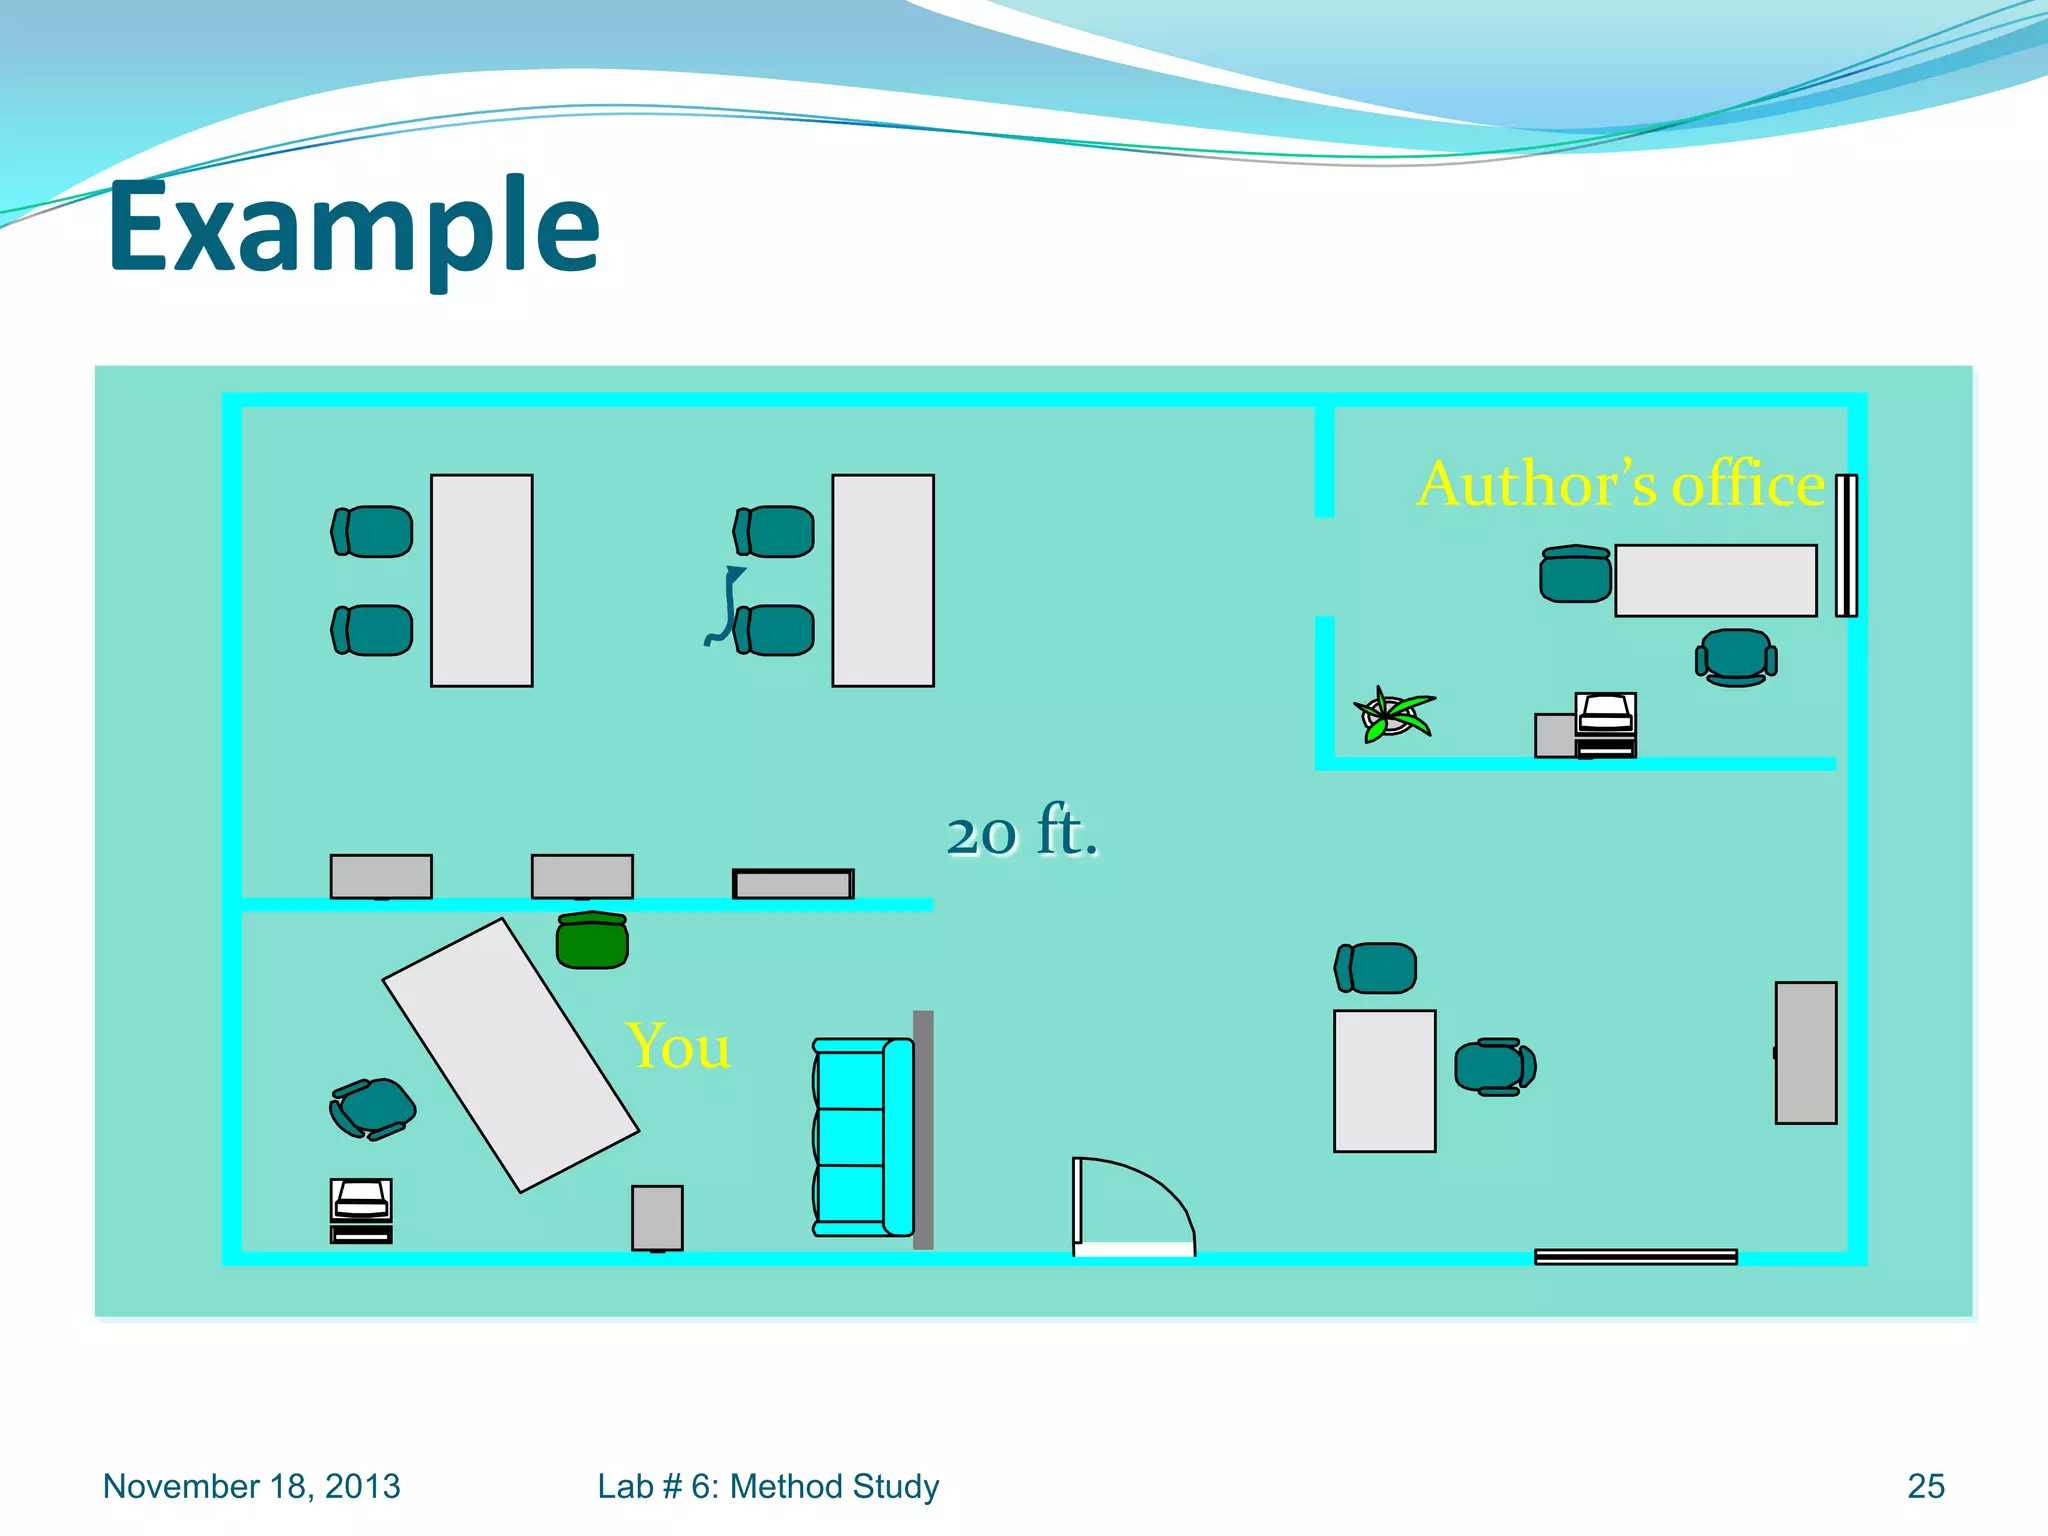
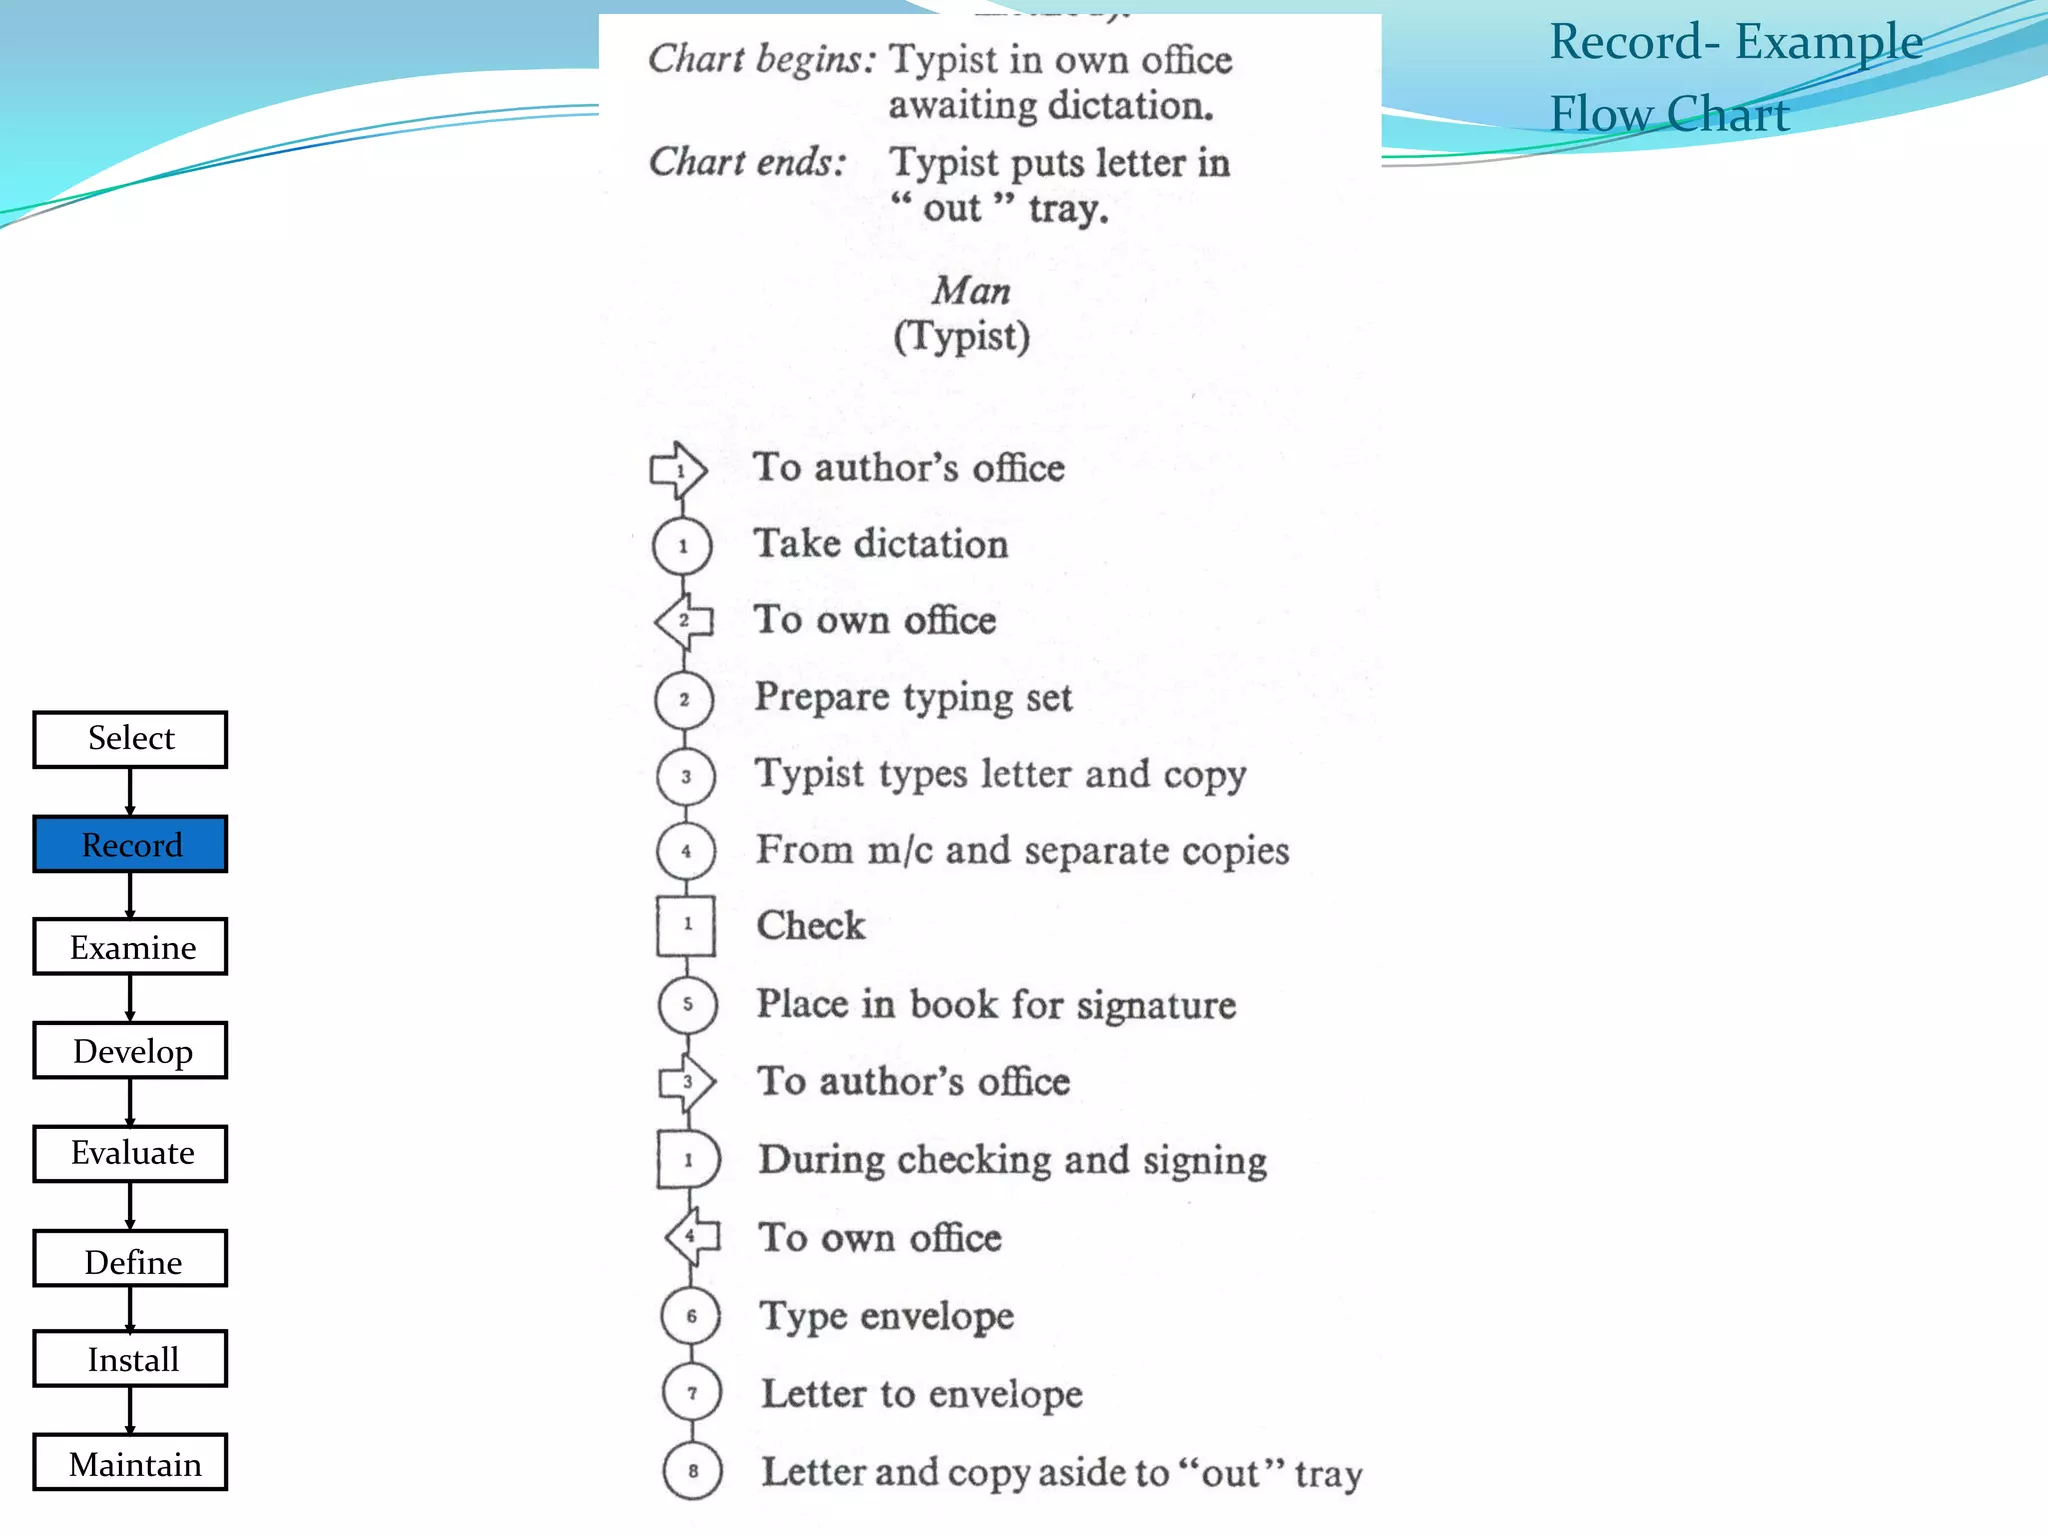
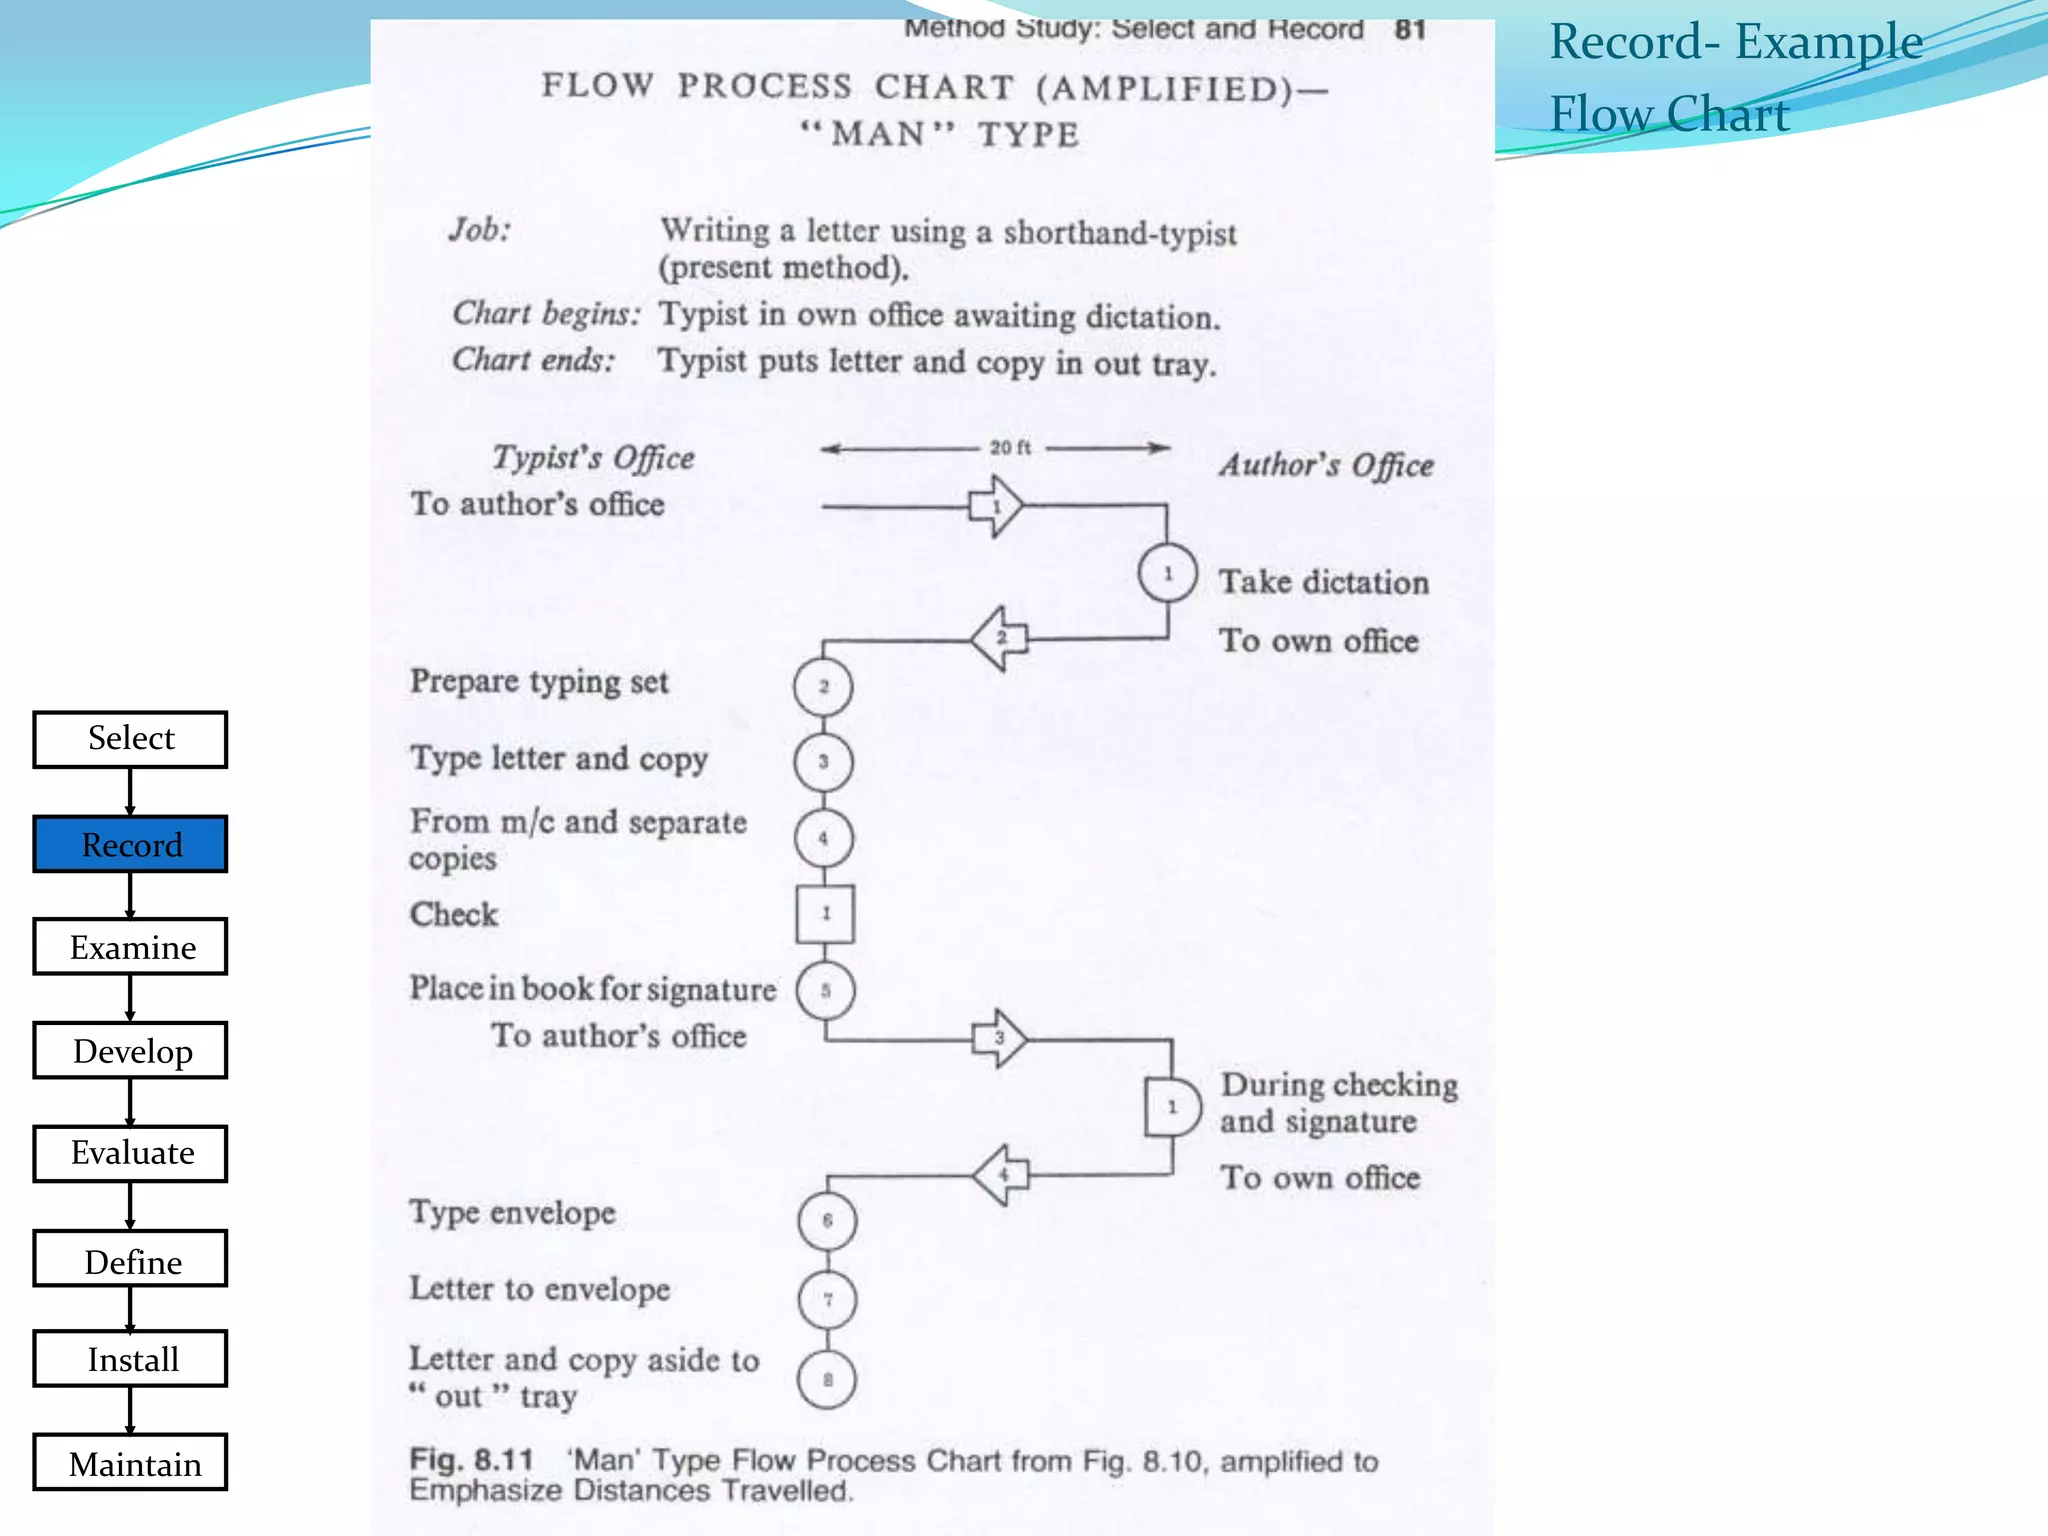
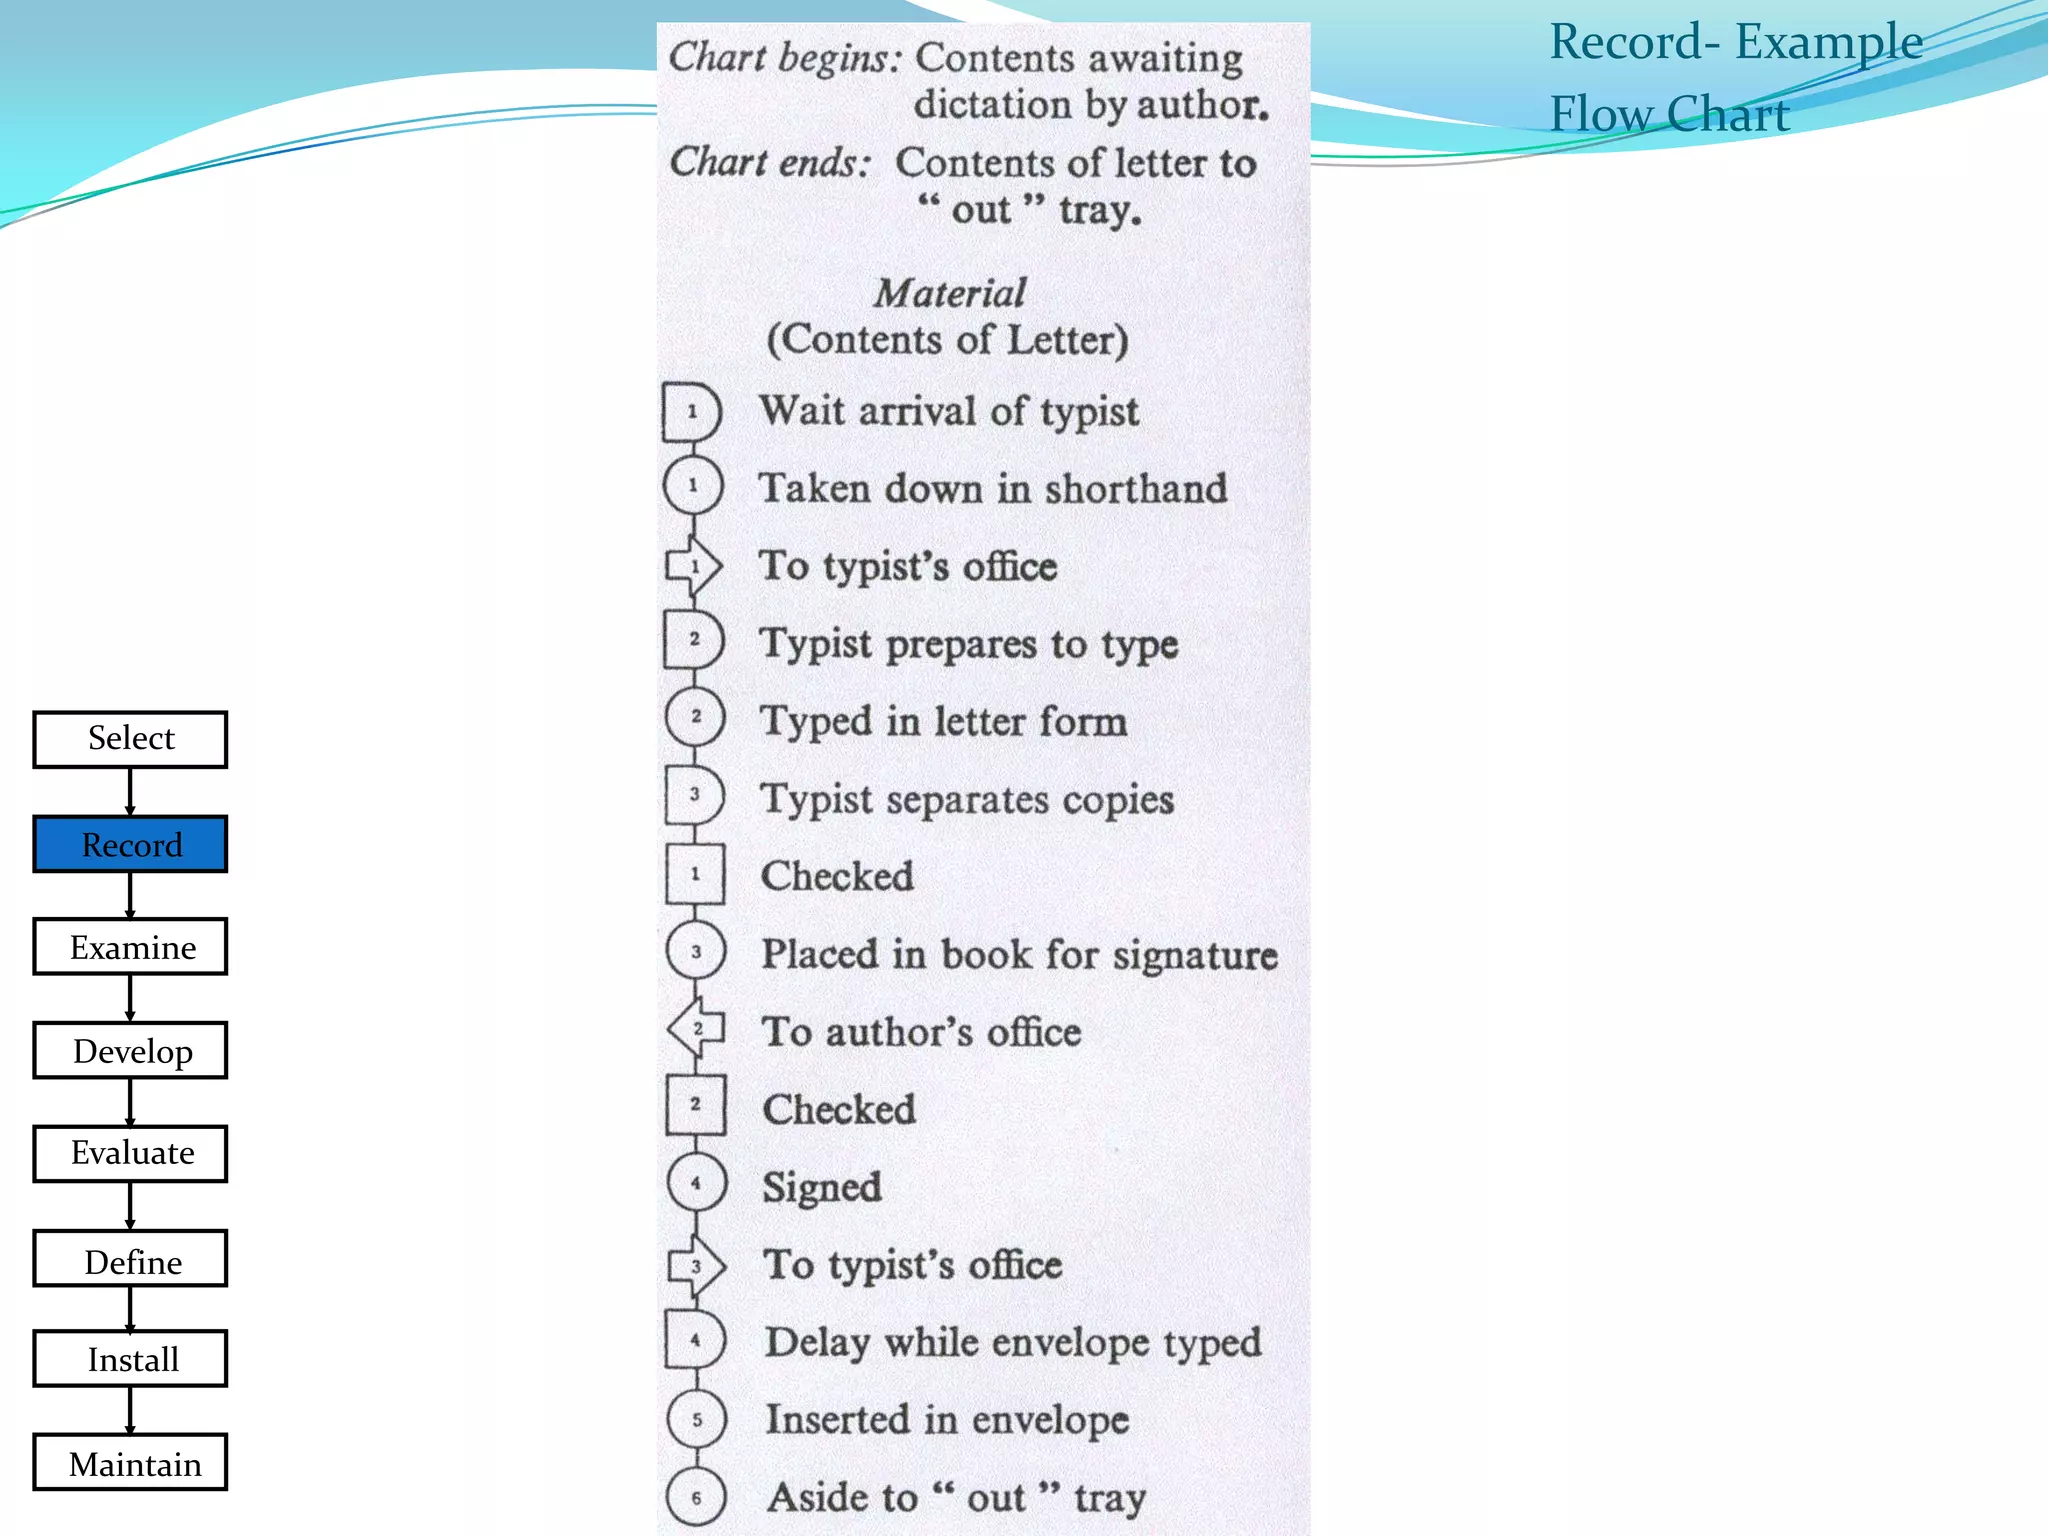
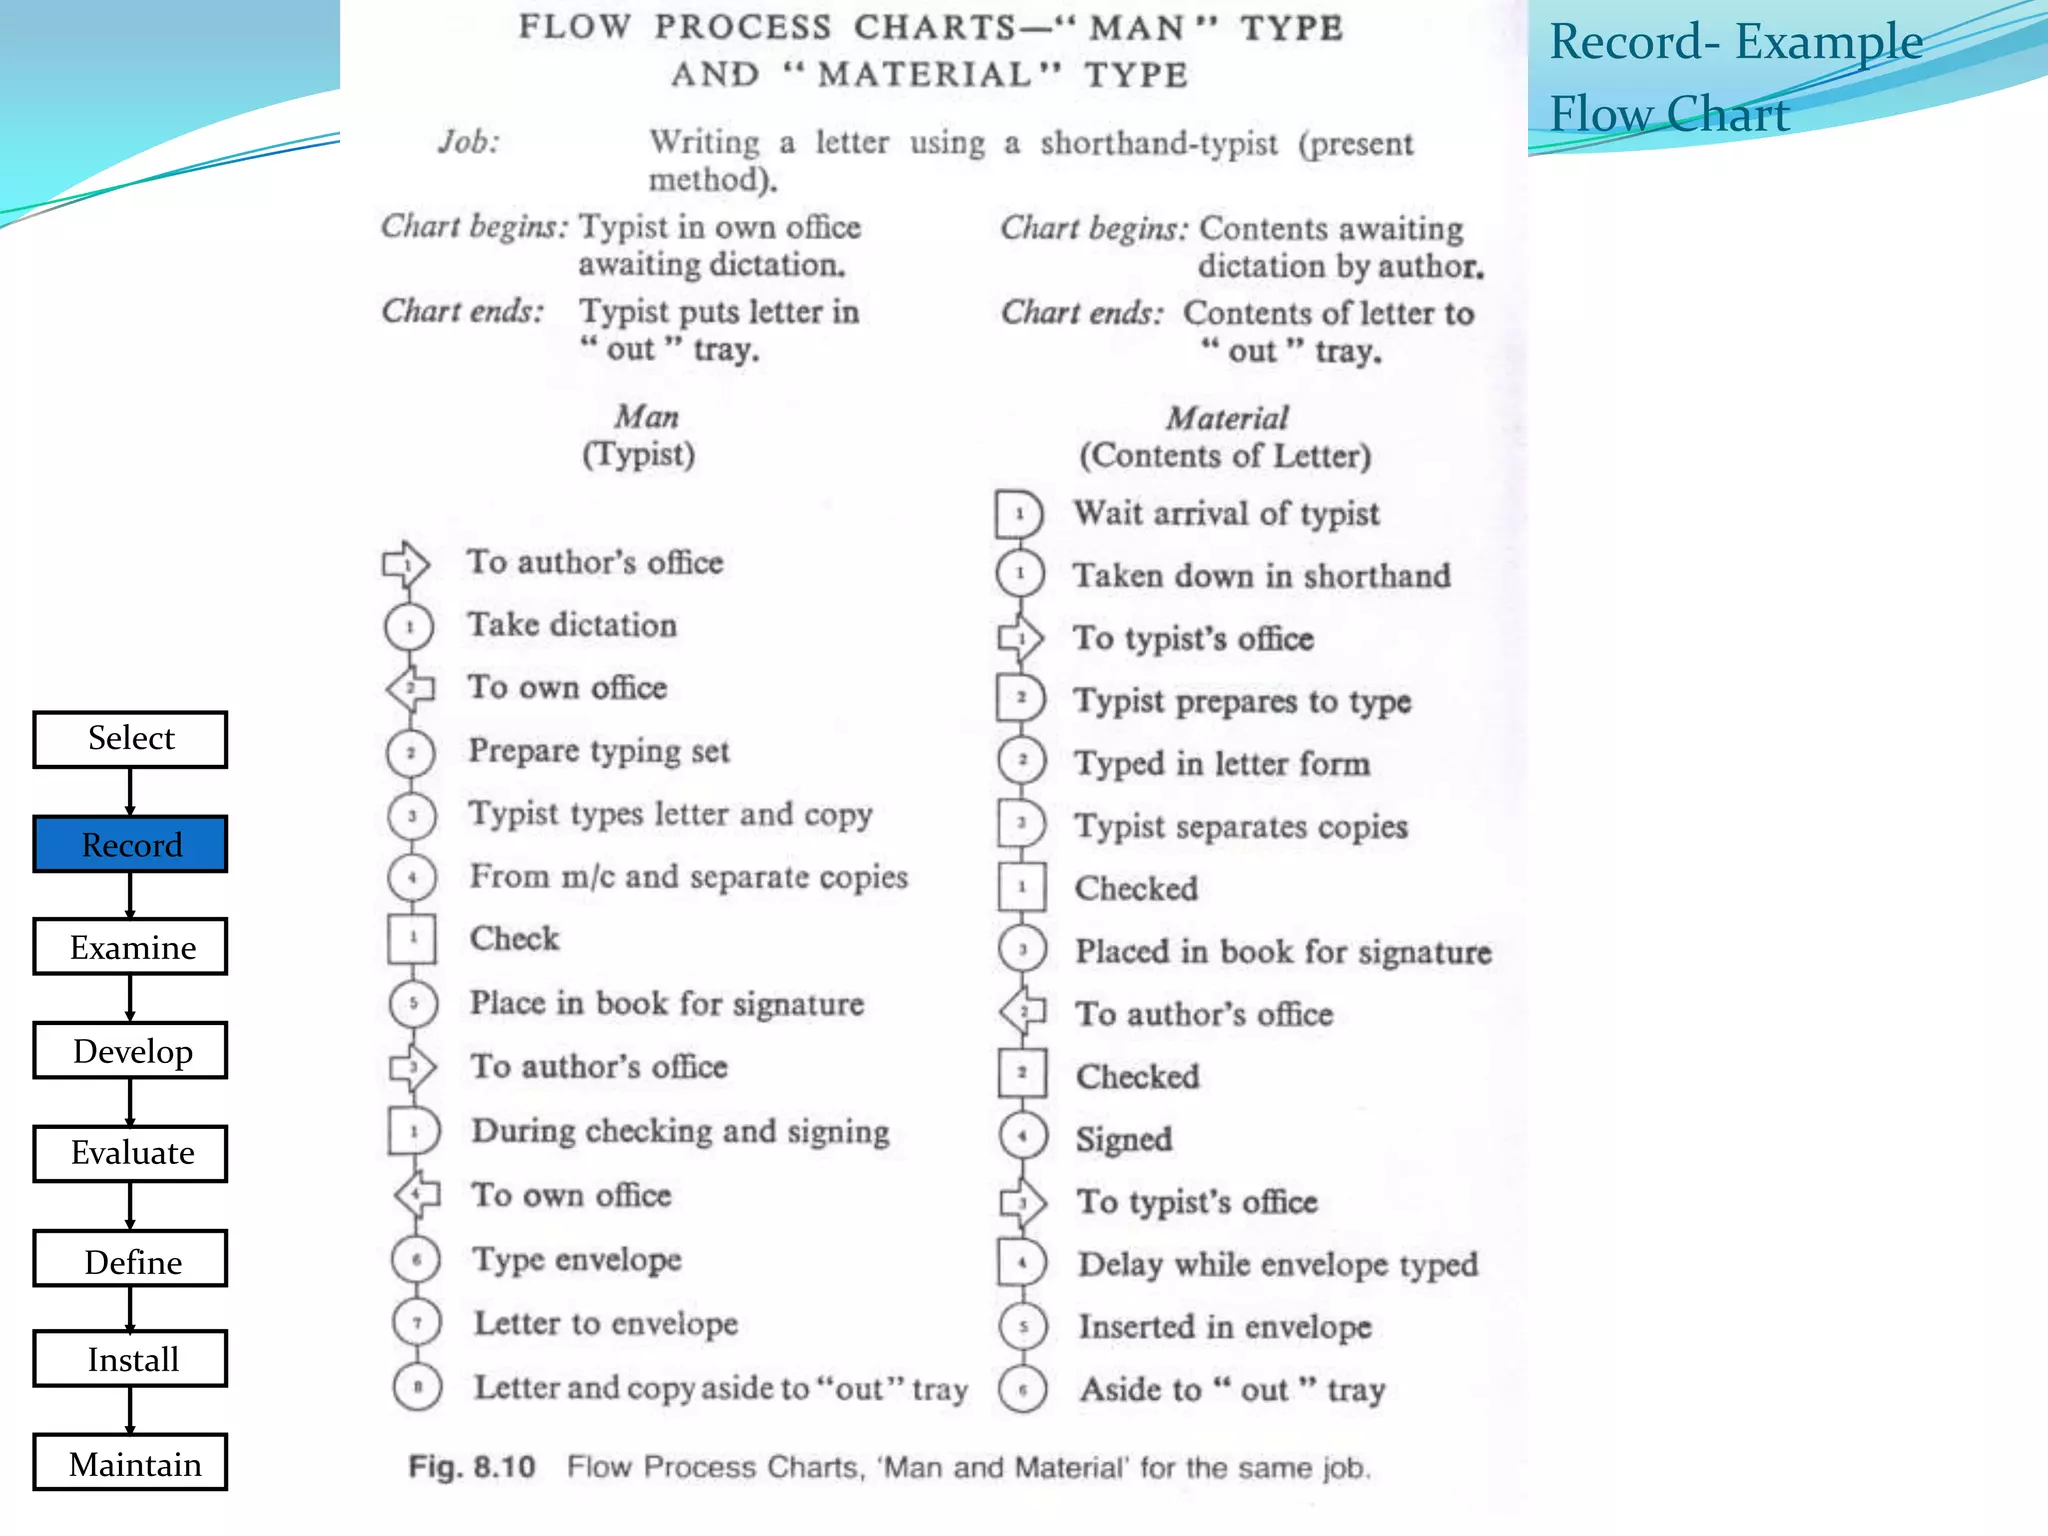
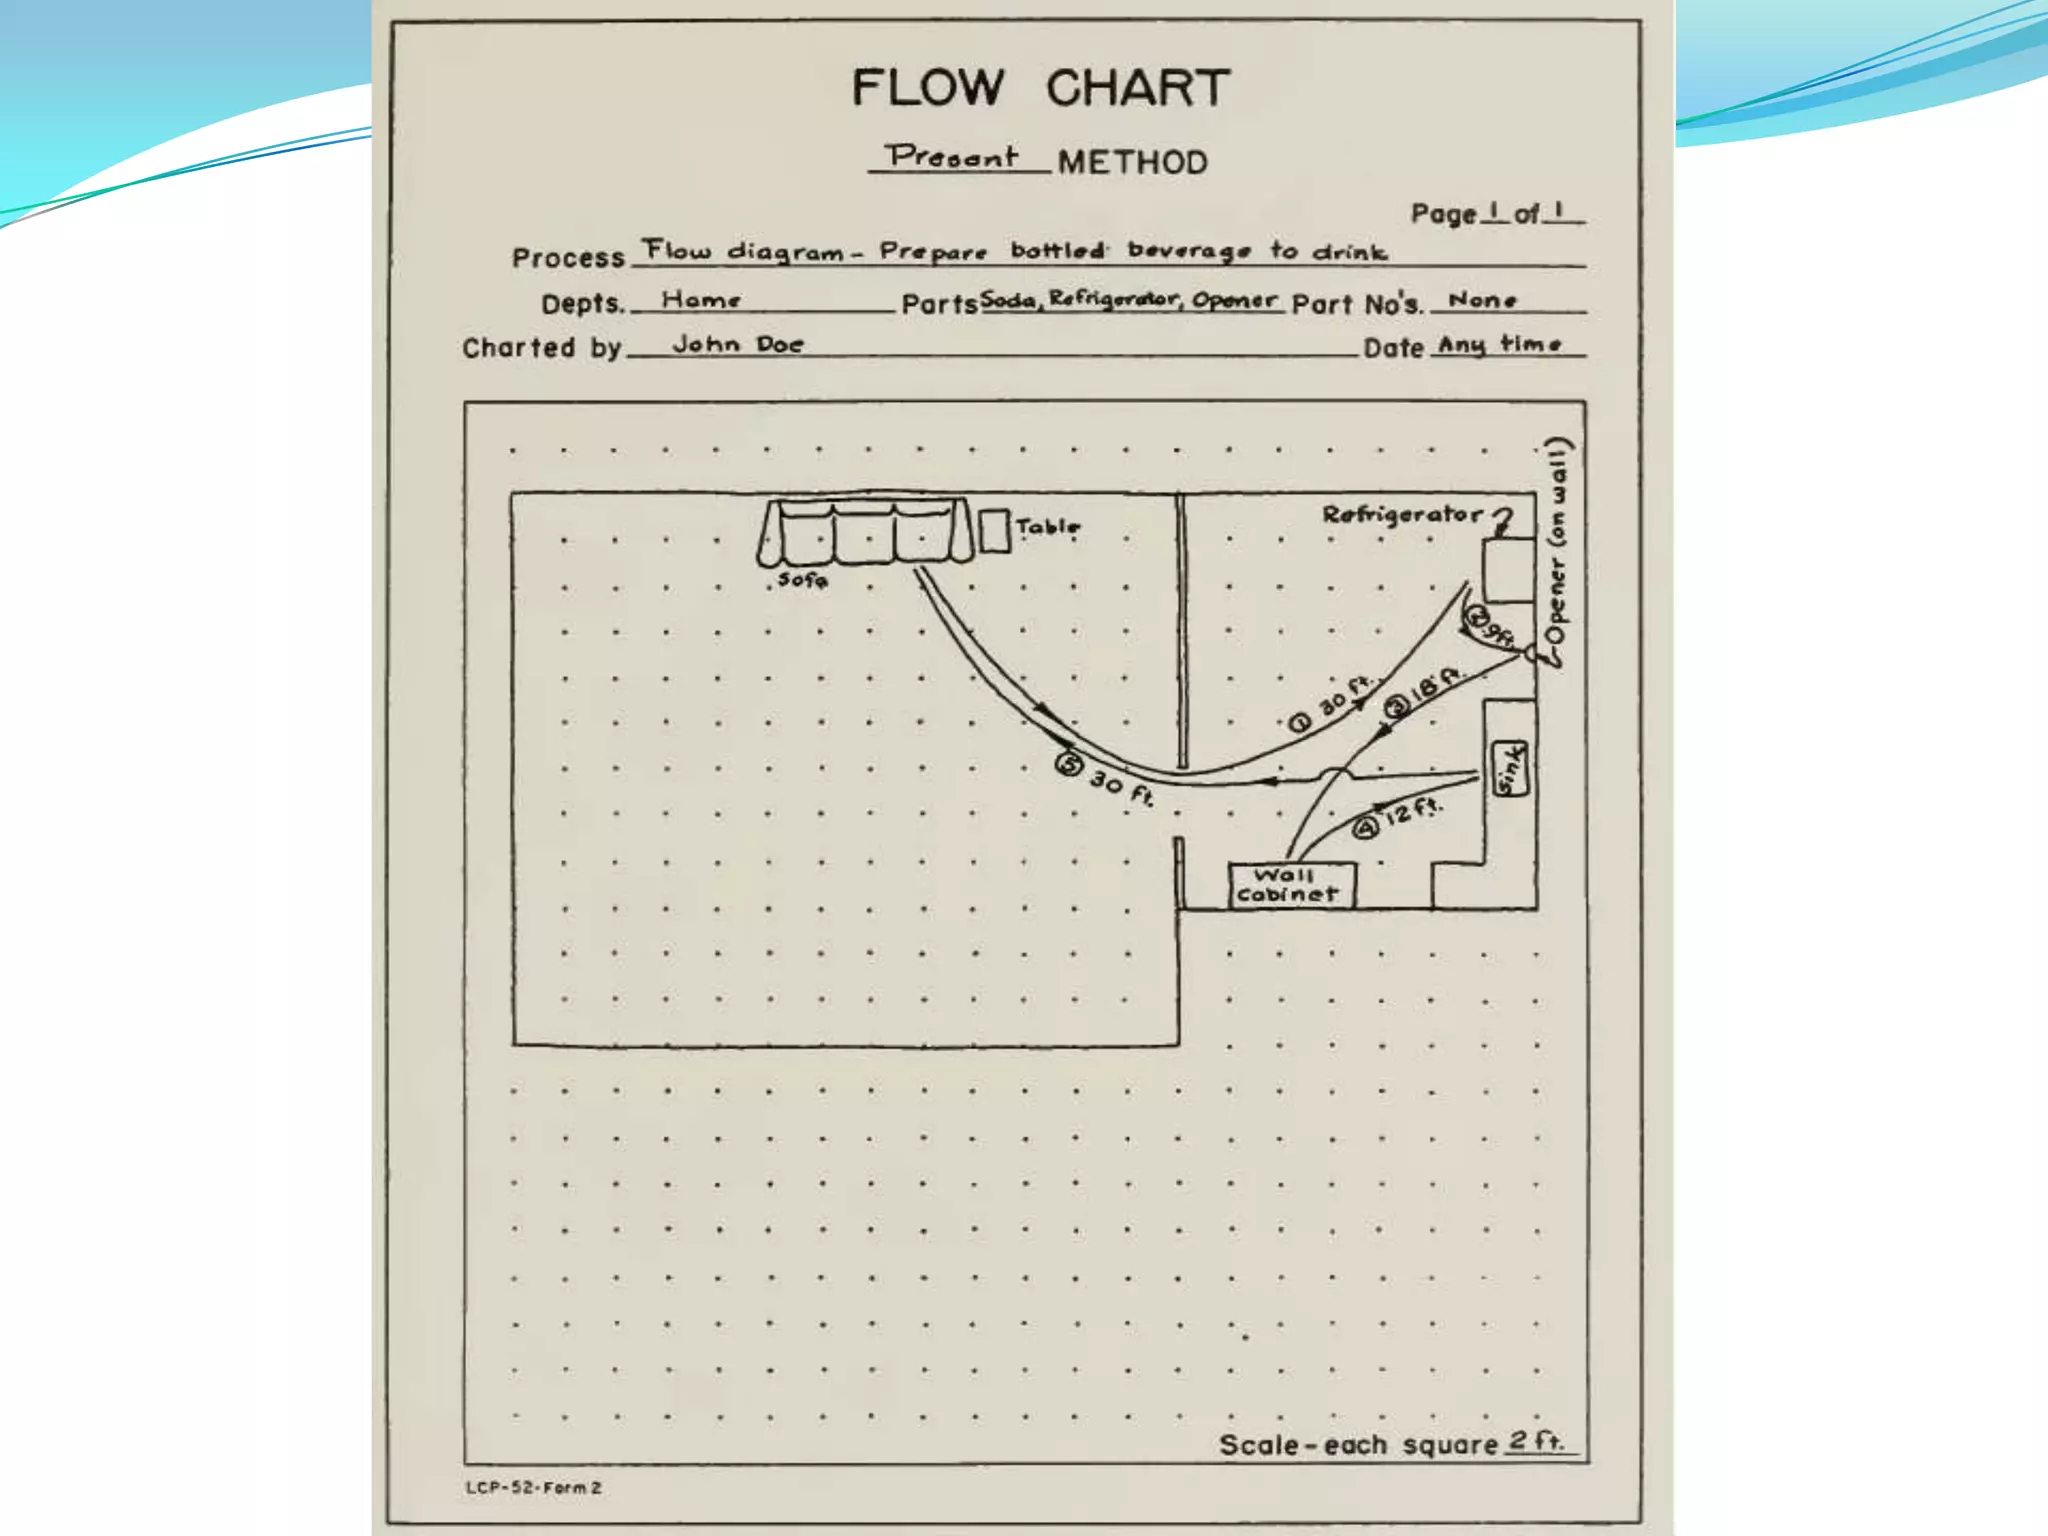
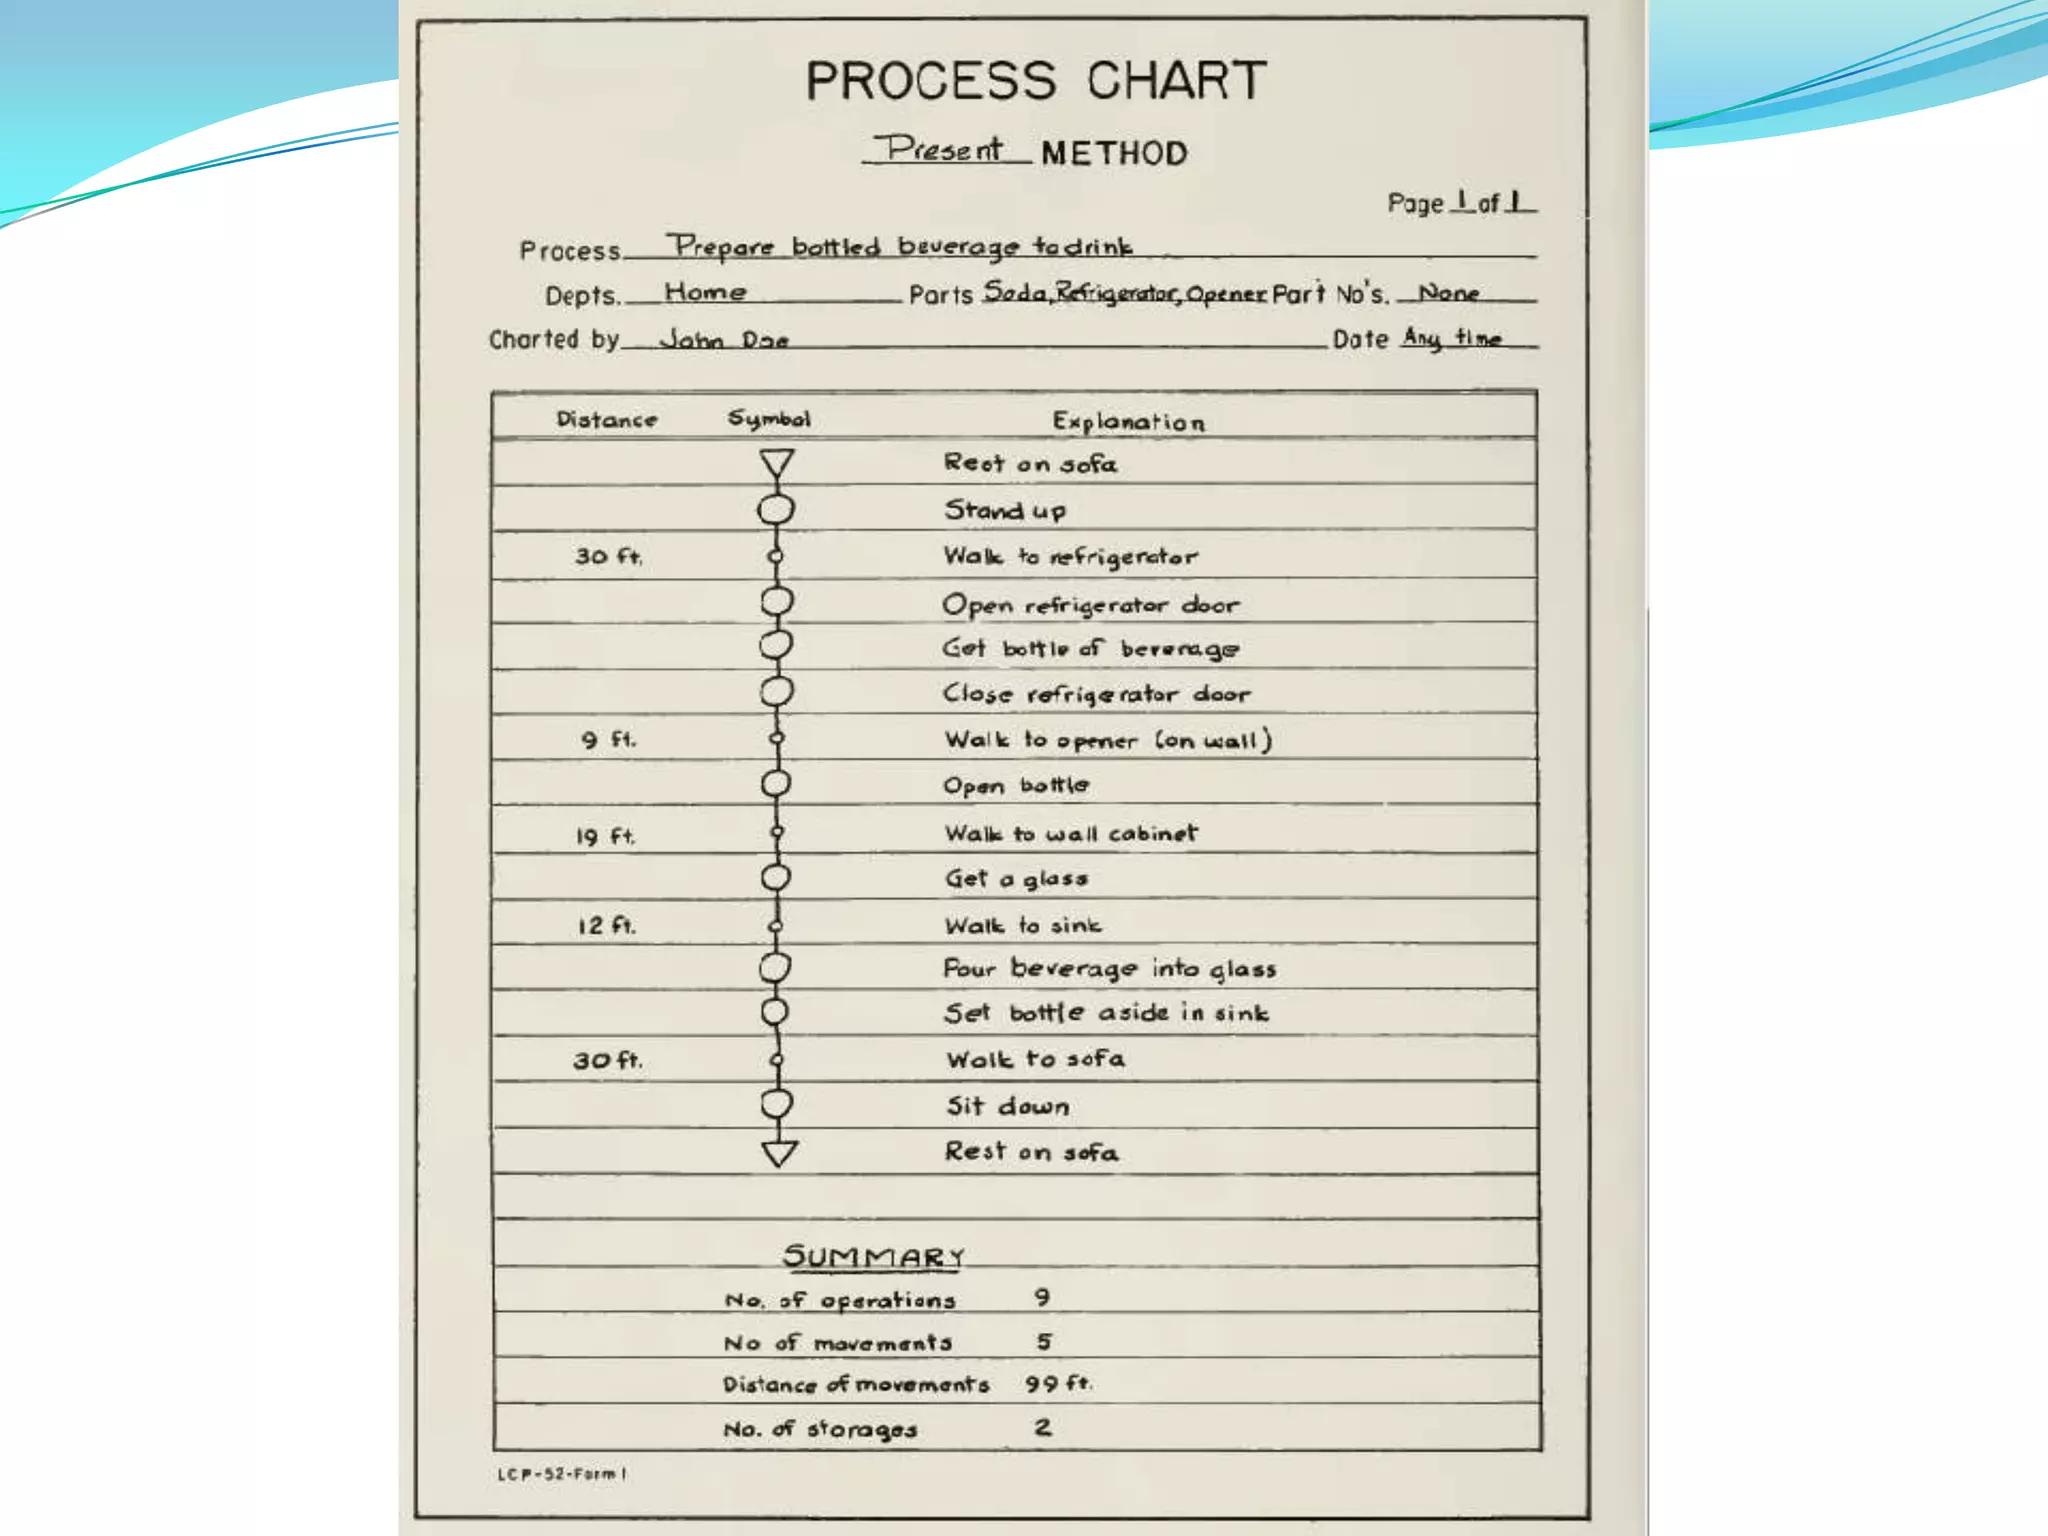
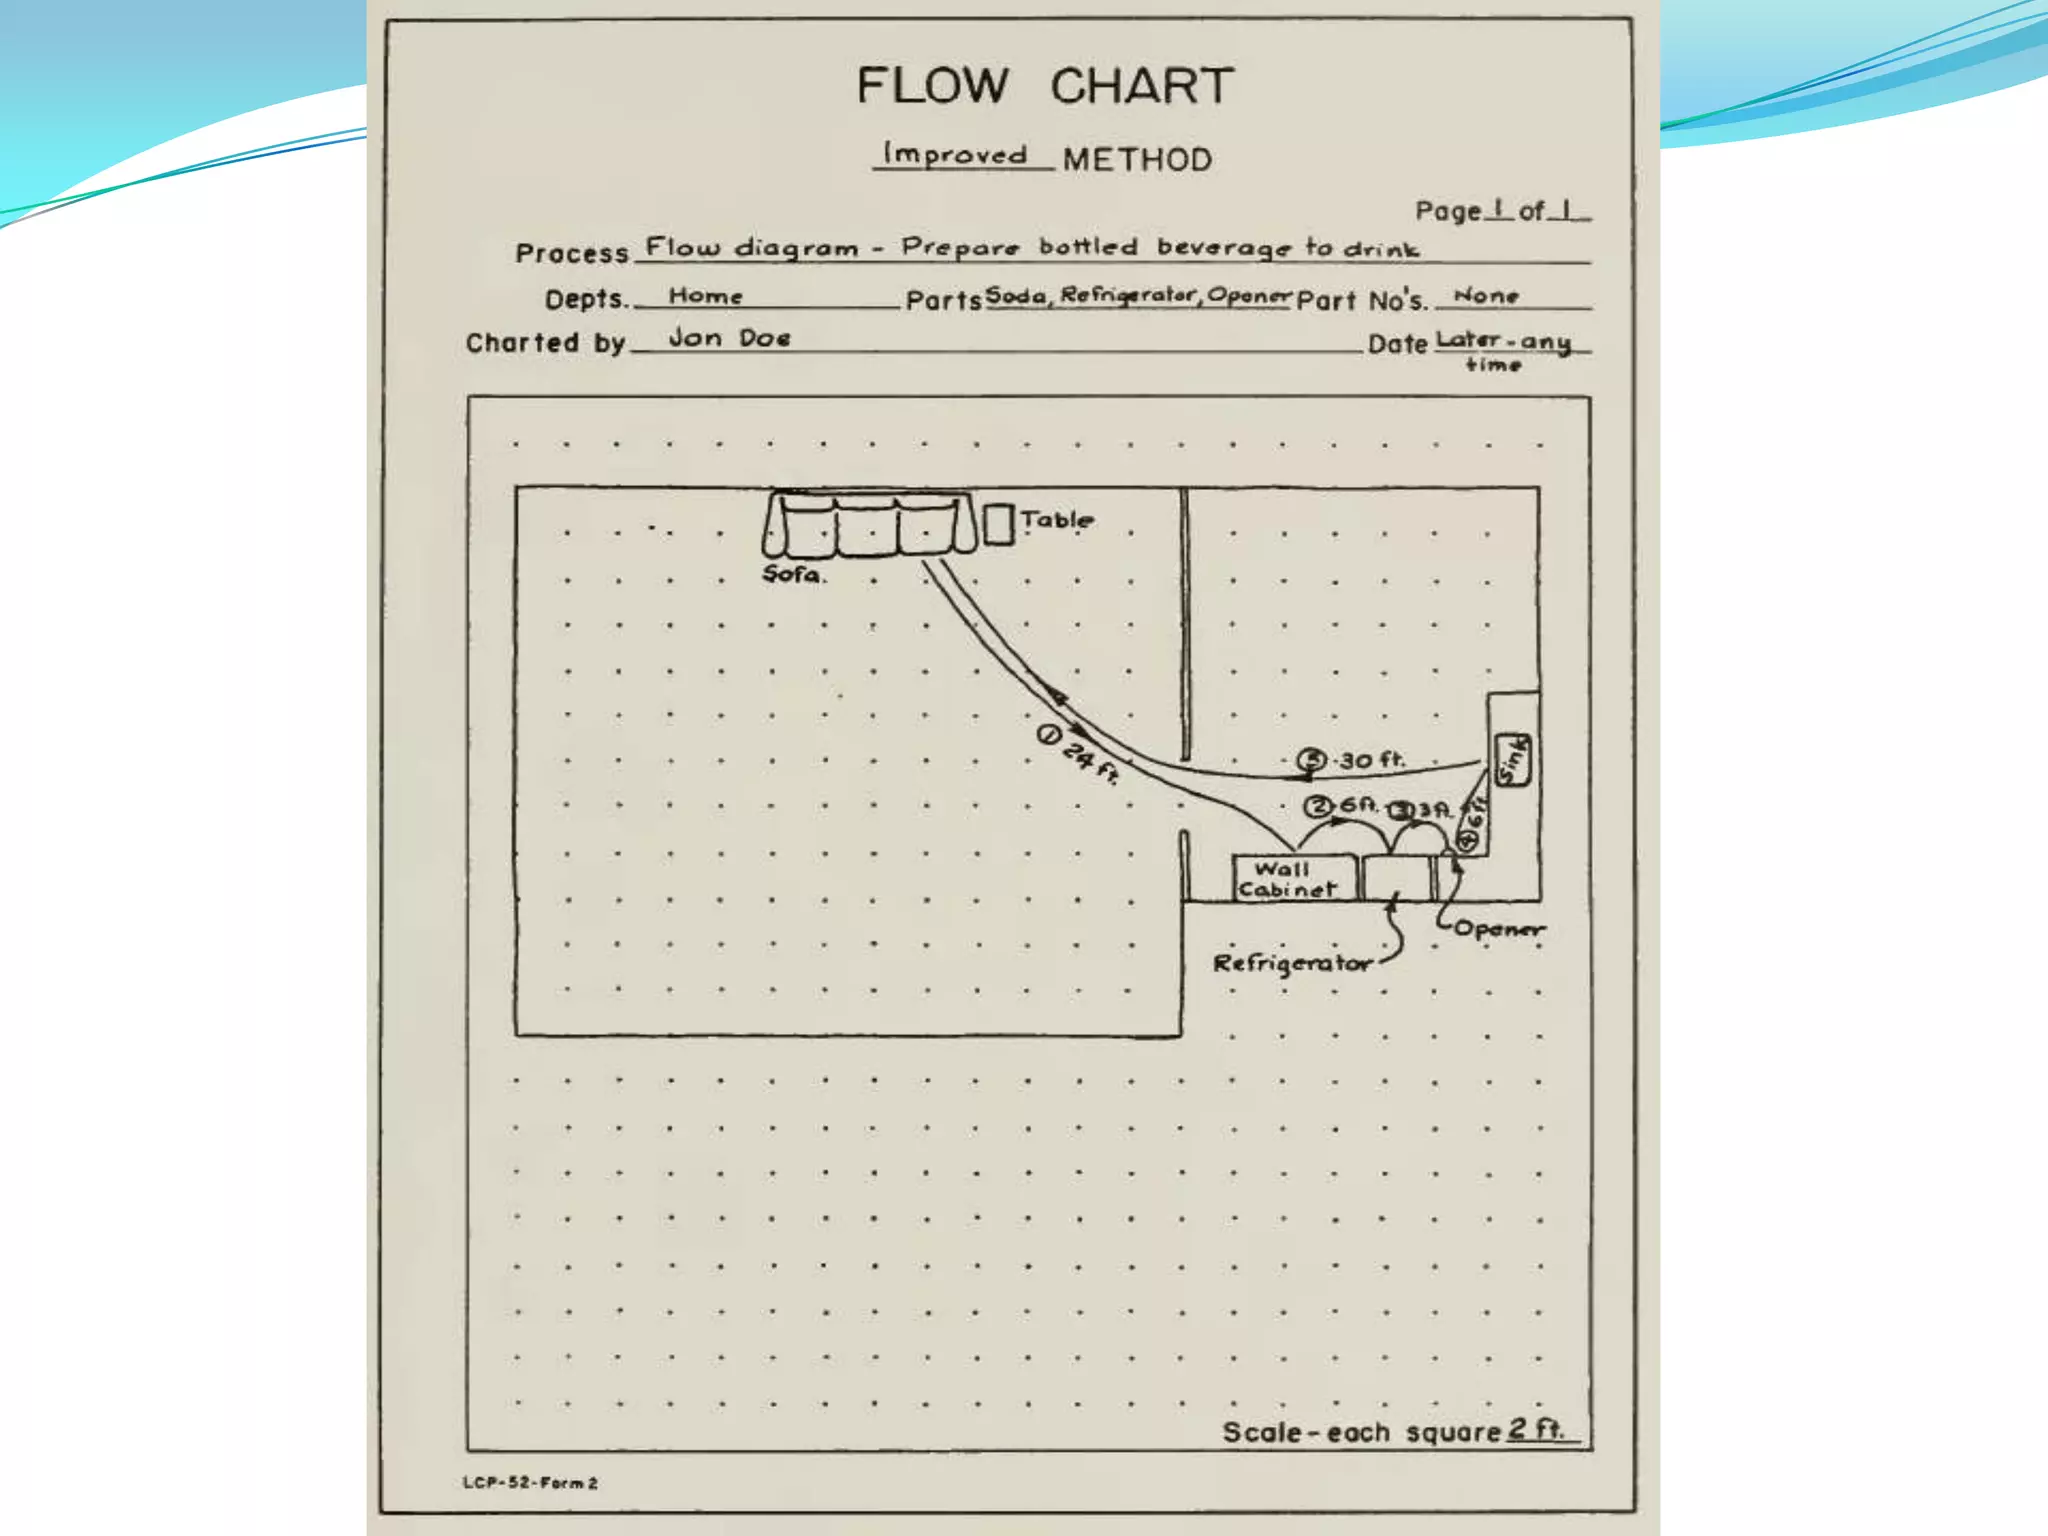
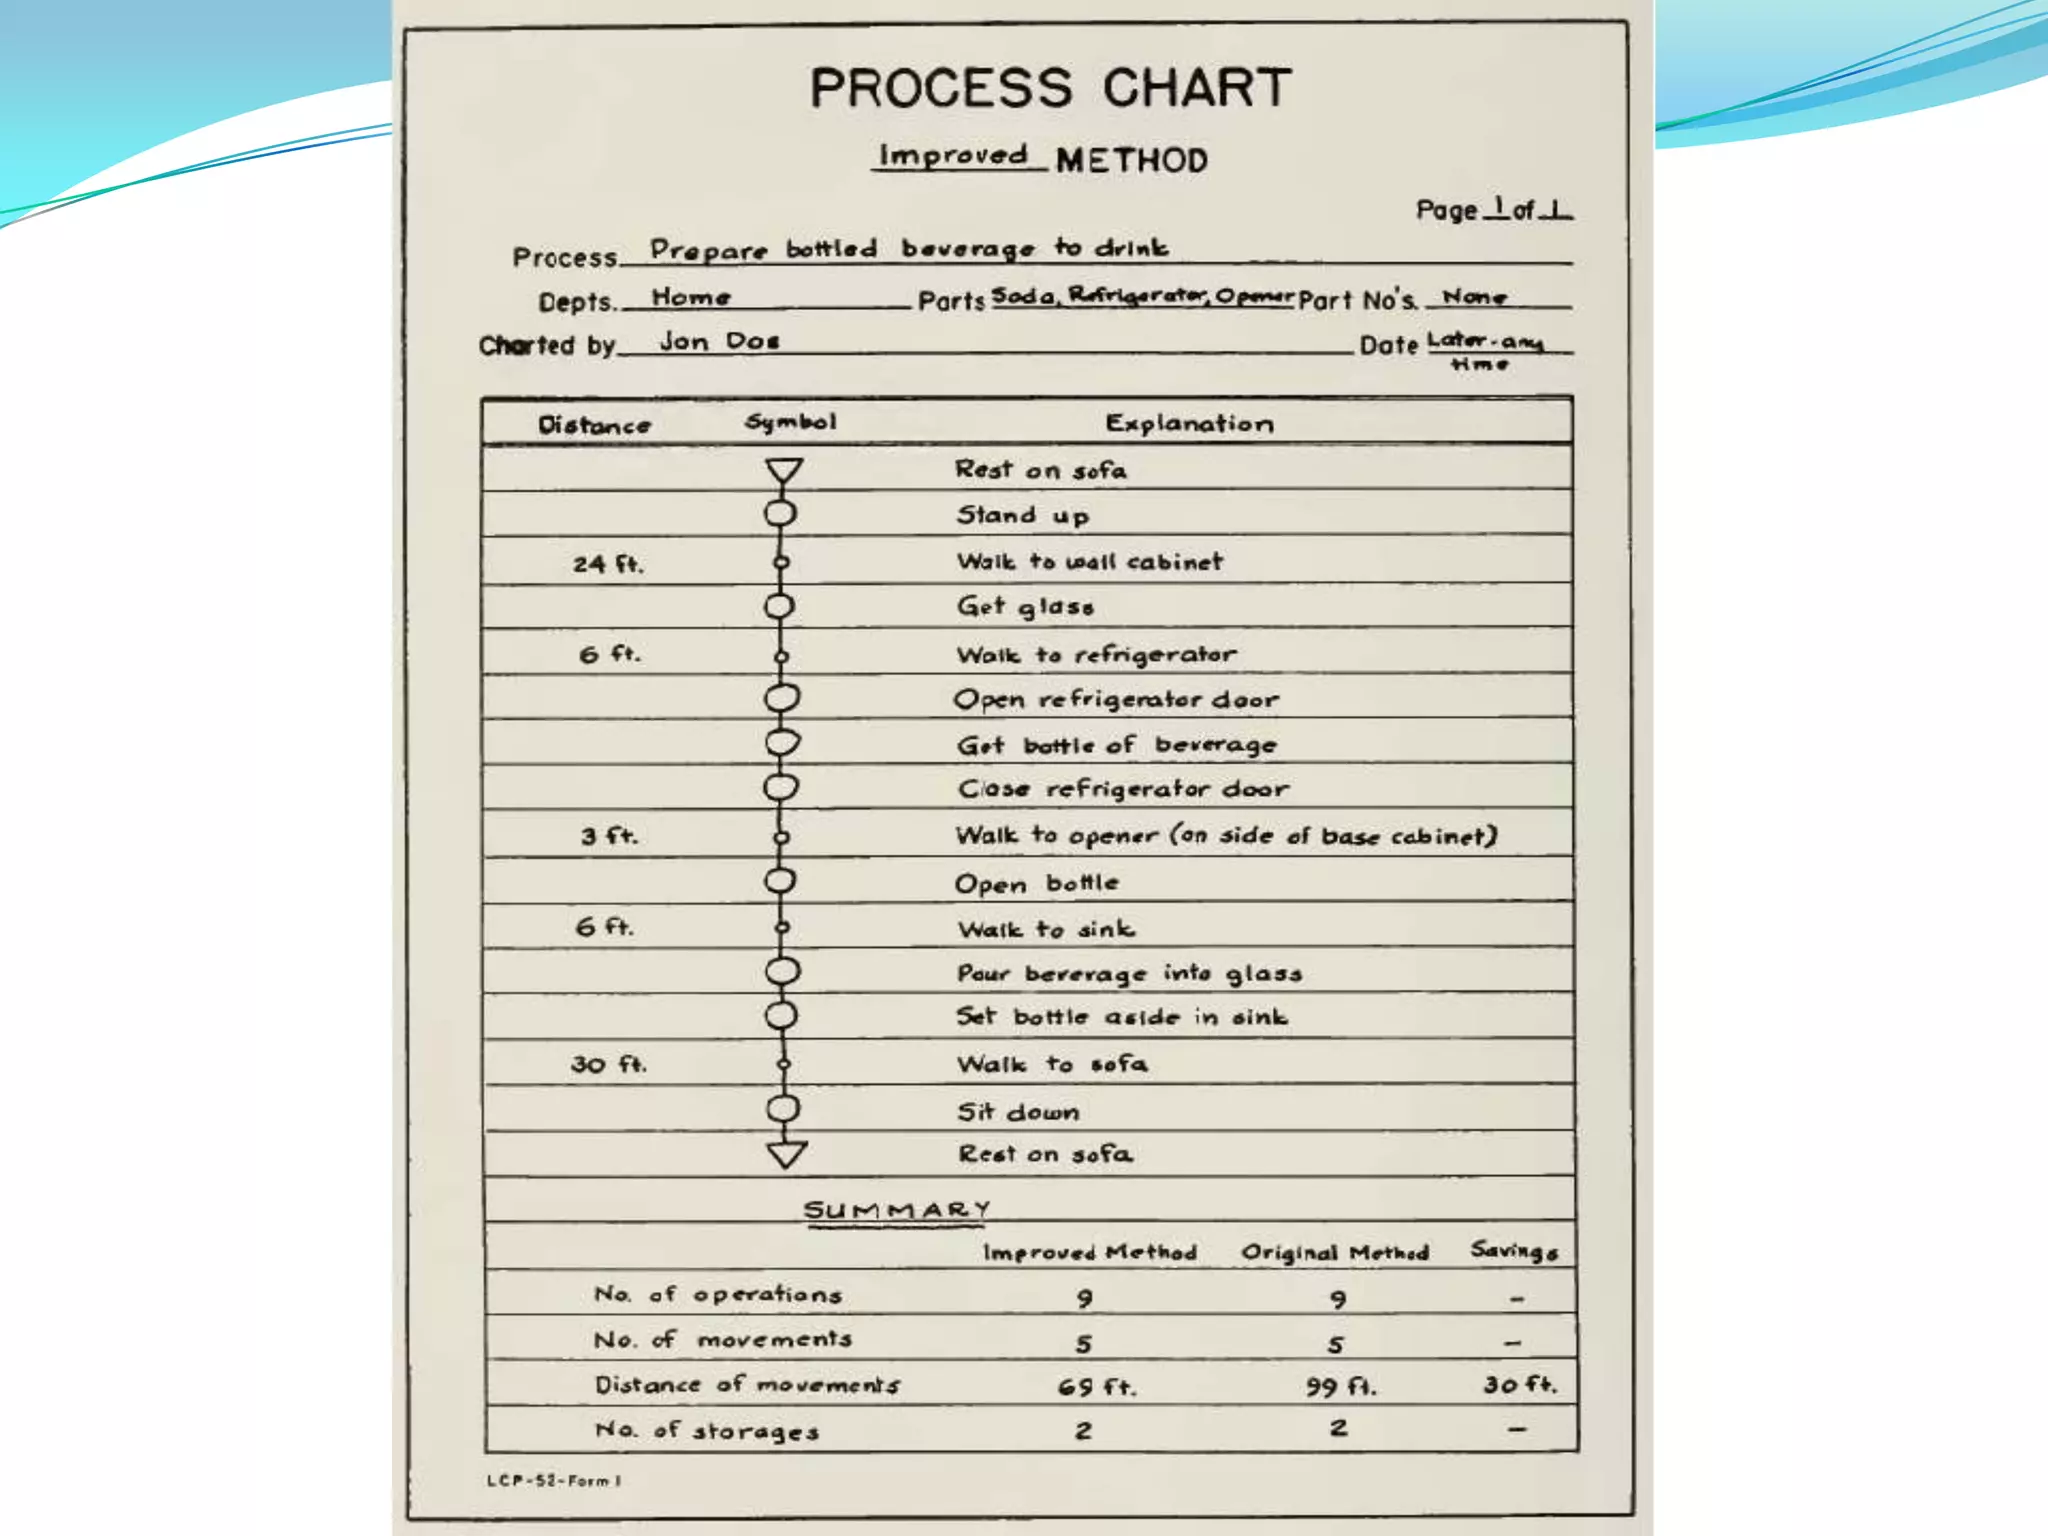
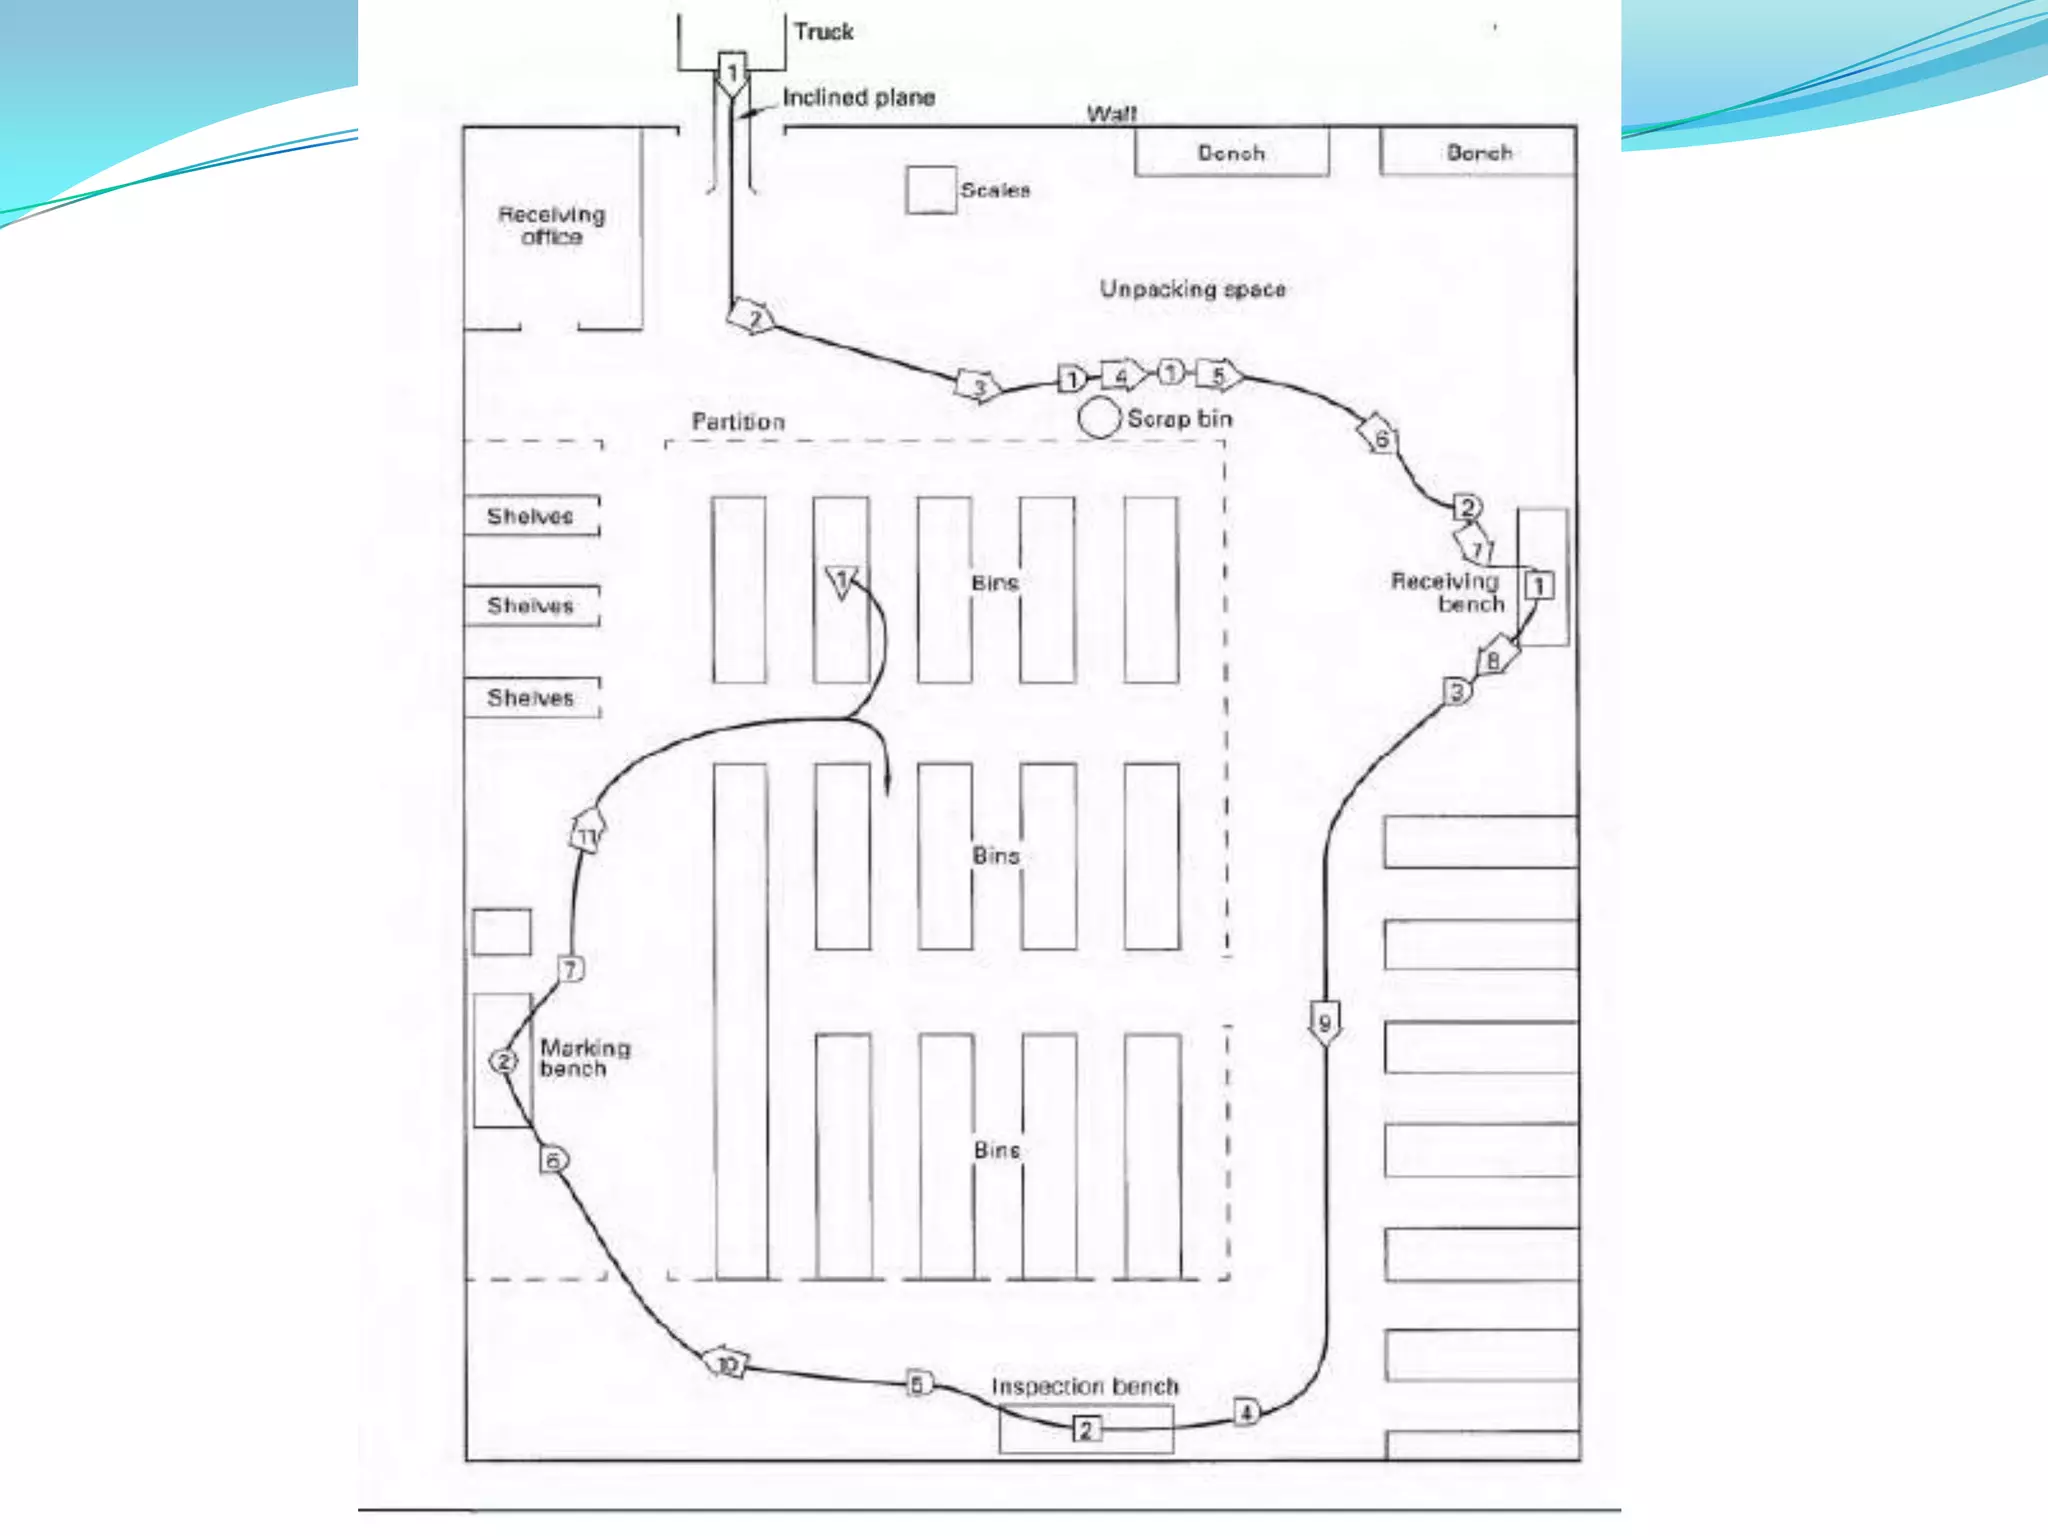
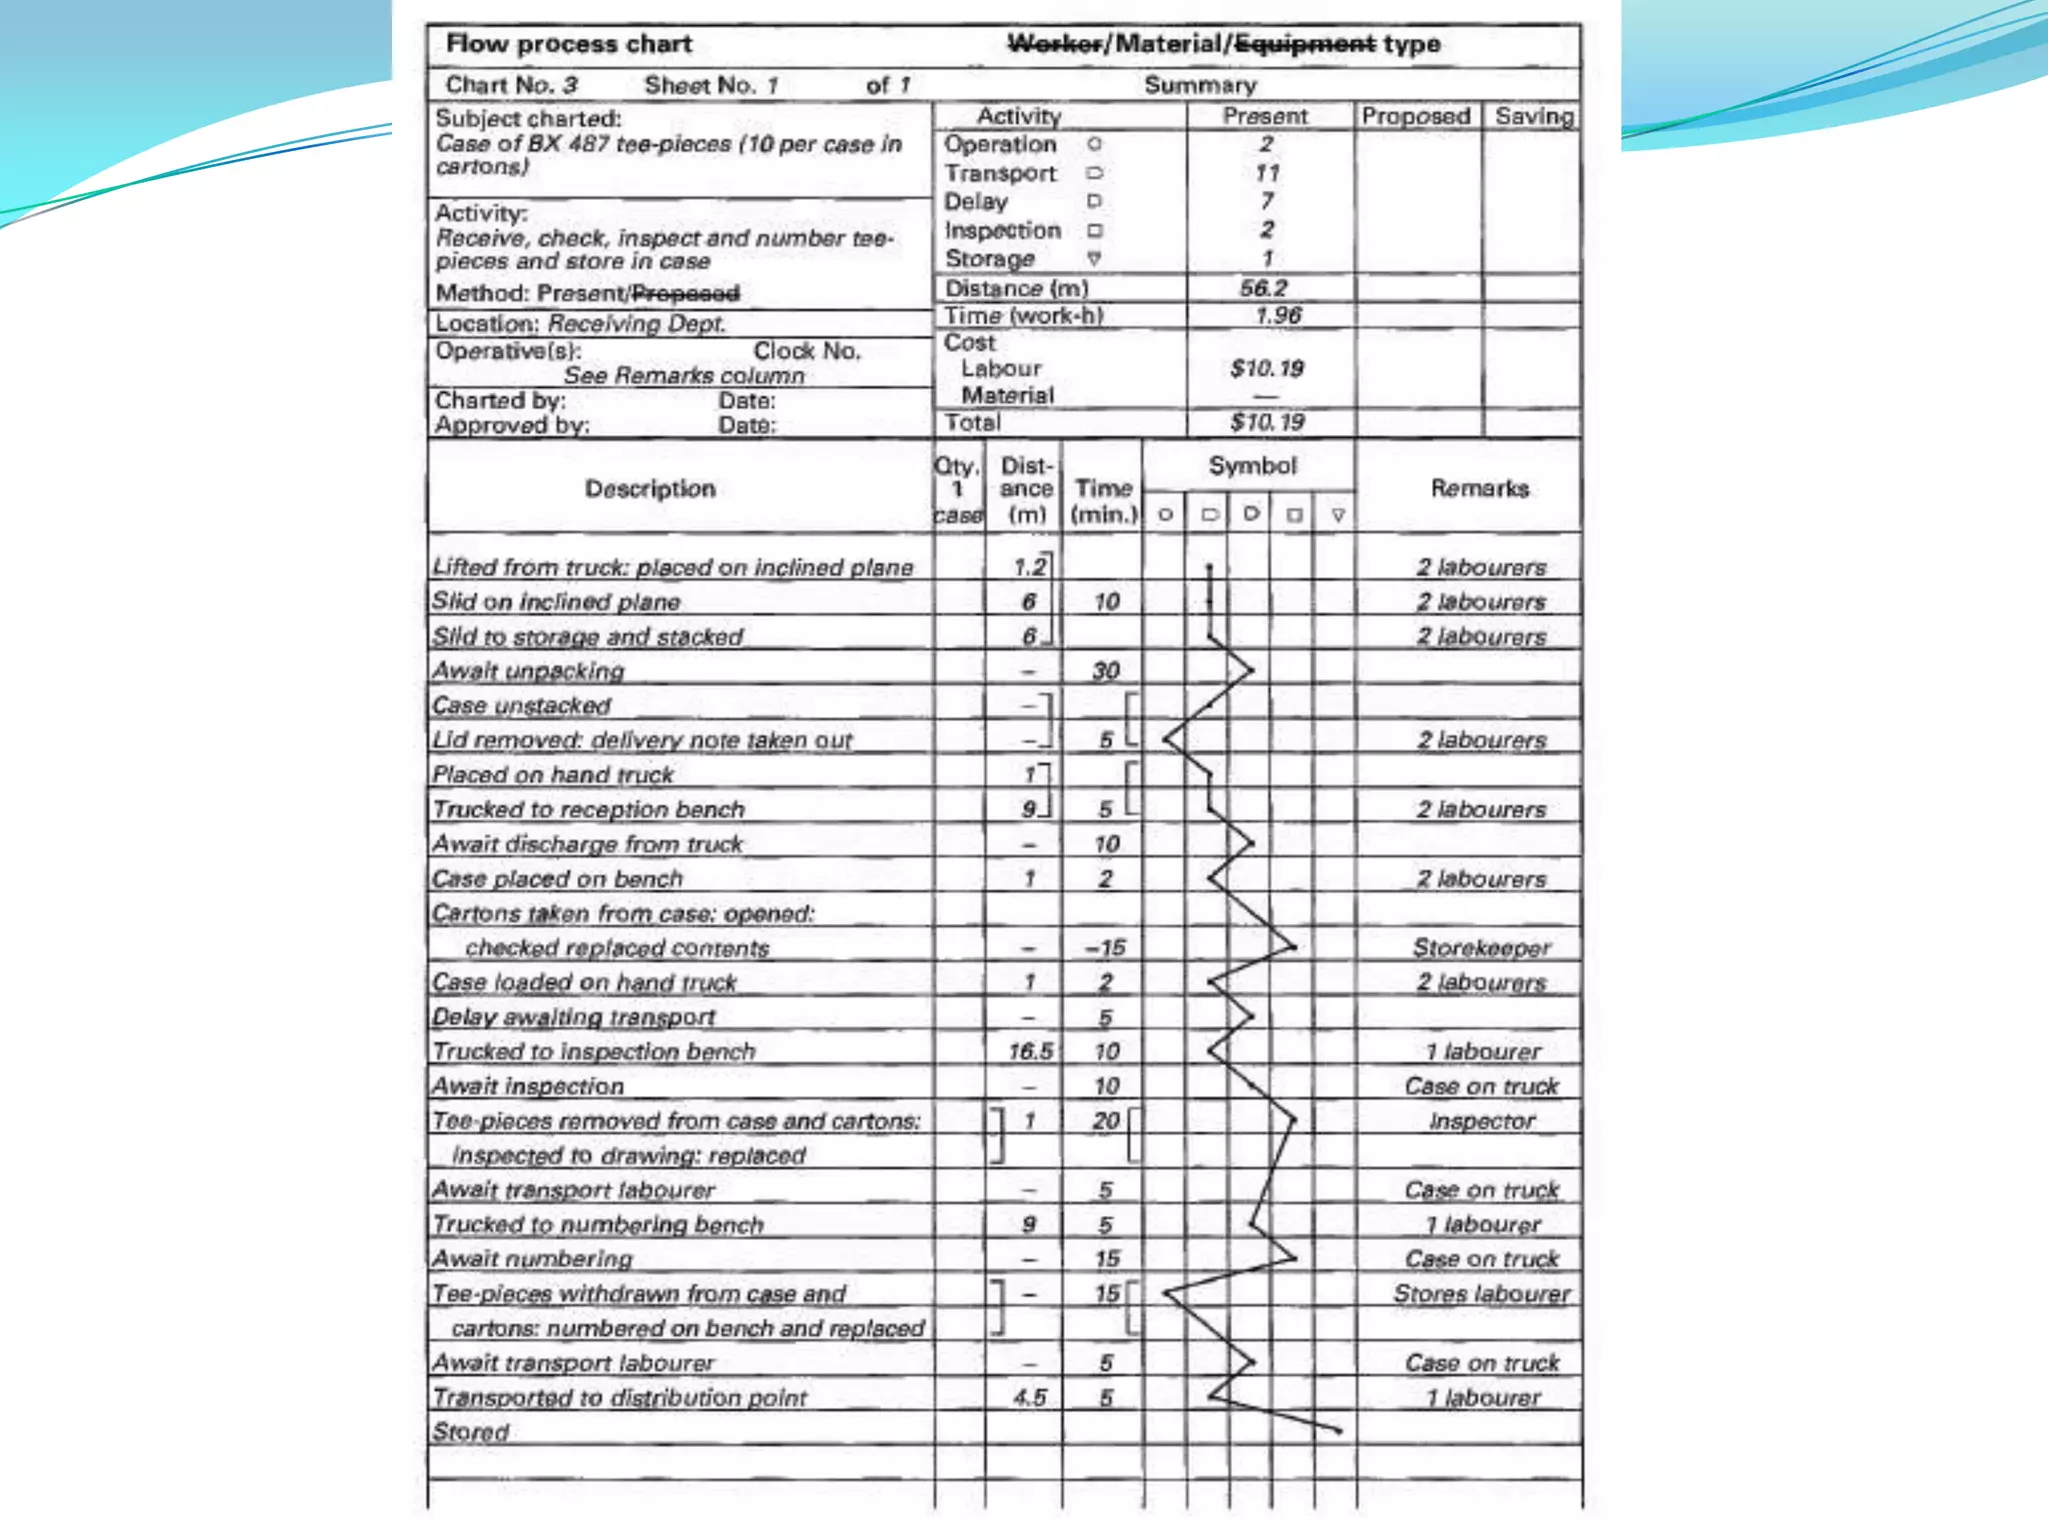
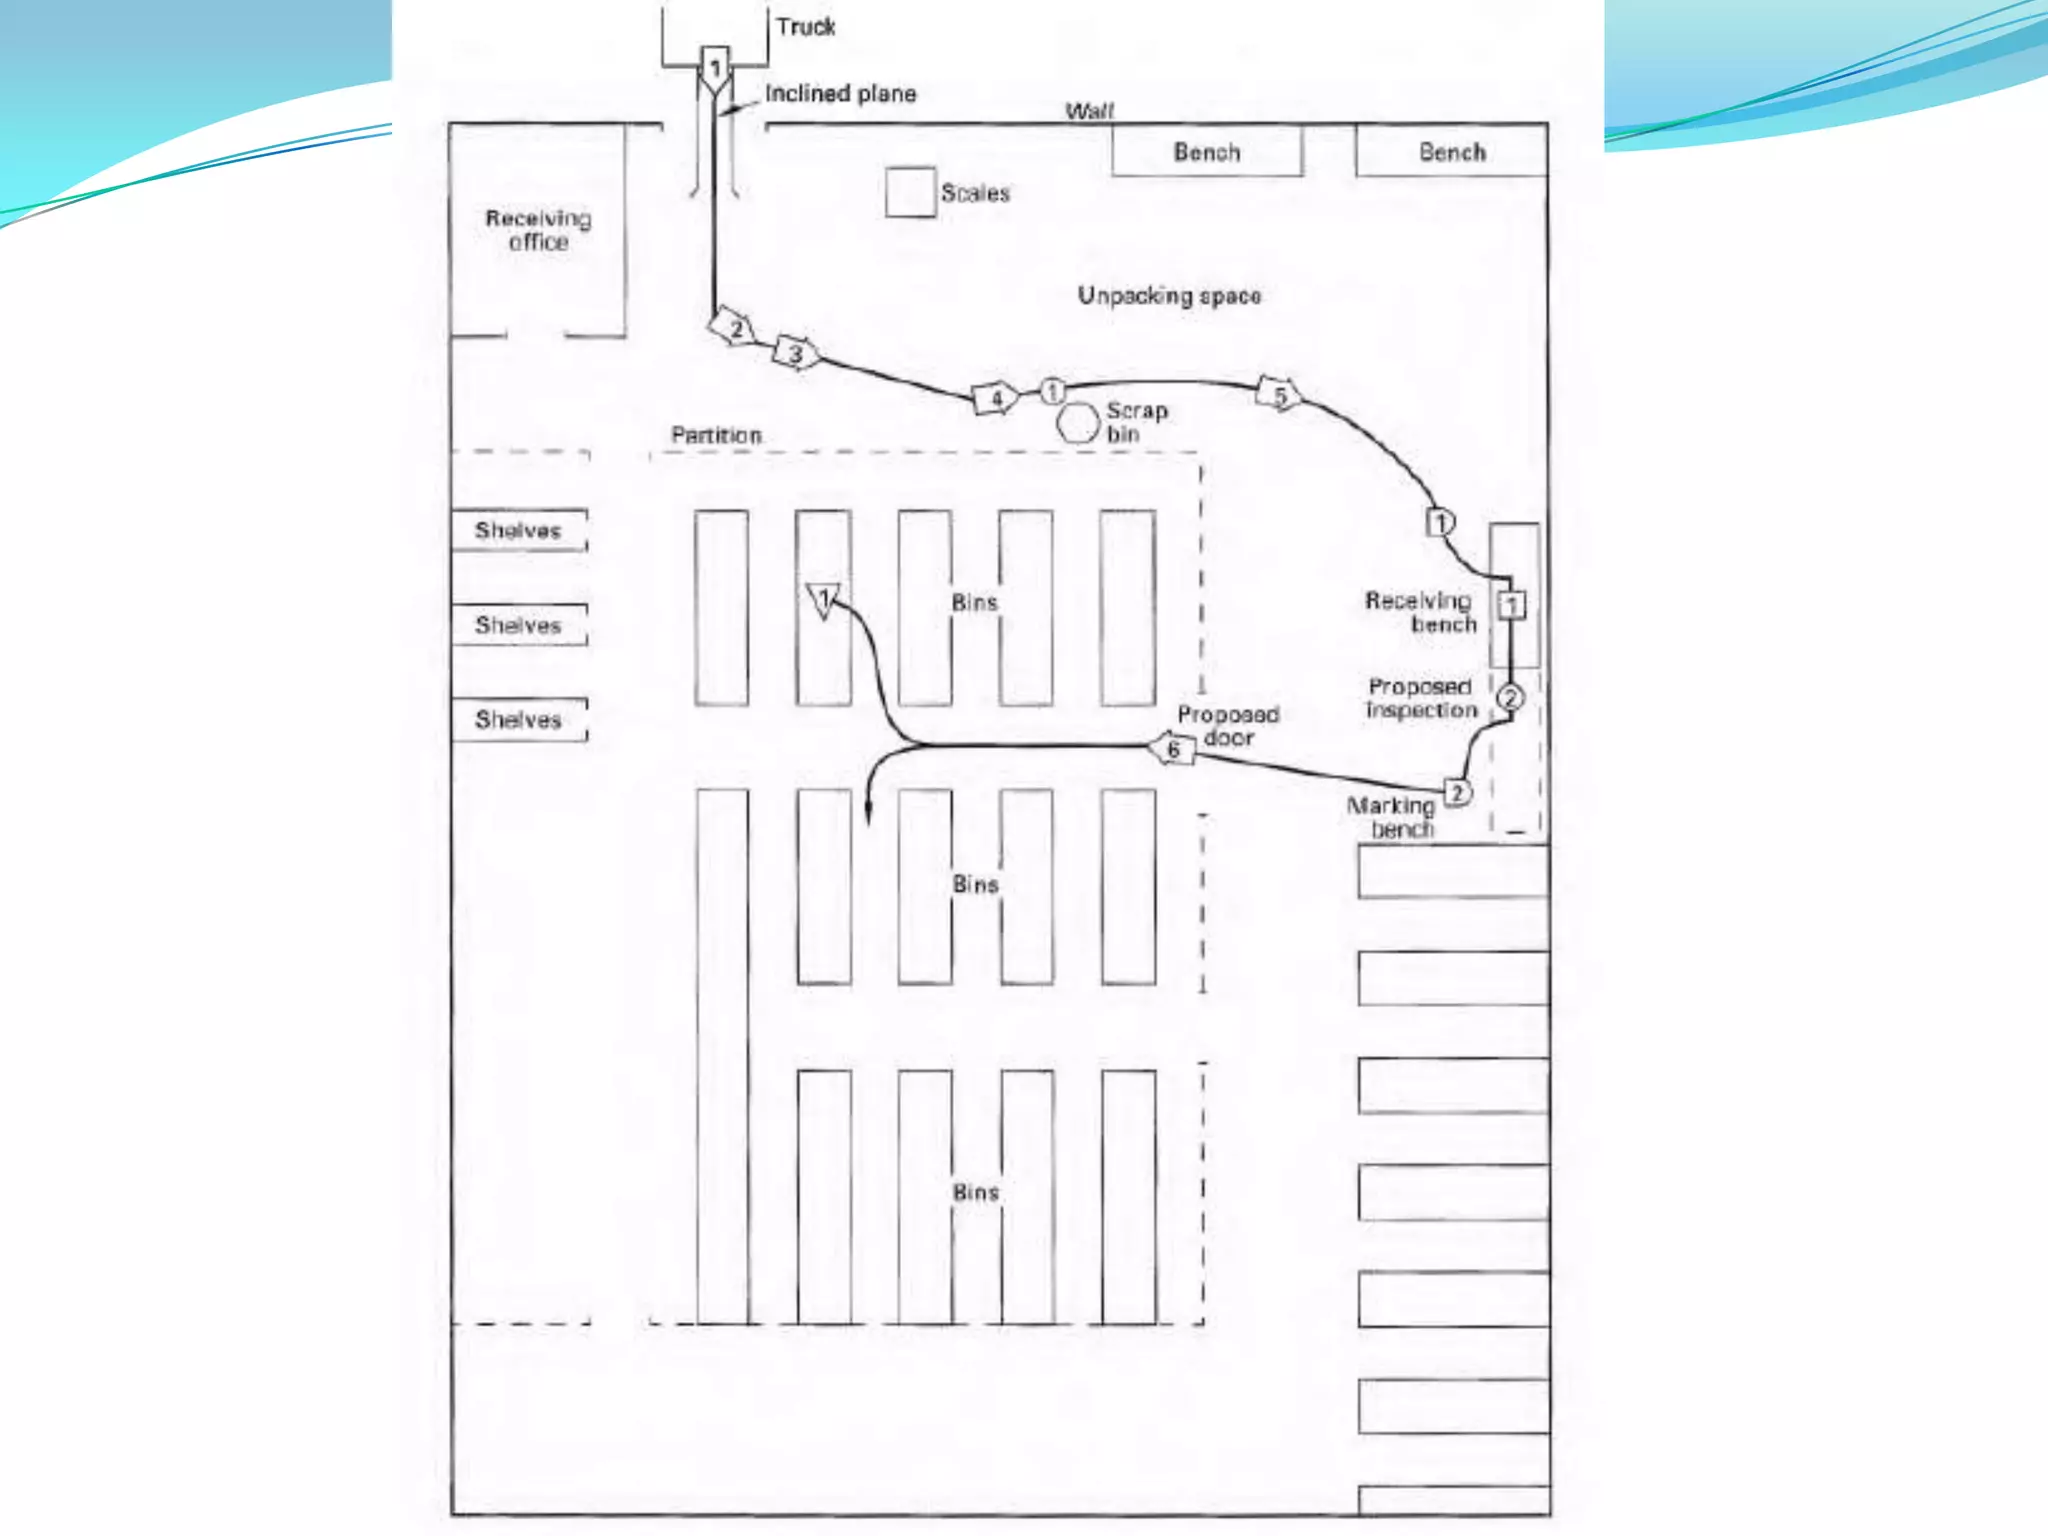
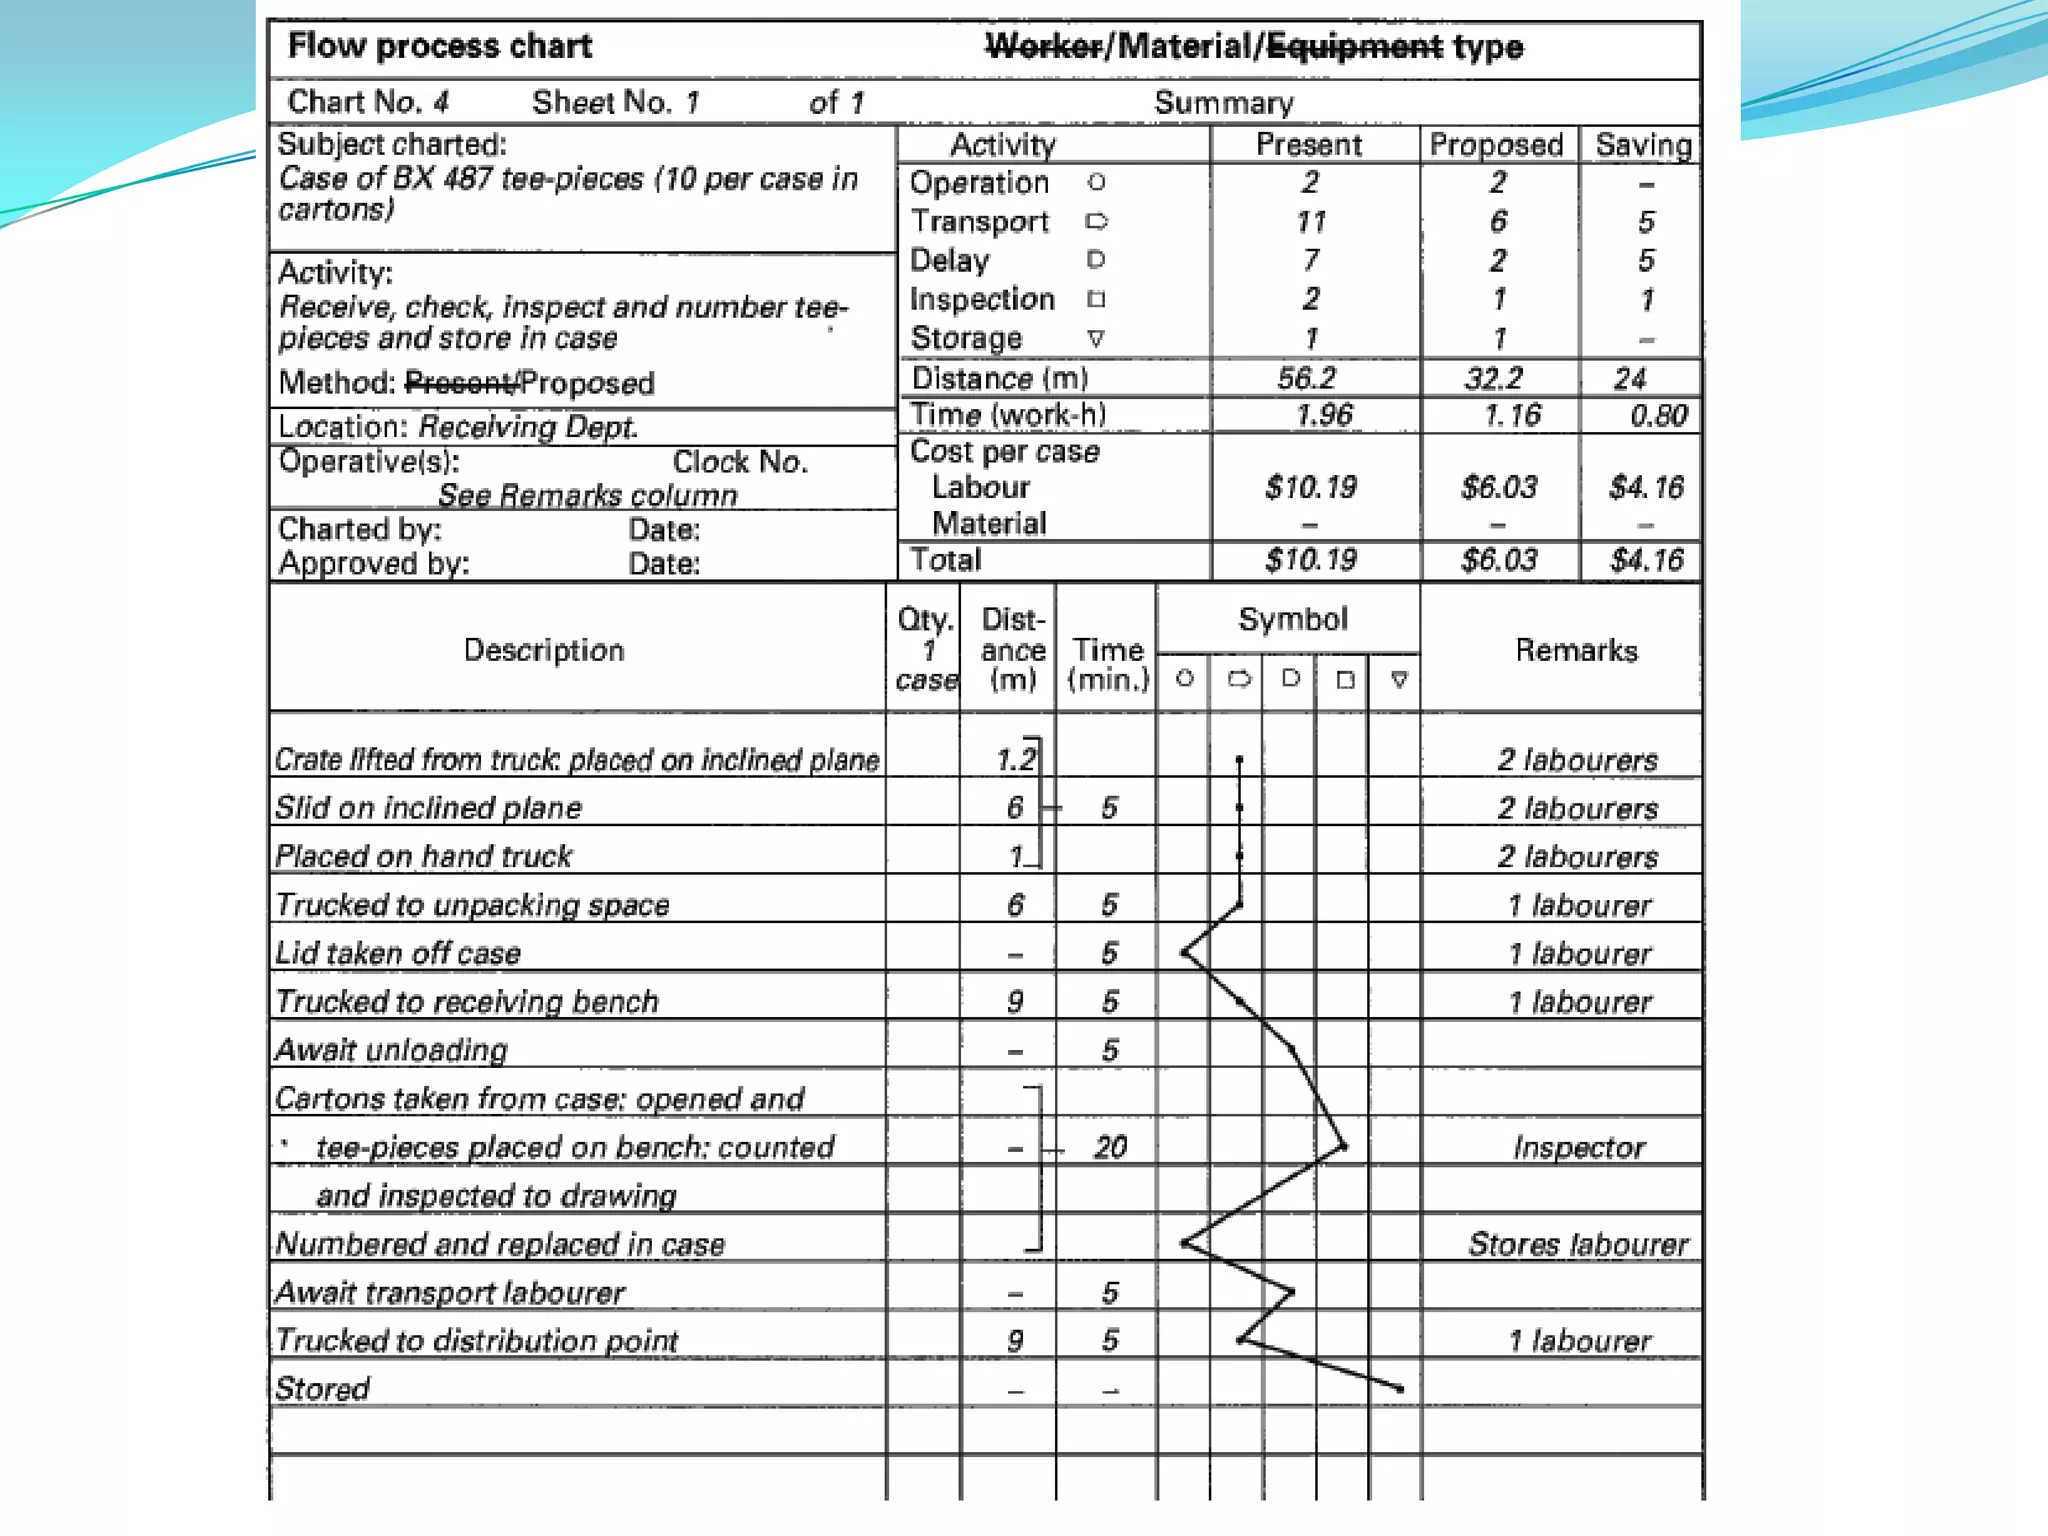

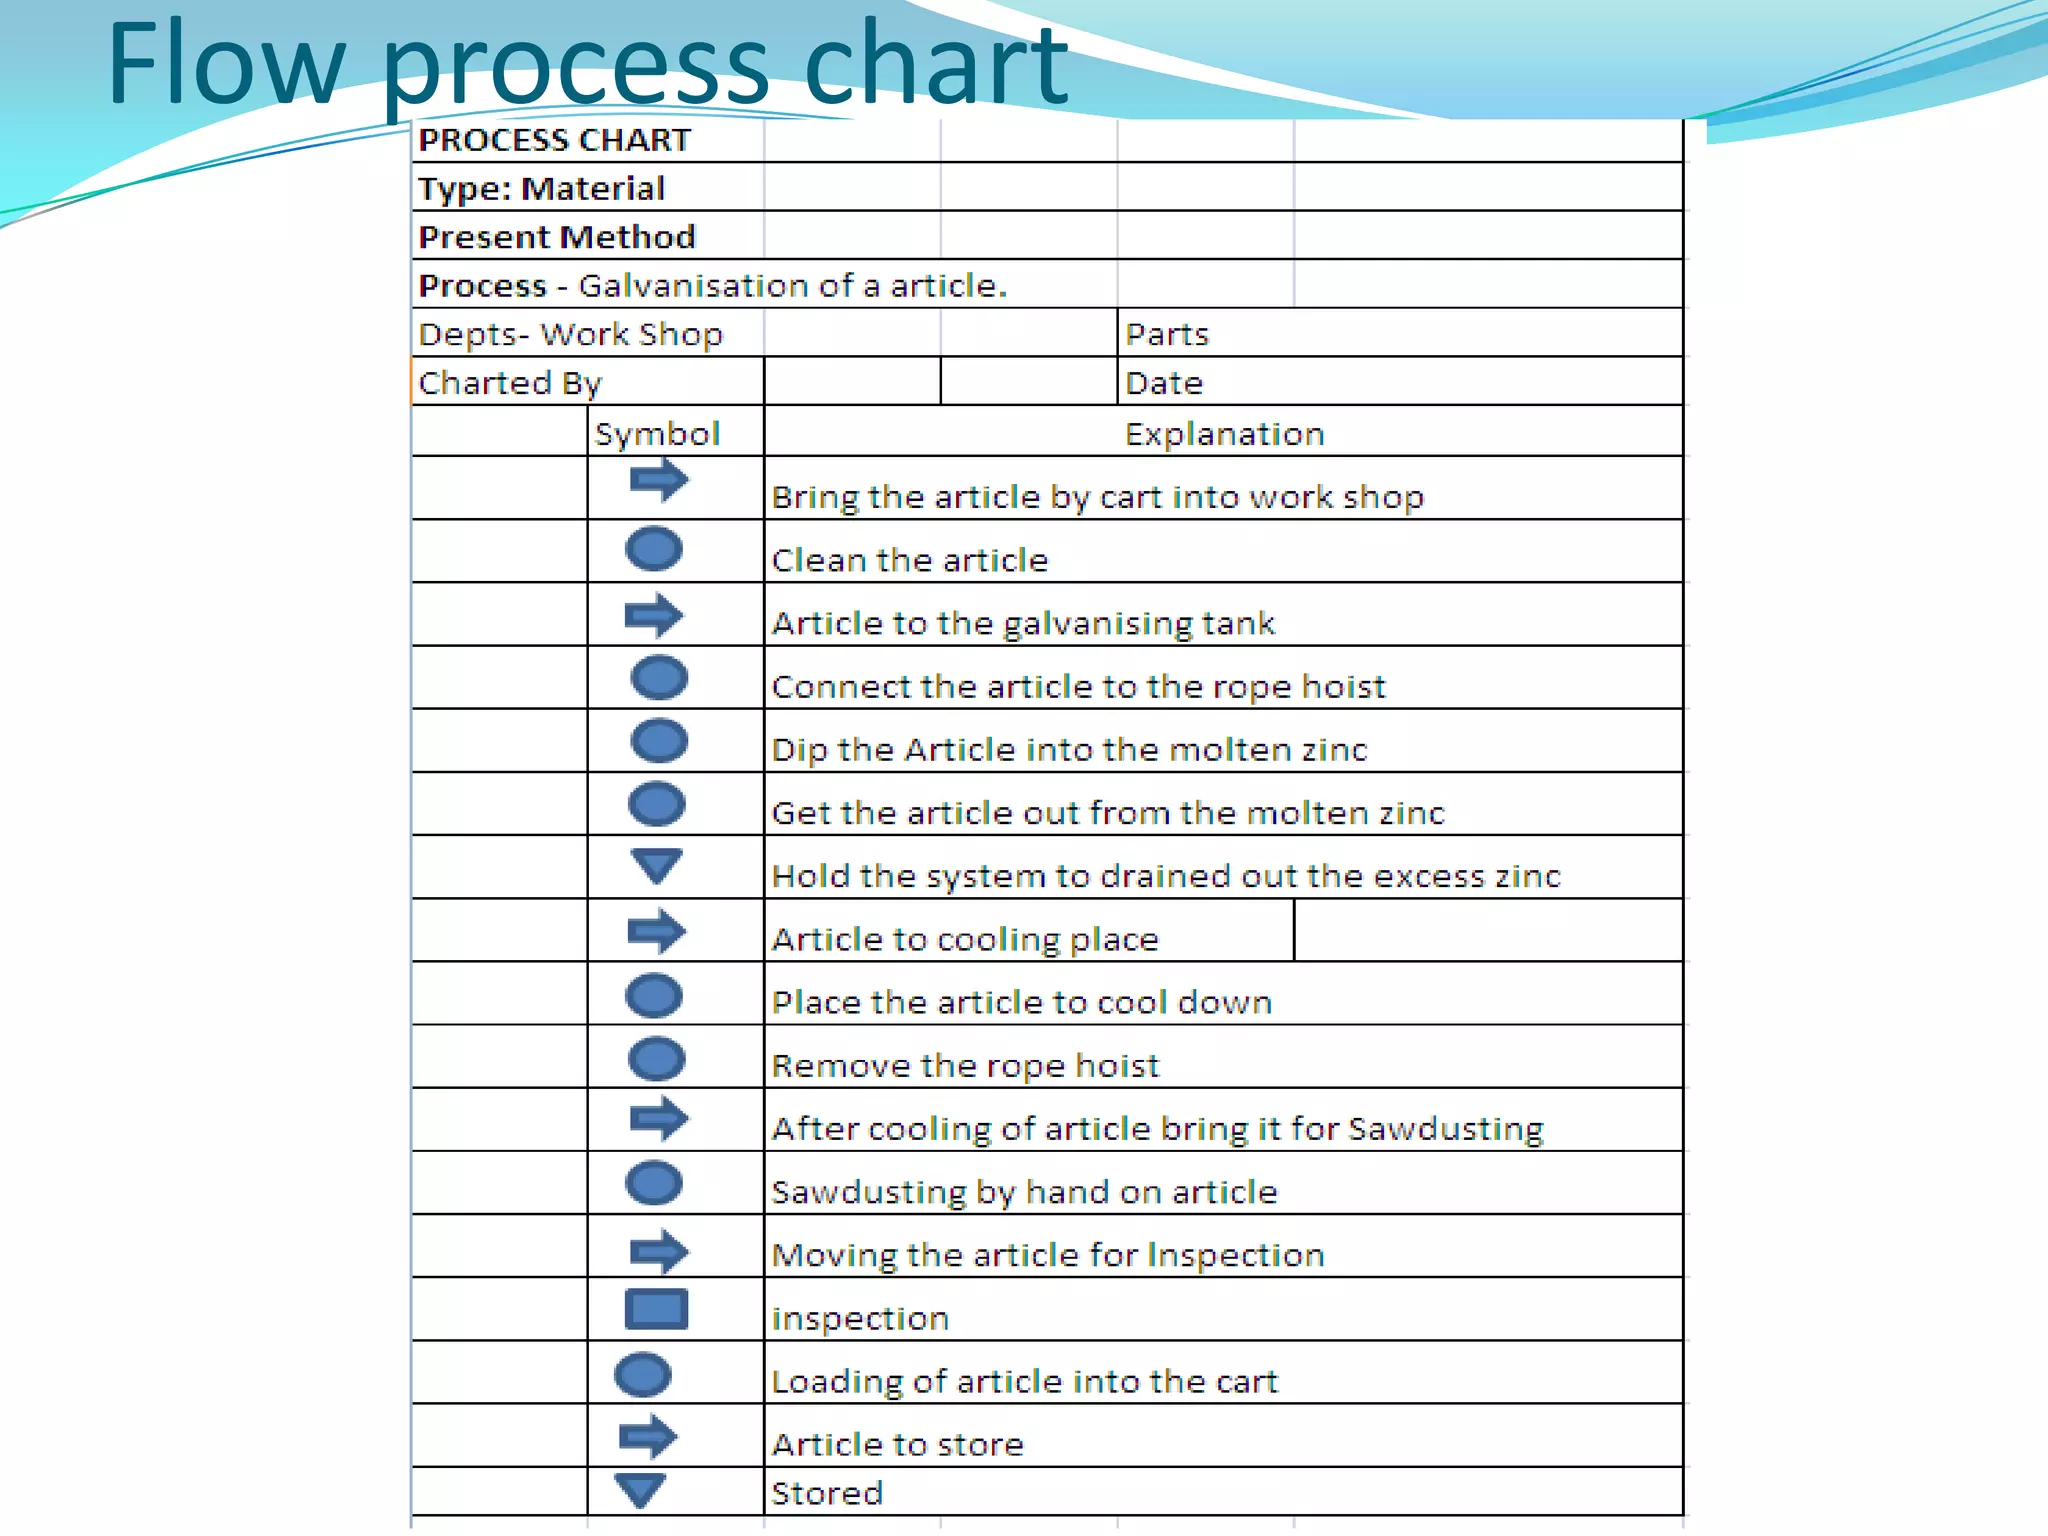
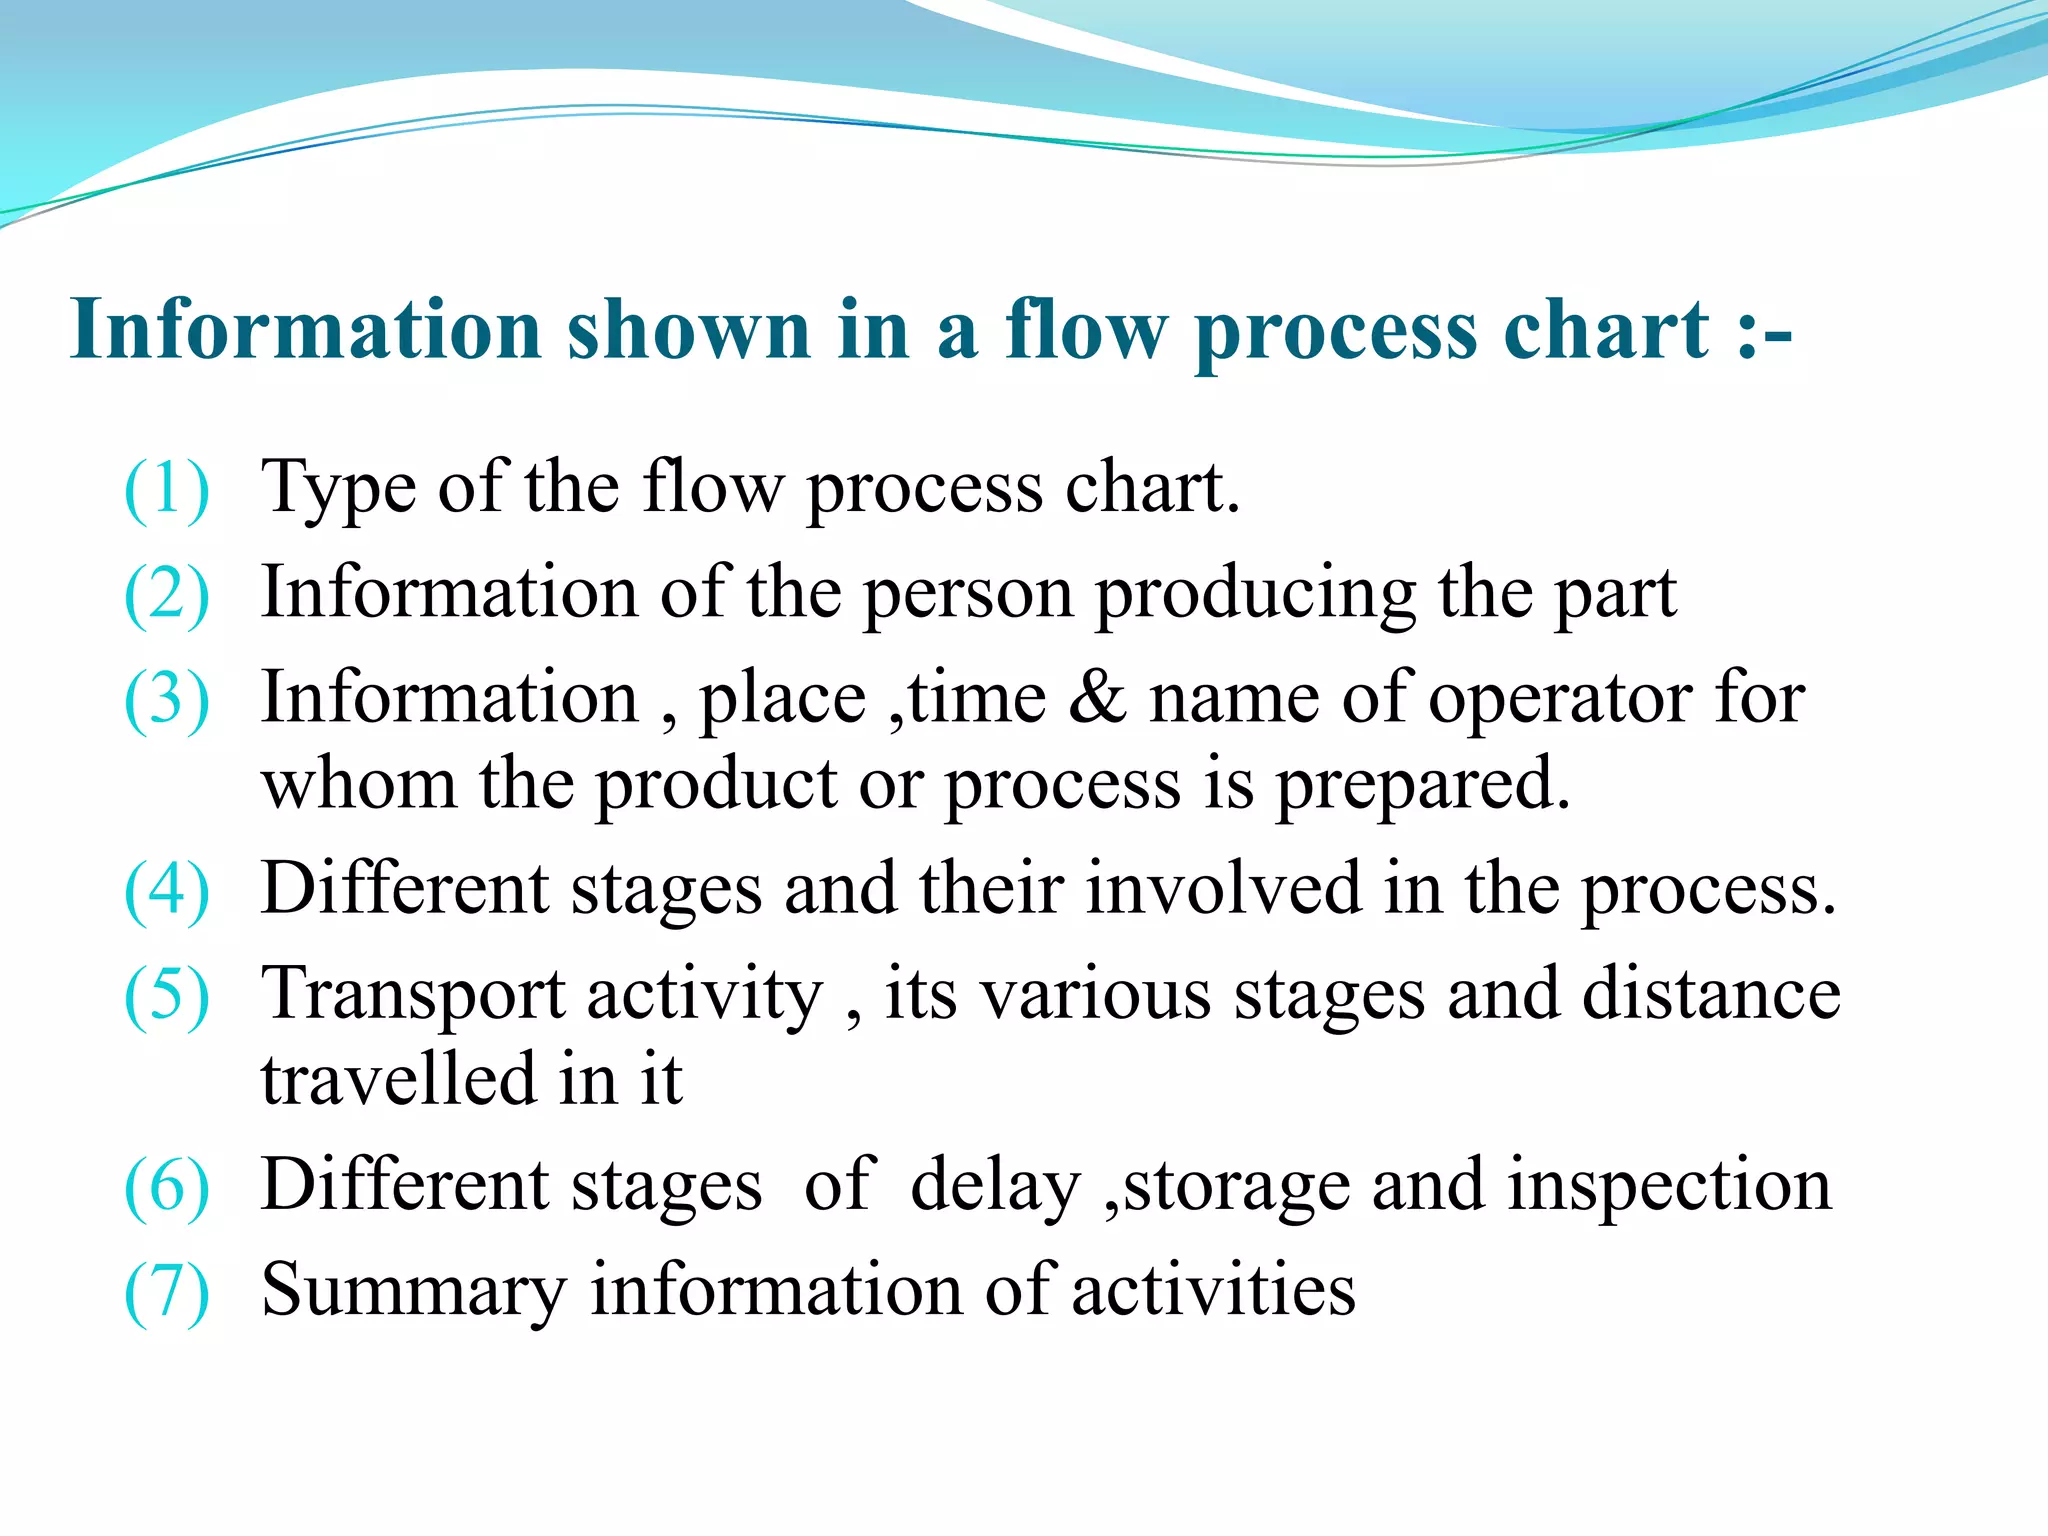

This document discusses flow process charts. It begins by explaining that a flow process chart provides a graphical presentation of all operations, inspections, delays, and storage that occur during a process, including necessary information like time required and quantity moved. It then describes the types of flow process charts for men, materials, and equipment. Several examples of flow process chart symbols are shown and explained. The document concludes by providing an example flow process chart for a typist's work and noting the key information typically shown in such charts.