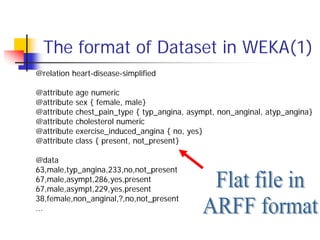
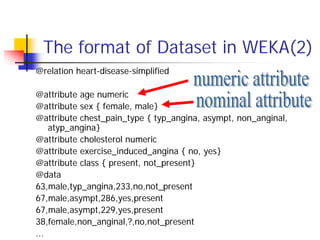
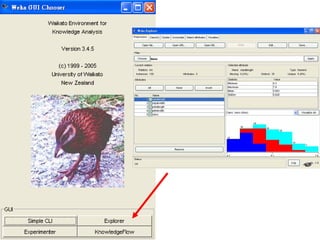
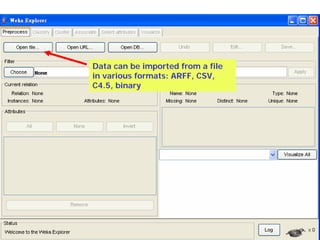
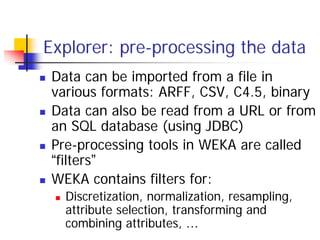
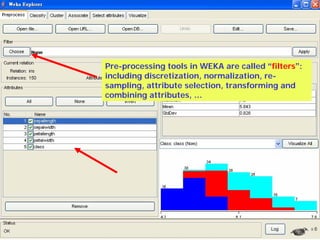
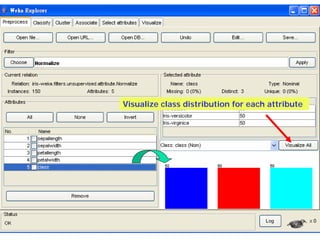
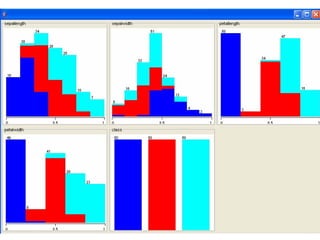
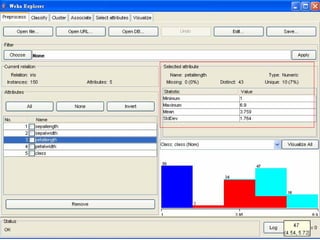
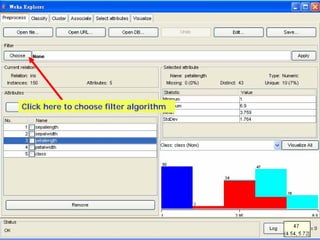
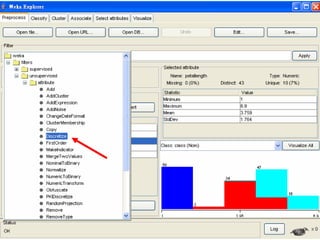
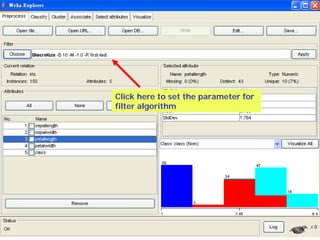
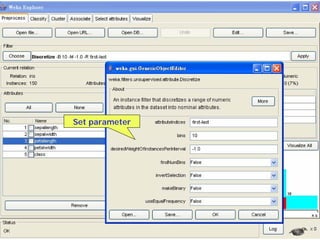
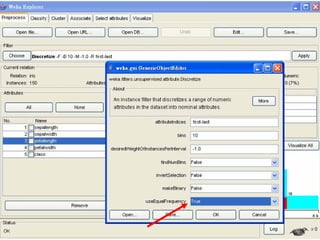
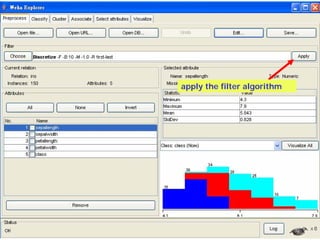
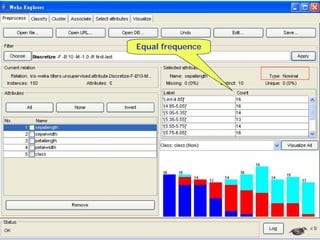
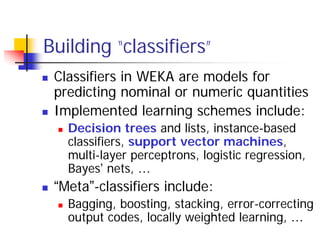
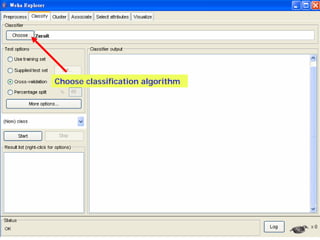
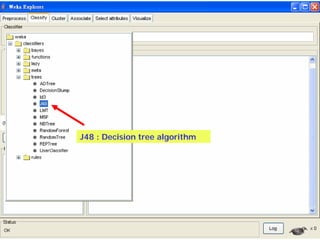
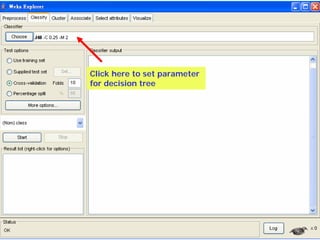
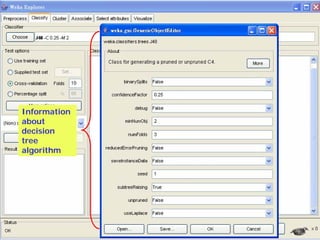
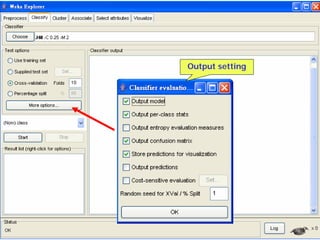
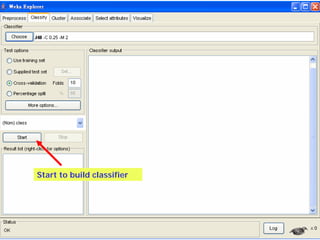
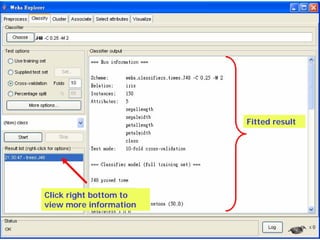
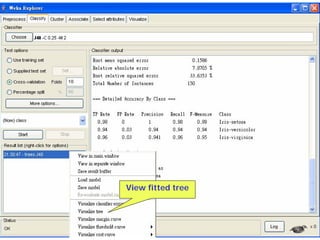
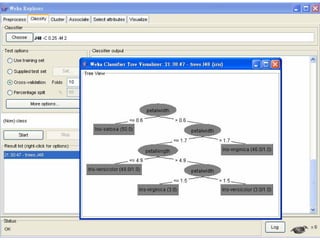
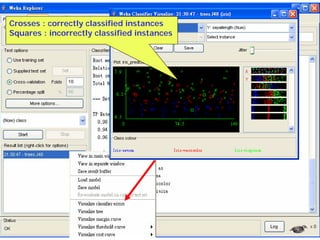
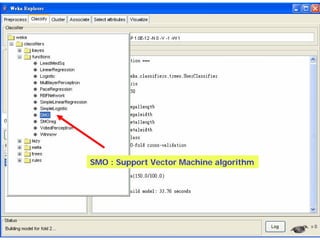
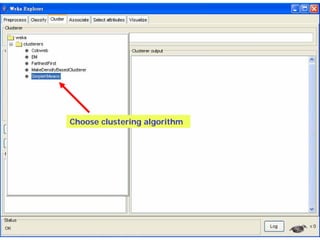
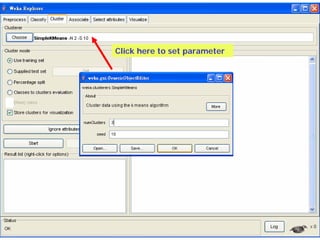
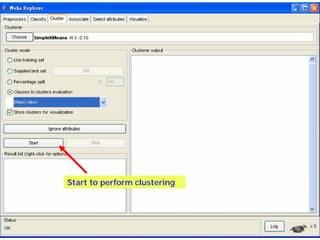
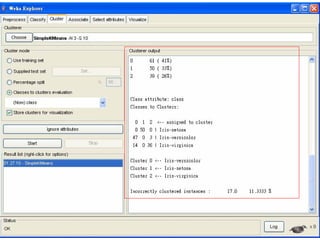
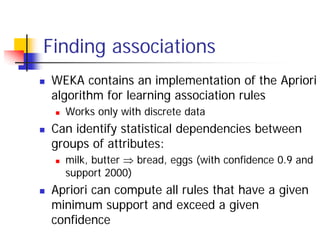
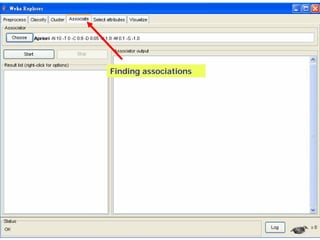
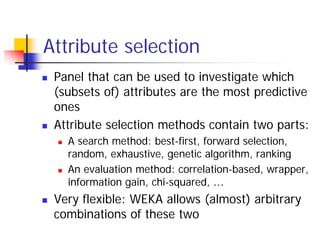
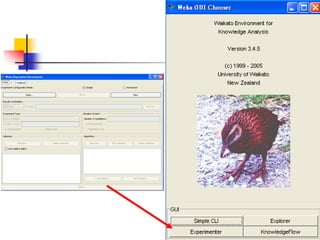
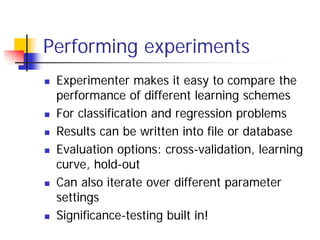
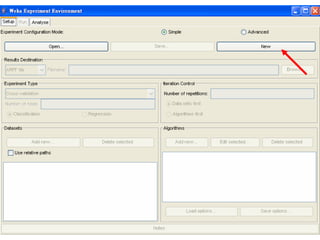
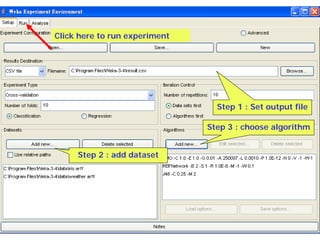
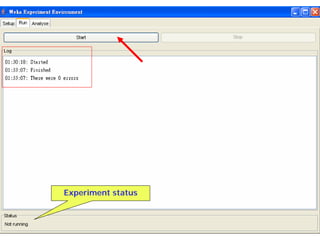
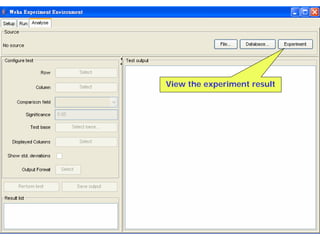
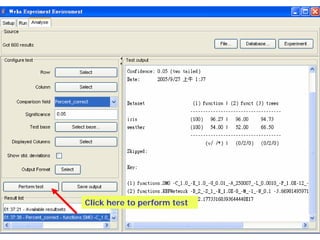
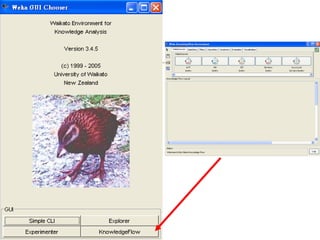
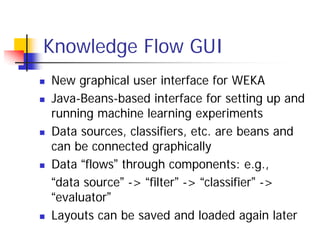
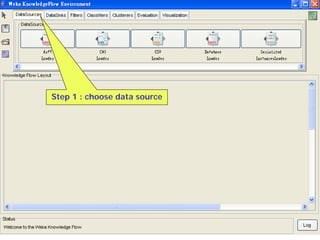
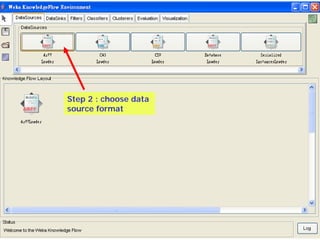
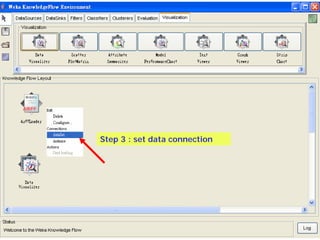
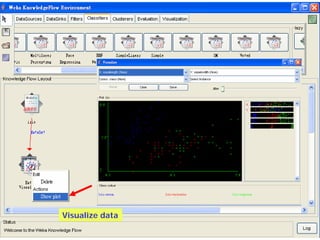
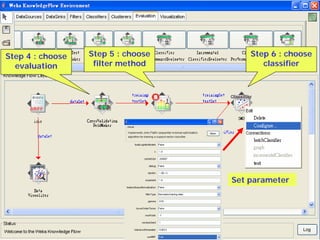
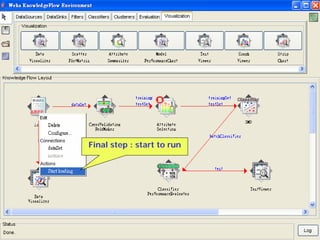
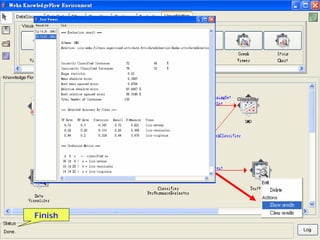
Machine Learning with WEKA
      An Introduction

                   林松江
                 2005/9/30
WEKA: the bird


     Copyright: Martin Kramer (mkramer@wxs.nl)
WEKA is available at
 http://www.cs.waikato.ac.nz/ml/weka/
The format of Dataset in WEKA(1)
@relation heart-disease-simplified

@attribute   age numeric
@attribute   sex { female, male}
@attribute   chest_pain_type { typ_angina, asympt, non_anginal, atyp_angina}
@attribute   cholesterol numeric
@attribute   exercise_induced_angina { no, yes}
@attribute   class { present, not_present}

@data
63,male,typ_angina,233,no,not_present
67,male,asympt,286,yes,present
67,male,asympt,229,yes,present
38,female,non_anginal,?,no,not_present
...
The format of Dataset in WEKA(2)
@relation heart-disease-simplified

@attribute age numeric
@attribute sex { female, male}
@attribute chest_pain_type { typ_angina, asympt, non_anginal,
    atyp_angina}
@attribute cholesterol numeric
@attribute exercise_induced_angina { no, yes}
@attribute class { present, not_present}
@data
63,male,typ_angina,233,no,not_present
67,male,asympt,286,yes,present
67,male,asympt,229,yes,present
38,female,non_anginal,?,no,not_present
...
Data can be imported from a file
in various formats: ARFF, CSV,
C4.5, binary
Explorer: pre-processing the data
 Data can be imported from a file in
 various formats: ARFF, CSV, C4.5, binary
 Data can also be read from a URL or from
 an SQL database (using JDBC)
 Pre-processing tools in WEKA are called
 “filters”
 WEKA contains filters for:
   Discretization, normalization, resampling,
   attribute selection, transforming and
   combining attributes, …
Pre-processing tools in WEKA are called “filters”:
including discretization, normalization, re-
sampling, attribute selection, transforming and
combining attributes, …
Visualize class distribution for each attribute
Click here to choose filter algorithm
Click here to set the parameter for
filter algorithm
Set parameter
apply the filter algorithm
Equal frequence
Building “classifiers”
 Classifiers in WEKA are models for
 predicting nominal or numeric quantities
 Implemented learning schemes include:
   Decision trees and lists, instance-based
   classifiers, support vector machines,
   multi-layer perceptrons, logistic regression,
   Bayes’ nets, …
 “Meta”-classifiers include:
   Bagging, boosting, stacking, error-correcting
   output codes, locally weighted learning, …
Choose classification algorithm
J48 : Decision tree algorithm
Click here to set parameter
for decision tree
Information
about
decision
tree
algorithm
Output setting
Start to build classifier
Fitted result


Click right bottom to
view more information
View fitted tree
Crosses : correctly classified instances
Squares : incorrectly classified instances
SMO : Support Vector Machine algorithm
Choose RBF kernel
Click right bottom
to view more
information
clustering data
 WEKA contains “clusterers” for finding
 groups of similar instances in a dataset
 Implemented schemes are:
   k-Means, EM, Cobweb, X-means,
   FarthestFirst
 Clusters can be visualized and compared
 to “true” clusters (if given)
 Evaluation based on loglikelihood if
 clustering scheme produces a probability
 distribution
clustering data
Choose clustering algorithm
Click here to set parameter
Start to perform clustering
View cluster
Click right bottom   assignments
to view more
information
Finding associations
WEKA contains an implementation of the Apriori
algorithm for learning association rules
  Works only with discrete data
Can identify statistical dependencies between
groups of attributes:
  milk, butter ⇒ bread, eggs (with confidence 0.9 and
  support 2000)
Apriori can compute all rules that have a given
minimum support and exceed a given
confidence
Finding associations
Attribute selection
 Panel that can be used to investigate which
 (subsets of) attributes are the most predictive
 ones
 Attribute selection methods contain two parts:
   A search method: best-first, forward selection,
   random, exhaustive, genetic algorithm, ranking
   An evaluation method: correlation-based, wrapper,
   information gain, chi-squared, …
 Very flexible: WEKA allows (almost) arbitrary
 combinations of these two
Choose attribute evalutor


Choose search
method
Data visualization
Visualization very useful in practice: e.g. helps
to determine difficulty of the learning problem
WEKA can visualize single attributes (1-d) and
pairs of attributes (2-d)
  To do: rotating 3-d visualizations (Xgobi-style)
Color-coded class values
“Jitter” option to deal with nominal attributes
(and to detect “hidden” data points)
“Zoom-in” function
Adjust view   Click here to view
 point size   single result
Choose range to magnify
local result
submit to magnify local result
Performing experiments
 Experimenter makes it easy to compare the
 performance of different learning schemes
 For classification and regression problems
 Results can be written into file or database
 Evaluation options: cross-validation, learning
 curve, hold-out
 Can also iterate over different parameter
 settings
 Significance-testing built in!
Click here to run experiment


                                 Step 1 : Set output file

                               Step 3 : choose algorithm


     Step 2 : add dataset
Experiment status
View the experiment result
Click here to perform test
Knowledge Flow GUI
New graphical user interface for WEKA
Java-Beans-based interface for setting up and
running machine learning experiments
Data sources, classifiers, etc. are beans and
can be connected graphically
Data “flows” through components: e.g.,
“data source” -> “filter” -> “classifier” ->
“evaluator”
Layouts can be saved and loaded again later
Step 1 : choose data source
Step 2 : choose data
source format
Step 3 : set data connection
Visualize data
Step 4 : choose   Step 5 : choose       Step 6 : choose
  evaluation       filter method           classifier


                                    Set parameter
Final step : start to run
Finish
Thank you

Machine Learning with WEKA

  • 1.
    Machine Learning withWEKA An Introduction 林松江 2005/9/30
  • 2.
    WEKA: the bird Copyright: Martin Kramer (mkramer@wxs.nl)
  • 3.
    WEKA is availableat http://www.cs.waikato.ac.nz/ml/weka/
  • 4.
    The format ofDataset in WEKA(1) @relation heart-disease-simplified @attribute age numeric @attribute sex { female, male} @attribute chest_pain_type { typ_angina, asympt, non_anginal, atyp_angina} @attribute cholesterol numeric @attribute exercise_induced_angina { no, yes} @attribute class { present, not_present} @data 63,male,typ_angina,233,no,not_present 67,male,asympt,286,yes,present 67,male,asympt,229,yes,present 38,female,non_anginal,?,no,not_present ...
  • 5.
    The format ofDataset in WEKA(2) @relation heart-disease-simplified @attribute age numeric @attribute sex { female, male} @attribute chest_pain_type { typ_angina, asympt, non_anginal, atyp_angina} @attribute cholesterol numeric @attribute exercise_induced_angina { no, yes} @attribute class { present, not_present} @data 63,male,typ_angina,233,no,not_present 67,male,asympt,286,yes,present 67,male,asympt,229,yes,present 38,female,non_anginal,?,no,not_present ...
  • 7.
    Data can beimported from a file in various formats: ARFF, CSV, C4.5, binary
  • 8.
    Explorer: pre-processing thedata Data can be imported from a file in various formats: ARFF, CSV, C4.5, binary Data can also be read from a URL or from an SQL database (using JDBC) Pre-processing tools in WEKA are called “filters” WEKA contains filters for: Discretization, normalization, resampling, attribute selection, transforming and combining attributes, …
  • 9.
    Pre-processing tools inWEKA are called “filters”: including discretization, normalization, re- sampling, attribute selection, transforming and combining attributes, …
  • 10.
    Visualize class distributionfor each attribute
  • 13.
    Click here tochoose filter algorithm
  • 15.
    Click here toset the parameter for filter algorithm
  • 16.
  • 18.
  • 19.
  • 20.
    Building “classifiers” Classifiersin WEKA are models for predicting nominal or numeric quantities Implemented learning schemes include: Decision trees and lists, instance-based classifiers, support vector machines, multi-layer perceptrons, logistic regression, Bayes’ nets, … “Meta”-classifiers include: Bagging, boosting, stacking, error-correcting output codes, locally weighted learning, …
  • 21.
  • 22.
    J48 : Decisiontree algorithm
  • 23.
    Click here toset parameter for decision tree
  • 24.
  • 25.
  • 26.
    Start to buildclassifier
  • 27.
    Fitted result Click rightbottom to view more information
  • 28.
  • 30.
    Crosses : correctlyclassified instances Squares : incorrectly classified instances
  • 31.
    SMO : SupportVector Machine algorithm
  • 32.
  • 33.
    Click right bottom toview more information
  • 34.
    clustering data WEKAcontains “clusterers” for finding groups of similar instances in a dataset Implemented schemes are: k-Means, EM, Cobweb, X-means, FarthestFirst Clusters can be visualized and compared to “true” clusters (if given) Evaluation based on loglikelihood if clustering scheme produces a probability distribution
  • 35.
  • 36.
  • 37.
    Click here toset parameter
  • 38.
    Start to performclustering
  • 40.
    View cluster Click rightbottom assignments to view more information
  • 41.
    Finding associations WEKA containsan implementation of the Apriori algorithm for learning association rules Works only with discrete data Can identify statistical dependencies between groups of attributes: milk, butter ⇒ bread, eggs (with confidence 0.9 and support 2000) Apriori can compute all rules that have a given minimum support and exceed a given confidence
  • 42.
  • 43.
    Attribute selection Panelthat can be used to investigate which (subsets of) attributes are the most predictive ones Attribute selection methods contain two parts: A search method: best-first, forward selection, random, exhaustive, genetic algorithm, ranking An evaluation method: correlation-based, wrapper, information gain, chi-squared, … Very flexible: WEKA allows (almost) arbitrary combinations of these two
  • 44.
  • 46.
    Data visualization Visualization veryuseful in practice: e.g. helps to determine difficulty of the learning problem WEKA can visualize single attributes (1-d) and pairs of attributes (2-d) To do: rotating 3-d visualizations (Xgobi-style) Color-coded class values “Jitter” option to deal with nominal attributes (and to detect “hidden” data points) “Zoom-in” function
  • 47.
    Adjust view Click here to view point size single result
  • 48.
    Choose range tomagnify local result
  • 49.
    submit to magnifylocal result
  • 51.
    Performing experiments Experimentermakes it easy to compare the performance of different learning schemes For classification and regression problems Results can be written into file or database Evaluation options: cross-validation, learning curve, hold-out Can also iterate over different parameter settings Significance-testing built in!
  • 53.
    Click here torun experiment Step 1 : Set output file Step 3 : choose algorithm Step 2 : add dataset
  • 54.
  • 55.
  • 56.
    Click here toperform test
  • 58.
    Knowledge Flow GUI Newgraphical user interface for WEKA Java-Beans-based interface for setting up and running machine learning experiments Data sources, classifiers, etc. are beans and can be connected graphically Data “flows” through components: e.g., “data source” -> “filter” -> “classifier” -> “evaluator” Layouts can be saved and loaded again later
  • 59.
    Step 1 :choose data source
  • 60.
    Step 2 :choose data source format
  • 61.
    Step 3 :set data connection
  • 62.
  • 63.
    Step 4 :choose Step 5 : choose Step 6 : choose evaluation filter method classifier Set parameter
  • 64.
    Final step :start to run
  • 65.
  • 66.