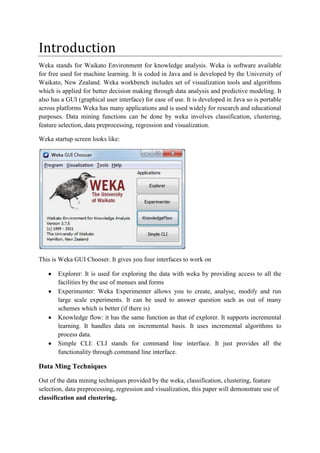
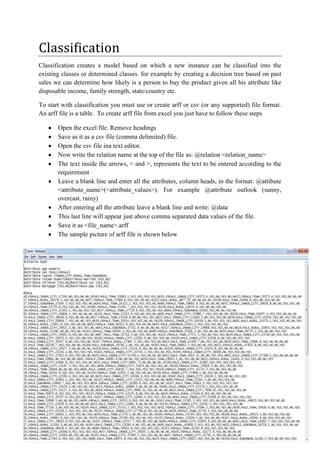
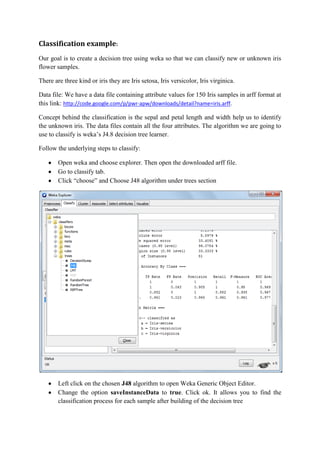
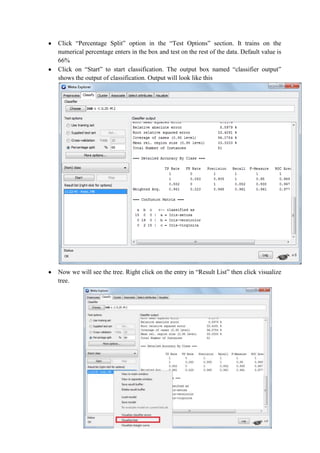
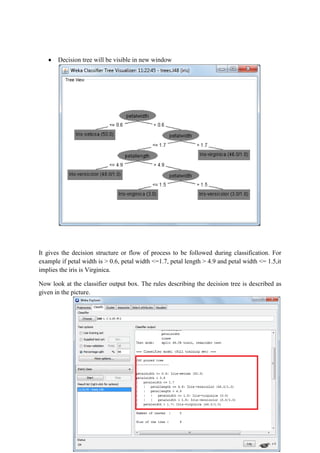
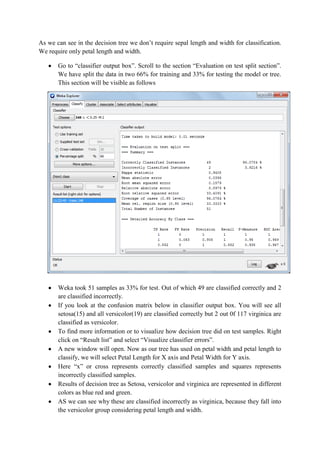
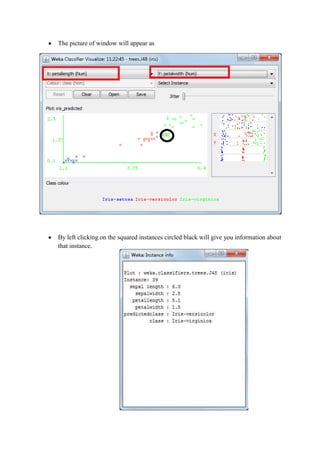
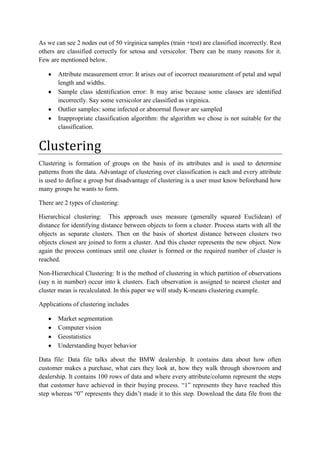
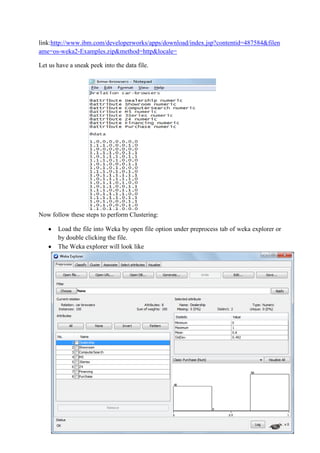
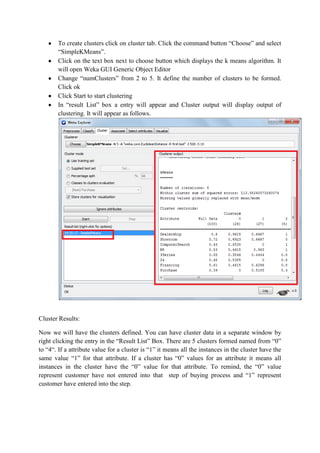
SlideShare a Scribd company logo
ITB TERM PAPER
                      Classification and Clutering


Nitin Kumar Rathore

        10BM60055
Introduction
Weka stands for Waikato Environment for knowledge analysis. Weka is software available
for free used for machine learning. It is coded in Java and is developed by the University of
Waikato, New Zealand. Weka workbench includes set of visualization tools and algorithms
which is applied for better decision making through data analysis and predictive modeling. It
also has a GUI (graphical user interface) for ease of use. It is developed in Java so is portable
across platforms Weka has many applications and is used widely for research and educational
purposes. Data mining functions can be done by weka involves classification, clustering,
feature selection, data preprocessing, regression and visualization.

Weka startup screen looks like:


This is Weka GUI Chooser. It gives you four interfaces to work on

       Explorer: It is used for exploring the data with weka by providing access to all the
       facilities by the use of menues and forms
       Experimenter: Weka Experimenter allows you to create, analyse, modify and run
       large scale experiments. It can be used to answer question such as out of many
       schemes which is better (if there is)
       Knowledge flow: it has the same function as that of explorer. It supports incremental
       learning. It handles data on incremental basis. It uses incremental algorithms to
       process data.
       Simple CLI: CLI stands for command line interface. It just provides all the
       functionality through command line interface.

Data Ming Techniques

Out of the data mining techniques provided by the weka, classification, clustering, feature
selection, data preprocessing, regression and visualization, this paper will demonstrate use of
classification and clustering.
Classification
Classification creates a model based on which a new instance can be classified into the
existing classes or determined classes. for example by creating a decision tree based on past
sales we can determine how likely is a person to buy the product given all his attribute like
disposable income, family strength, state/country etc.

To start with classification you must use or create arff or csv (or any supported) file format.
An arff file is a table. To create arff file from excel you just have to follow these steps

       Open the excel file. Remove headings
       Save as it as a csv file (comma delimited) file.
       Open the csv file ina text editor.
       Now write the relation name at the top of the file as: @relation <relation_name>
       The text inside the arrows, < and >, represents the text to be entered according to the
       requirement
       Leave a blank line and enter all the attributes, column heads, in the format: @attibute
       <attribute_name>(<attribute_values>). For example @attribute outlook (sunny,
       overcast, rainy)
       After entering all the attribute leave a blank line and write: @data
       This last line will appear just above comma separated data values of the file.
       Save it as <file_name>.arff
       The sample picture of arff file is shown below
Classification example:
Our goal is to create a decision tree using weka so that we can classify new or unknown iris
flower samples.

There are three kind or iris they are Iris setosa, Iris versicolor, Iris virginica.

Data file: We have a data file containing attribute values for 150 Iris samples in arff format at
this link: http://code.google.com/p/pwr-apw/downloads/detail?name=iris.arff.

Concept behind the classification is the sepal and petal length and width help us to identify
the unknown iris. The data files contain all the four attributes. The algorithm we are going to
use to classify is weka’s J4.8 decision tree learner.

Follow the underlying steps to classify:

        Open weka and choose explorer. Then open the downloaded arff file.
        Go to classify tab.
        Click “choose” and Choose J48 algorithm under trees section


        Left click on the chosen J48 algorithm to open Weka Generic Object Editor.
        Change the option saveInstanceData to true. Click ok. It allows you to find the
        classification process for each sample after building of the decision tree
Click “Percentage Split” option in the “Test Options” section. It trains on the
numerical percentage enters in the box and test on the rest of the data. Default value is
66%
Click on “Start” to start classification. The output box named “classifier output”
shows the output of classification. Output will look like this


Now we will see the tree. Right click on the entry in “Result List” then click visualize
tree.
Decision tree will be visible in new window


It gives the decision structure or flow of process to be followed during classification. For
example if petal width is > 0.6, petal width <=1.7, petal length > 4.9 and petal width <= 1.5,it
implies the iris is Virginica.

Now look at the classifier output box. The rules describing the decision tree is described as
given in the picture.
As we can see in the decision tree we don’t require sepal length and width for classification.
We require only petal length and width.

       Go to “classifier output box”. Scroll to the section “Evaluation on test split section”.
       We have split the data in two 66% for training and 33% for testing the model or tree.
       This section will be visible as follows


       Weka took 51 samples as 33% for test. Out of which 49 are classified correctly and 2
       are classified incorrectly.
       If you look at the confusion matrix below in classifier output box. You will see all
       setosa(15) and all versicolor(19) are classified correctly but 2 out 0f 117 virginica are
       classified as versicolor.
       To find more information or to visualize how decision tree did on test samples. Right
       click on “Result list” and select “Visualize classifier errors”.
       A new window will open. Now as our tree has used on petal width and petal length to
       classify, we will select Petal Length for X axis and Petal Width for Y axis.
       Here “x” or cross represents correctly classified samples and squares represents
       incorrectly classified samples.
       Results of decision tree as Setosa, versicolor and virginica are represented in different
       colors as blue red and green.
       AS we can see why these are classified incorrectly as virginica, because they fall into
       the versicolor group considering petal length and width.
The picture of window will appear as


By left clicking on the squared instances circled black will give you information about
that instance.
As we can see 2 nodes out of 50 virginica samples (train +test) are classified incorrectly. Rest
others are classified correctly for setosa and versicolor. There can be many reasons for it.
Few are mentioned below.

       Attribute measurement error: It arises out of incorrect measurement of petal and sepal
       length and widths.
       Sample class identification error: It may arise because some classes are identified
       incorrectly. Say some versicolor are classified as virginica.
       Outlier samples: some infected or abnormal flower are sampled
       Inappropriate classification algorithm: the algorithm we chose is not suitable for the
       classification.


Clustering
Clustering is formation of groups on the basis of its attributes and is used to determine
patterns from the data. Advantage of clustering over classification is each and every attribute
is used to define a group but disadvantage of clustering is a user must know beforehand how
many groups he wants to form.

There are 2 types of clustering:

Hierarchical clustering: This approach uses measure (generally squared Euclidean) of
distance for identifying distance between objects to form a cluster. Process starts with all the
objects as separate clusters. Then on the basis of shortest distance between clusters two
objects closest are joined to form a cluster. And this cluster represents the new object. Now
again the process continues until one cluster is formed or the required number of cluster is
reached.

Non-Hierarchical Clustering: It is the method of clustering in which partition of observations
(say n in number) occur into k clusters. Each observation is assigned to nearest cluster and
cluster mean is recalculated. In this paper we will study K-means clustering example.

Applications of clustering includes

       Market segmentation
       Computer vision
       Geostatistics
       Understanding buyer behavior

Data file: Data file talks about the BMW dealership. It contains data about how often
customer makes a purchase, what cars they look at, how they walk through showroom and
dealership. It contains 100 rows of data and where every attribute/column represent the steps
that customer have achieved in their buying process. “1” represents they have reached this
step whereas “0” represents they didn’t made it to this step. Download the data file from the
link:http://www.ibm.com/developerworks/apps/download/index.jsp?contentid=487584&filen
ame=os-weka2-Examples.zip&method=http&locale=

Let us have a sneak peek into the data file.


Now follow these steps to perform Clustering:

       Load the file into Weka by open file option under preprocess tab of weka explorer or
       by double clicking the file.
       The Weka explorer will look like
To create clusters click on cluster tab. Click the command button “Choose” and select
       “SimpleKMeans”.
       Click on the text box next to choose button which displays the k means algorithm. It
       will open Weka GUI Generic Object Editor
       Change “numClusters” from 2 to 5. It define the number of clusters to be formed.
       Click ok
       Click Start to start clustering
       In “result List” box a entry will appear and Cluster output will display output of
       clustering. It will appear as follows.


Cluster Results:

Now we will have the clusters defined. You can have cluster data in a separate window by
right clicking the entry in the “Result List” Box. There are 5 clusters formed named from “0”
to “4“. If a attribute value for a cluster is “1” it means all the instances in the cluster have the
same value “1” for that attribute. If a cluster has “0” values for an attribute it means all
instances in the cluster have the “0” value for that attribute. To remind, the “0” value
represent customer have not entered into that step of buying process and “1” represent
customer have entered into the step.
Clustered instances show how many instances belong to each cluster. Clustered instances is
the heading given in the cluster output. For example in cluster “0” it have 26 instances or
26% instances (as there are 100 rows no. of instances is equal to percentage)


The value for clusters in separate window is given in the picture below.


Interpreting the clusters

       Cluster 0: It represents the group of non purchasers, as they may look for dealership,
       look for cars in a showroom but when it comes to purchasing a car they do nothing.
       This group just adds to cost but doesn’t bring any revenue.
       Cluster 1: This group is attracted towards M5 as it is quite visible that go straight
       towards the M5s ignoring 3Series car and paying no heed at all to Z4. They even
don’t do the computer search. But as we can see this high footfall for does not bring
sales accordingly. The reason for medium sales should be unearthed. Say if customer
service is the problem we should increase the service quality over the M5 section by
training sales executive better or if lack of no. of sales personnel to cater every
customer is the problem we can provide more staff for the M5 section.
Cluster 2: This group just contains 5 instances out of 100. They can be called
“insignificant group”. They are not statistically important. We should not make any
conclusion from such an insignificant group. It indicates we may reduce the no. of
clusters
Cluster 3: This is the group of customers we can call “sure shot buyers”. Because
they will always buy a car. One thing to note is we should take care of their financing
as they always go for financing. They lookout showroom for available cars and also
do computer search for the available dealership. They generally don’t lookout for
3Series. It displays that we should make computer search for M5 and Z4 more visible
and attractive in search results.
Cluster 4: This group contains the ones that make least purchase after non-
purchasers. They are the new ones in the category, because they don’t look for
expensive cars like M5 instead lookout for 3Series. They walk into showrooms and
they don’t involve in computer search. As we can see 50 percent of them get to the
financing stage but only 32 percent end up buying a car. This means these are the
ones buying their first BMW and know exactly their requirement and hence their car
(3Series entry level model). They generally go for financing to afford the car. This
means to increase the sales we should increase the conversion ratio from financing
stage to purchasing stage. We should identify the problem there and take the
appropriate step. For example making financing easier by collaborating with bank. By
lowering the terms that repels customers.
REFERENCES

[1] Data mining by Jan H. witten, Eibe Frank and Mark A. Hall, 3rd edition, Morgan
Kaufman Publisher

[2]Tutorial for weka provided by university of Waikato, www.cs.waikato.ac.nz/ml/weka/

[3] Weka,Classification using decision trees based on Dr. Polczynski's Lecture, written by
Prof. Andrzej Kochanski and Prof Marcin Perzyk, Faculty of Production Engineering,
Warsaw            University         of          Technology,          Warsaw       Poland,
http://referensi.dosen.narotama.ac.id/files/2011/12/weka-tutorial-2.pdf

[4] Classification via Decision Trees in WEKA, Computer science, Telecommunications, and
Information                    systems,                  DePaul              University,
http://maya.cs.depaul.edu/classes/ect584/weka/classify.html

[5] Data mining with WEKA, Part 2: classification and clustering, IBM developer works
Michael       Abernethy,    http://www.ibm.com/developerworks/opensource/library/os-
weka2/index.html?ca=drs-

More Related Content

What's hot

Machine Learning Algorithms | Machine Learning Tutorial | Data Science Tutori...
Machine Learning Algorithms | Machine Learning Tutorial | Data Science Tutori...Machine Learning Algorithms | Machine Learning Tutorial | Data Science Tutori...
Machine Learning Algorithms | Machine Learning Tutorial | Data Science Tutori...
Edureka!
 
Introduction To XL-Miner
Introduction To XL-MinerIntroduction To XL-Miner
Introduction To XL-Miner
DataminingTools Inc
 
Customer churn classification using machine learning techniques
Customer churn classification using machine learning techniquesCustomer churn classification using machine learning techniques
Customer churn classification using machine learning techniques
SindhujanDhayalan
 
Knowledge discovery thru data mining
Knowledge discovery thru data miningKnowledge discovery thru data mining
Knowledge discovery thru data mining
Devakumar Jain
 
Online library management system
Online library management systemOnline library management system
Online library management system
Bharat Kunwar
 
Online shopping prasentation
Online shopping prasentationOnline shopping prasentation
Online shopping prasentation
Atul Kumar
 
library management system
library management systemlibrary management system
library management systemprabhat kumar
 
Support vector-machines-presentation
Support vector-machines-presentationSupport vector-machines-presentation
Support vector-machines-presentation
ATWIINE Simon Alex
 
Customer Churn Prediction Using Machine Learning Techniques: the case of Lion...
Customer Churn Prediction Using Machine Learning Techniques: the case of Lion...Customer Churn Prediction Using Machine Learning Techniques: the case of Lion...
Customer Churn Prediction Using Machine Learning Techniques: the case of Lion...
IIJSRJournal
 
Library Management System
Library Management SystemLibrary Management System
Library Management System
Pankaj Kumar
 
11.project online library management system
11.project online library management system11.project online library management system
11.project online library management systemmonika ahalawat
 
Library Management System
Library Management SystemLibrary Management System
Library Management System
Martins Okoi
 
Build, train and deploy ML models at scale.pdf
Build, train and deploy ML models at scale.pdfBuild, train and deploy ML models at scale.pdf
Build, train and deploy ML models at scale.pdf
Amazon Web Services
 
E farming management system project ppt
E farming management system project pptE farming management system project ppt
E farming management system project ppt
nandinim26
 
Implement principal component analysis (PCA) in python from scratch
Implement principal component analysis (PCA) in python from scratchImplement principal component analysis (PCA) in python from scratch
Implement principal component analysis (PCA) in python from scratch
EshanAgarwal4
 
Library management system presentation
Library management system presentation Library management system presentation
Library management system presentation
Smit Patel
 
Support vector machines
Support vector machinesSupport vector machines
Support vector machines
manaswinimysore
 
Online learning system - Slideshare by jayed hossain jibon
Online learning system - Slideshare by  jayed hossain jibonOnline learning system - Slideshare by  jayed hossain jibon
Online learning system - Slideshare by jayed hossain jibon
Jayed Hossain Jibon
 
Ml2 train test-splits_validation_linear_regression
Ml2 train test-splits_validation_linear_regressionMl2 train test-splits_validation_linear_regression
Ml2 train test-splits_validation_linear_regression
ankit_ppt
 
Canteen management system Documentation
Canteen management system DocumentationCanteen management system Documentation
Canteen management system Documentation
rimshailyas1
 

What's hot (20)

Machine Learning Algorithms | Machine Learning Tutorial | Data Science Tutori...
Machine Learning Algorithms | Machine Learning Tutorial | Data Science Tutori...Machine Learning Algorithms | Machine Learning Tutorial | Data Science Tutori...
Machine Learning Algorithms | Machine Learning Tutorial | Data Science Tutori...
 
Introduction To XL-Miner
Introduction To XL-MinerIntroduction To XL-Miner
Introduction To XL-Miner
 
Customer churn classification using machine learning techniques
Customer churn classification using machine learning techniquesCustomer churn classification using machine learning techniques
Customer churn classification using machine learning techniques
 
Knowledge discovery thru data mining
Knowledge discovery thru data miningKnowledge discovery thru data mining
Knowledge discovery thru data mining
 
Online library management system
Online library management systemOnline library management system
Online library management system
 
Online shopping prasentation
Online shopping prasentationOnline shopping prasentation
Online shopping prasentation
 
library management system
library management systemlibrary management system
library management system
 
Support vector-machines-presentation
Support vector-machines-presentationSupport vector-machines-presentation
Support vector-machines-presentation
 
Customer Churn Prediction Using Machine Learning Techniques: the case of Lion...
Customer Churn Prediction Using Machine Learning Techniques: the case of Lion...Customer Churn Prediction Using Machine Learning Techniques: the case of Lion...
Customer Churn Prediction Using Machine Learning Techniques: the case of Lion...
 
Library Management System
Library Management SystemLibrary Management System
Library Management System
 
11.project online library management system
11.project online library management system11.project online library management system
11.project online library management system
 
Library Management System
Library Management SystemLibrary Management System
Library Management System
 
Build, train and deploy ML models at scale.pdf
Build, train and deploy ML models at scale.pdfBuild, train and deploy ML models at scale.pdf
Build, train and deploy ML models at scale.pdf
 
E farming management system project ppt
E farming management system project pptE farming management system project ppt
E farming management system project ppt
 
Implement principal component analysis (PCA) in python from scratch
Implement principal component analysis (PCA) in python from scratchImplement principal component analysis (PCA) in python from scratch
Implement principal component analysis (PCA) in python from scratch
 
Library management system presentation
Library management system presentation Library management system presentation
Library management system presentation
 
Support vector machines
Support vector machinesSupport vector machines
Support vector machines
 
Online learning system - Slideshare by jayed hossain jibon
Online learning system - Slideshare by  jayed hossain jibonOnline learning system - Slideshare by  jayed hossain jibon
Online learning system - Slideshare by jayed hossain jibon
 
Ml2 train test-splits_validation_linear_regression
Ml2 train test-splits_validation_linear_regressionMl2 train test-splits_validation_linear_regression
Ml2 train test-splits_validation_linear_regression
 
Canteen management system Documentation
Canteen management system DocumentationCanteen management system Documentation
Canteen management system Documentation
 

Viewers also liked

Data Mining using Weka
Data Mining using WekaData Mining using Weka
Data Mining using Weka
Shashidhar Shenoy
 
An Introduction To Weka
An Introduction To WekaAn Introduction To Weka
An Introduction To Weka
weka Content
 
Weka presentation
Weka presentationWeka presentation
Weka presentationSaeed Iqbal
 
WEKA Tutorial
WEKA TutorialWEKA Tutorial
WEKA Tutorialbutest
 
Classification and Clustering Analysis using Weka
Classification and Clustering Analysis using Weka Classification and Clustering Analysis using Weka
Classification and Clustering Analysis using Weka
Ishan Awadhesh
 
Weka project - Classification & Association Rule Generation
Weka project - Classification & Association Rule GenerationWeka project - Classification & Association Rule Generation
Weka project - Classification & Association Rule Generation
rsathishwaran
 
WEKA: Data Mining Input Concepts Instances And Attributes
WEKA: Data Mining Input Concepts Instances And AttributesWEKA: Data Mining Input Concepts Instances And Attributes
WEKA: Data Mining Input Concepts Instances And Attributes
DataminingTools Inc
 
Data mining tools (R , WEKA, RAPID MINER, ORANGE)
Data mining tools (R , WEKA, RAPID MINER, ORANGE)Data mining tools (R , WEKA, RAPID MINER, ORANGE)
Data mining tools (R , WEKA, RAPID MINER, ORANGE)
Krishna Petrochemicals
 
WEKA: The Knowledge Flow Interface
WEKA: The Knowledge Flow InterfaceWEKA: The Knowledge Flow Interface
WEKA: The Knowledge Flow Interface
DataminingTools Inc
 
Aula pratica k-means-rp2009
Aula pratica k-means-rp2009Aula pratica k-means-rp2009
Aula pratica k-means-rp2009Marcelo Silva
 
Instructivo para inscribirse en el PROCADO
Instructivo para inscribirse en el PROCADOInstructivo para inscribirse en el PROCADO
Instructivo para inscribirse en el PROCADOUNLa
 
Project Weka
Project WekaProject Weka
Project Weka
KukKik Kf
 
Weka Project
Weka ProjectWeka Project
Weka Project
KukKik Kf
 
2. visualization in data mining
2. visualization in data mining2. visualization in data mining
2. visualization in data mining
Azad public school
 
Weka a tool_for_exploratory_data_mining
Weka a tool_for_exploratory_data_miningWeka a tool_for_exploratory_data_mining
Weka a tool_for_exploratory_data_miningTony Frame
 
RapidMiner: Performance Validation And Visualization
RapidMiner:  Performance Validation And VisualizationRapidMiner:  Performance Validation And Visualization
RapidMiner: Performance Validation And Visualization
Rapidmining Content
 
Sesión mat resolvemos problemas de equilibrio copia
Sesión mat resolvemos problemas de equilibrio   copiaSesión mat resolvemos problemas de equilibrio   copia
Sesión mat resolvemos problemas de equilibrio copia
SOTO ZOTITO
 
WEKA:Output Knowledge Representation
WEKA:Output Knowledge RepresentationWEKA:Output Knowledge Representation
WEKA:Output Knowledge Representation
weka Content
 
Weka_Manual_Sagar
Weka_Manual_SagarWeka_Manual_Sagar
Weka_Manual_SagarSagar Kumar
 
WEKA:Data Mining Input Concepts Instances And Attributes
WEKA:Data Mining Input Concepts Instances And AttributesWEKA:Data Mining Input Concepts Instances And Attributes
WEKA:Data Mining Input Concepts Instances And Attributes
weka Content
 

Viewers also liked (20)

Data Mining using Weka
Data Mining using WekaData Mining using Weka
Data Mining using Weka
 
An Introduction To Weka
An Introduction To WekaAn Introduction To Weka
An Introduction To Weka
 
Weka presentation
Weka presentationWeka presentation
Weka presentation
 
WEKA Tutorial
WEKA TutorialWEKA Tutorial
WEKA Tutorial
 
Classification and Clustering Analysis using Weka
Classification and Clustering Analysis using Weka Classification and Clustering Analysis using Weka
Classification and Clustering Analysis using Weka
 
Weka project - Classification & Association Rule Generation
Weka project - Classification & Association Rule GenerationWeka project - Classification & Association Rule Generation
Weka project - Classification & Association Rule Generation
 
WEKA: Data Mining Input Concepts Instances And Attributes
WEKA: Data Mining Input Concepts Instances And AttributesWEKA: Data Mining Input Concepts Instances And Attributes
WEKA: Data Mining Input Concepts Instances And Attributes
 
Data mining tools (R , WEKA, RAPID MINER, ORANGE)
Data mining tools (R , WEKA, RAPID MINER, ORANGE)Data mining tools (R , WEKA, RAPID MINER, ORANGE)
Data mining tools (R , WEKA, RAPID MINER, ORANGE)
 
WEKA: The Knowledge Flow Interface
WEKA: The Knowledge Flow InterfaceWEKA: The Knowledge Flow Interface
WEKA: The Knowledge Flow Interface
 
Aula pratica k-means-rp2009
Aula pratica k-means-rp2009Aula pratica k-means-rp2009
Aula pratica k-means-rp2009
 
Instructivo para inscribirse en el PROCADO
Instructivo para inscribirse en el PROCADOInstructivo para inscribirse en el PROCADO
Instructivo para inscribirse en el PROCADO
 
Project Weka
Project WekaProject Weka
Project Weka
 
Weka Project
Weka ProjectWeka Project
Weka Project
 
2. visualization in data mining
2. visualization in data mining2. visualization in data mining
2. visualization in data mining
 
Weka a tool_for_exploratory_data_mining
Weka a tool_for_exploratory_data_miningWeka a tool_for_exploratory_data_mining
Weka a tool_for_exploratory_data_mining
 
RapidMiner: Performance Validation And Visualization
RapidMiner:  Performance Validation And VisualizationRapidMiner:  Performance Validation And Visualization
RapidMiner: Performance Validation And Visualization
 
Sesión mat resolvemos problemas de equilibrio copia
Sesión mat resolvemos problemas de equilibrio   copiaSesión mat resolvemos problemas de equilibrio   copia
Sesión mat resolvemos problemas de equilibrio copia
 
WEKA:Output Knowledge Representation
WEKA:Output Knowledge RepresentationWEKA:Output Knowledge Representation
WEKA:Output Knowledge Representation
 
Weka_Manual_Sagar
Weka_Manual_SagarWeka_Manual_Sagar
Weka_Manual_Sagar
 
WEKA:Data Mining Input Concepts Instances And Attributes
WEKA:Data Mining Input Concepts Instances And AttributesWEKA:Data Mining Input Concepts Instances And Attributes
WEKA:Data Mining Input Concepts Instances And Attributes
 

Similar to Data mining techniques using weka

Weka Term Paper_VGSoM_10BM60011
Weka Term Paper_VGSoM_10BM60011Weka Term Paper_VGSoM_10BM60011
Weka Term Paper_VGSoM_10BM60011
Amu Singh
 
Weka
Weka Weka
Weka term paper(siddharth 10 bm60086)
Weka term paper(siddharth 10 bm60086)Weka term paper(siddharth 10 bm60086)
Weka term paper(siddharth 10 bm60086)
Siddharth Verma
 
Root cause of community problem for this discussion, you will i
Root cause of community problem for this discussion, you will iRoot cause of community problem for this discussion, you will i
Root cause of community problem for this discussion, you will i
ssusere73ce3
 
DATA MINING on WEKA
DATA MINING on WEKADATA MINING on WEKA
DATA MINING on WEKAsatyamkhatri
 
Machine Learning with WEKA
Machine Learning with WEKAMachine Learning with WEKA
Machine Learning with WEKAbutest
 
Feature extraction for classifying students based on theirac ademic performance
Feature extraction for classifying students based on theirac ademic performanceFeature extraction for classifying students based on theirac ademic performance
Feature extraction for classifying students based on theirac ademic performance
Venkat Projects
 
data mining with weka application
data mining with weka applicationdata mining with weka application
data mining with weka application
Rezapourabbas
 
Know How to Create and Visualize a Decision Tree with Python.pdf
Know How to Create and Visualize a Decision Tree with Python.pdfKnow How to Create and Visualize a Decision Tree with Python.pdf
Know How to Create and Visualize a Decision Tree with Python.pdf
Data Science Council of America
 
Introduction to weka
Introduction to wekaIntroduction to weka
Introduction to weka
JK Knowledge
 
Excel Datamining Addin Advanced
Excel Datamining Addin AdvancedExcel Datamining Addin Advanced
Excel Datamining Addin Advanced
excel content
 
Excel Datamining Addin Advanced
Excel Datamining Addin AdvancedExcel Datamining Addin Advanced
Excel Datamining Addin Advanced
DataminingTools Inc
 
Machine learning and decision trees
Machine learning and decision treesMachine learning and decision trees
Machine learning and decision trees
Padma Metta
 
Clustering
ClusteringClustering
Clustering
Meme Hei
 
Alacart Poor man's classification trees
Alacart Poor man's classification treesAlacart Poor man's classification trees
Alacart Poor man's classification trees
Leonardo Auslender
 
Advanced Excel Technologies In Early Development Applications
Advanced Excel Technologies In Early Development ApplicationsAdvanced Excel Technologies In Early Development Applications
Advanced Excel Technologies In Early Development Applications
Brian Bissett
 
Observations
ObservationsObservations
Observationsbutest
 
Lx3520322036
Lx3520322036Lx3520322036
Lx3520322036
IJERA Editor
 

Similar to Data mining techniques using weka (20)

Itb weka
Itb wekaItb weka
Itb weka
 
Itb weka nikhil
Itb weka nikhilItb weka nikhil
Itb weka nikhil
 
Weka Term Paper_VGSoM_10BM60011
Weka Term Paper_VGSoM_10BM60011Weka Term Paper_VGSoM_10BM60011
Weka Term Paper_VGSoM_10BM60011
 
Weka
Weka Weka
Weka
 
Weka term paper(siddharth 10 bm60086)
Weka term paper(siddharth 10 bm60086)Weka term paper(siddharth 10 bm60086)
Weka term paper(siddharth 10 bm60086)
 
Root cause of community problem for this discussion, you will i
Root cause of community problem for this discussion, you will iRoot cause of community problem for this discussion, you will i
Root cause of community problem for this discussion, you will i
 
DATA MINING on WEKA
DATA MINING on WEKADATA MINING on WEKA
DATA MINING on WEKA
 
Machine Learning with WEKA
Machine Learning with WEKAMachine Learning with WEKA
Machine Learning with WEKA
 
Feature extraction for classifying students based on theirac ademic performance
Feature extraction for classifying students based on theirac ademic performanceFeature extraction for classifying students based on theirac ademic performance
Feature extraction for classifying students based on theirac ademic performance
 
data mining with weka application
data mining with weka applicationdata mining with weka application
data mining with weka application
 
Know How to Create and Visualize a Decision Tree with Python.pdf
Know How to Create and Visualize a Decision Tree with Python.pdfKnow How to Create and Visualize a Decision Tree with Python.pdf
Know How to Create and Visualize a Decision Tree with Python.pdf
 
Introduction to weka
Introduction to wekaIntroduction to weka
Introduction to weka
 
Excel Datamining Addin Advanced
Excel Datamining Addin AdvancedExcel Datamining Addin Advanced
Excel Datamining Addin Advanced
 
Excel Datamining Addin Advanced
Excel Datamining Addin AdvancedExcel Datamining Addin Advanced
Excel Datamining Addin Advanced
 
Machine learning and decision trees
Machine learning and decision treesMachine learning and decision trees
Machine learning and decision trees
 
Clustering
ClusteringClustering
Clustering
 
Alacart Poor man's classification trees
Alacart Poor man's classification treesAlacart Poor man's classification trees
Alacart Poor man's classification trees
 
Advanced Excel Technologies In Early Development Applications
Advanced Excel Technologies In Early Development ApplicationsAdvanced Excel Technologies In Early Development Applications
Advanced Excel Technologies In Early Development Applications
 
Observations
ObservationsObservations
Observations
 
Lx3520322036
Lx3520322036Lx3520322036
Lx3520322036
 

Recently uploaded

The Accursed House by Émile Gaboriau.pptx
The Accursed House by Émile Gaboriau.pptxThe Accursed House by Émile Gaboriau.pptx
The Accursed House by Émile Gaboriau.pptx
DhatriParmar
 
STRAND 3 HYGIENIC PRACTICES.pptx GRADE 7 CBC
STRAND 3 HYGIENIC PRACTICES.pptx GRADE 7 CBCSTRAND 3 HYGIENIC PRACTICES.pptx GRADE 7 CBC
STRAND 3 HYGIENIC PRACTICES.pptx GRADE 7 CBC
kimdan468
 
Mule 4.6 & Java 17 Upgrade | MuleSoft Mysore Meetup #46
Mule 4.6 & Java 17 Upgrade | MuleSoft Mysore Meetup #46Mule 4.6 & Java 17 Upgrade | MuleSoft Mysore Meetup #46
Mule 4.6 & Java 17 Upgrade | MuleSoft Mysore Meetup #46
MysoreMuleSoftMeetup
 
Unit 8 - Information and Communication Technology (Paper I).pdf
Unit 8 - Information and Communication Technology (Paper I).pdfUnit 8 - Information and Communication Technology (Paper I).pdf
Unit 8 - Information and Communication Technology (Paper I).pdf
Thiyagu K
 
Synthetic Fiber Construction in lab .pptx
Synthetic Fiber Construction in lab .pptxSynthetic Fiber Construction in lab .pptx
Synthetic Fiber Construction in lab .pptx
Pavel ( NSTU)
 
The approach at University of Liverpool.pptx
The approach at University of Liverpool.pptxThe approach at University of Liverpool.pptx
The approach at University of Liverpool.pptx
Jisc
 
BÀI TẬP BỔ TRỢ TIẾNG ANH GLOBAL SUCCESS LỚP 3 - CẢ NĂM (CÓ FILE NGHE VÀ ĐÁP Á...
BÀI TẬP BỔ TRỢ TIẾNG ANH GLOBAL SUCCESS LỚP 3 - CẢ NĂM (CÓ FILE NGHE VÀ ĐÁP Á...BÀI TẬP BỔ TRỢ TIẾNG ANH GLOBAL SUCCESS LỚP 3 - CẢ NĂM (CÓ FILE NGHE VÀ ĐÁP Á...
BÀI TẬP BỔ TRỢ TIẾNG ANH GLOBAL SUCCESS LỚP 3 - CẢ NĂM (CÓ FILE NGHE VÀ ĐÁP Á...
Nguyen Thanh Tu Collection
 
How libraries can support authors with open access requirements for UKRI fund...
How libraries can support authors with open access requirements for UKRI fund...How libraries can support authors with open access requirements for UKRI fund...
How libraries can support authors with open access requirements for UKRI fund...
Jisc
 
The Diamond Necklace by Guy De Maupassant.pptx
The Diamond Necklace by Guy De Maupassant.pptxThe Diamond Necklace by Guy De Maupassant.pptx
The Diamond Necklace by Guy De Maupassant.pptx
DhatriParmar
 
Pride Month Slides 2024 David Douglas School District
Pride Month Slides 2024 David Douglas School DistrictPride Month Slides 2024 David Douglas School District
Pride Month Slides 2024 David Douglas School District
David Douglas School District
 
Biological Screening of Herbal Drugs in detailed.
Biological Screening of Herbal Drugs in detailed.Biological Screening of Herbal Drugs in detailed.
Biological Screening of Herbal Drugs in detailed.
Ashokrao Mane college of Pharmacy Peth-Vadgaon
 
Overview on Edible Vaccine: Pros & Cons with Mechanism
Overview on Edible Vaccine: Pros & Cons with MechanismOverview on Edible Vaccine: Pros & Cons with Mechanism
Overview on Edible Vaccine: Pros & Cons with Mechanism
DeeptiGupta154
 
special B.ed 2nd year old paper_20240531.pdf
special B.ed 2nd year old paper_20240531.pdfspecial B.ed 2nd year old paper_20240531.pdf
special B.ed 2nd year old paper_20240531.pdf
Special education needs
 
Multithreading_in_C++ - std::thread, race condition
Multithreading_in_C++ - std::thread, race conditionMultithreading_in_C++ - std::thread, race condition
Multithreading_in_C++ - std::thread, race condition
Mohammed Sikander
 
Unit 2- Research Aptitude (UGC NET Paper I).pdf
Unit 2- Research Aptitude (UGC NET Paper I).pdfUnit 2- Research Aptitude (UGC NET Paper I).pdf
Unit 2- Research Aptitude (UGC NET Paper I).pdf
Thiyagu K
 
1.4 modern child centered education - mahatma gandhi-2.pptx
1.4 modern child centered education - mahatma gandhi-2.pptx1.4 modern child centered education - mahatma gandhi-2.pptx
1.4 modern child centered education - mahatma gandhi-2.pptx
JosvitaDsouza2
 
Azure Interview Questions and Answers PDF By ScholarHat
Azure Interview Questions and Answers PDF By ScholarHatAzure Interview Questions and Answers PDF By ScholarHat
Azure Interview Questions and Answers PDF By ScholarHat
Scholarhat
 
Executive Directors Chat Leveraging AI for Diversity, Equity, and Inclusion
Executive Directors Chat  Leveraging AI for Diversity, Equity, and InclusionExecutive Directors Chat  Leveraging AI for Diversity, Equity, and Inclusion
Executive Directors Chat Leveraging AI for Diversity, Equity, and Inclusion
TechSoup
 
Exploiting Artificial Intelligence for Empowering Researchers and Faculty, In...
Exploiting Artificial Intelligence for Empowering Researchers and Faculty, In...Exploiting Artificial Intelligence for Empowering Researchers and Faculty, In...
Exploiting Artificial Intelligence for Empowering Researchers and Faculty, In...
Dr. Vinod Kumar Kanvaria
 
Advantages and Disadvantages of CMS from an SEO Perspective
Advantages and Disadvantages of CMS from an SEO PerspectiveAdvantages and Disadvantages of CMS from an SEO Perspective
Advantages and Disadvantages of CMS from an SEO Perspective
Krisztián Száraz
 

Recently uploaded (20)

The Accursed House by Émile Gaboriau.pptx
The Accursed House by Émile Gaboriau.pptxThe Accursed House by Émile Gaboriau.pptx
The Accursed House by Émile Gaboriau.pptx
 
STRAND 3 HYGIENIC PRACTICES.pptx GRADE 7 CBC
STRAND 3 HYGIENIC PRACTICES.pptx GRADE 7 CBCSTRAND 3 HYGIENIC PRACTICES.pptx GRADE 7 CBC
STRAND 3 HYGIENIC PRACTICES.pptx GRADE 7 CBC
 
Mule 4.6 & Java 17 Upgrade | MuleSoft Mysore Meetup #46
Mule 4.6 & Java 17 Upgrade | MuleSoft Mysore Meetup #46Mule 4.6 & Java 17 Upgrade | MuleSoft Mysore Meetup #46
Mule 4.6 & Java 17 Upgrade | MuleSoft Mysore Meetup #46
 
Unit 8 - Information and Communication Technology (Paper I).pdf
Unit 8 - Information and Communication Technology (Paper I).pdfUnit 8 - Information and Communication Technology (Paper I).pdf
Unit 8 - Information and Communication Technology (Paper I).pdf
 
Synthetic Fiber Construction in lab .pptx
Synthetic Fiber Construction in lab .pptxSynthetic Fiber Construction in lab .pptx
Synthetic Fiber Construction in lab .pptx
 
The approach at University of Liverpool.pptx
The approach at University of Liverpool.pptxThe approach at University of Liverpool.pptx
The approach at University of Liverpool.pptx
 
BÀI TẬP BỔ TRỢ TIẾNG ANH GLOBAL SUCCESS LỚP 3 - CẢ NĂM (CÓ FILE NGHE VÀ ĐÁP Á...
BÀI TẬP BỔ TRỢ TIẾNG ANH GLOBAL SUCCESS LỚP 3 - CẢ NĂM (CÓ FILE NGHE VÀ ĐÁP Á...BÀI TẬP BỔ TRỢ TIẾNG ANH GLOBAL SUCCESS LỚP 3 - CẢ NĂM (CÓ FILE NGHE VÀ ĐÁP Á...
BÀI TẬP BỔ TRỢ TIẾNG ANH GLOBAL SUCCESS LỚP 3 - CẢ NĂM (CÓ FILE NGHE VÀ ĐÁP Á...
 
How libraries can support authors with open access requirements for UKRI fund...
How libraries can support authors with open access requirements for UKRI fund...How libraries can support authors with open access requirements for UKRI fund...
How libraries can support authors with open access requirements for UKRI fund...
 
The Diamond Necklace by Guy De Maupassant.pptx
The Diamond Necklace by Guy De Maupassant.pptxThe Diamond Necklace by Guy De Maupassant.pptx
The Diamond Necklace by Guy De Maupassant.pptx
 
Pride Month Slides 2024 David Douglas School District
Pride Month Slides 2024 David Douglas School DistrictPride Month Slides 2024 David Douglas School District
Pride Month Slides 2024 David Douglas School District
 
Biological Screening of Herbal Drugs in detailed.
Biological Screening of Herbal Drugs in detailed.Biological Screening of Herbal Drugs in detailed.
Biological Screening of Herbal Drugs in detailed.
 
Overview on Edible Vaccine: Pros & Cons with Mechanism
Overview on Edible Vaccine: Pros & Cons with MechanismOverview on Edible Vaccine: Pros & Cons with Mechanism
Overview on Edible Vaccine: Pros & Cons with Mechanism
 
special B.ed 2nd year old paper_20240531.pdf
special B.ed 2nd year old paper_20240531.pdfspecial B.ed 2nd year old paper_20240531.pdf
special B.ed 2nd year old paper_20240531.pdf
 
Multithreading_in_C++ - std::thread, race condition
Multithreading_in_C++ - std::thread, race conditionMultithreading_in_C++ - std::thread, race condition
Multithreading_in_C++ - std::thread, race condition
 
Unit 2- Research Aptitude (UGC NET Paper I).pdf
Unit 2- Research Aptitude (UGC NET Paper I).pdfUnit 2- Research Aptitude (UGC NET Paper I).pdf
Unit 2- Research Aptitude (UGC NET Paper I).pdf
 
1.4 modern child centered education - mahatma gandhi-2.pptx
1.4 modern child centered education - mahatma gandhi-2.pptx1.4 modern child centered education - mahatma gandhi-2.pptx
1.4 modern child centered education - mahatma gandhi-2.pptx
 
Azure Interview Questions and Answers PDF By ScholarHat
Azure Interview Questions and Answers PDF By ScholarHatAzure Interview Questions and Answers PDF By ScholarHat
Azure Interview Questions and Answers PDF By ScholarHat
 
Executive Directors Chat Leveraging AI for Diversity, Equity, and Inclusion
Executive Directors Chat  Leveraging AI for Diversity, Equity, and InclusionExecutive Directors Chat  Leveraging AI for Diversity, Equity, and Inclusion
Executive Directors Chat Leveraging AI for Diversity, Equity, and Inclusion
 
Exploiting Artificial Intelligence for Empowering Researchers and Faculty, In...
Exploiting Artificial Intelligence for Empowering Researchers and Faculty, In...Exploiting Artificial Intelligence for Empowering Researchers and Faculty, In...
Exploiting Artificial Intelligence for Empowering Researchers and Faculty, In...
 
Advantages and Disadvantages of CMS from an SEO Perspective
Advantages and Disadvantages of CMS from an SEO PerspectiveAdvantages and Disadvantages of CMS from an SEO Perspective
Advantages and Disadvantages of CMS from an SEO Perspective
 

Data mining techniques using weka

  • 1. ITB TERM PAPER Classification and Clutering Nitin Kumar Rathore 10BM60055
  • 2. Introduction Weka stands for Waikato Environment for knowledge analysis. Weka is software available for free used for machine learning. It is coded in Java and is developed by the University of Waikato, New Zealand. Weka workbench includes set of visualization tools and algorithms which is applied for better decision making through data analysis and predictive modeling. It also has a GUI (graphical user interface) for ease of use. It is developed in Java so is portable across platforms Weka has many applications and is used widely for research and educational purposes. Data mining functions can be done by weka involves classification, clustering, feature selection, data preprocessing, regression and visualization. Weka startup screen looks like: This is Weka GUI Chooser. It gives you four interfaces to work on Explorer: It is used for exploring the data with weka by providing access to all the facilities by the use of menues and forms Experimenter: Weka Experimenter allows you to create, analyse, modify and run large scale experiments. It can be used to answer question such as out of many schemes which is better (if there is) Knowledge flow: it has the same function as that of explorer. It supports incremental learning. It handles data on incremental basis. It uses incremental algorithms to process data. Simple CLI: CLI stands for command line interface. It just provides all the functionality through command line interface. Data Ming Techniques Out of the data mining techniques provided by the weka, classification, clustering, feature selection, data preprocessing, regression and visualization, this paper will demonstrate use of classification and clustering.
  • 3. Classification Classification creates a model based on which a new instance can be classified into the existing classes or determined classes. for example by creating a decision tree based on past sales we can determine how likely is a person to buy the product given all his attribute like disposable income, family strength, state/country etc. To start with classification you must use or create arff or csv (or any supported) file format. An arff file is a table. To create arff file from excel you just have to follow these steps Open the excel file. Remove headings Save as it as a csv file (comma delimited) file. Open the csv file ina text editor. Now write the relation name at the top of the file as: @relation <relation_name> The text inside the arrows, < and >, represents the text to be entered according to the requirement Leave a blank line and enter all the attributes, column heads, in the format: @attibute <attribute_name>(<attribute_values>). For example @attribute outlook (sunny, overcast, rainy) After entering all the attribute leave a blank line and write: @data This last line will appear just above comma separated data values of the file. Save it as <file_name>.arff The sample picture of arff file is shown below
  • 4. Classification example: Our goal is to create a decision tree using weka so that we can classify new or unknown iris flower samples. There are three kind or iris they are Iris setosa, Iris versicolor, Iris virginica. Data file: We have a data file containing attribute values for 150 Iris samples in arff format at this link: http://code.google.com/p/pwr-apw/downloads/detail?name=iris.arff. Concept behind the classification is the sepal and petal length and width help us to identify the unknown iris. The data files contain all the four attributes. The algorithm we are going to use to classify is weka’s J4.8 decision tree learner. Follow the underlying steps to classify: Open weka and choose explorer. Then open the downloaded arff file. Go to classify tab. Click “choose” and Choose J48 algorithm under trees section Left click on the chosen J48 algorithm to open Weka Generic Object Editor. Change the option saveInstanceData to true. Click ok. It allows you to find the classification process for each sample after building of the decision tree
  • 5. Click “Percentage Split” option in the “Test Options” section. It trains on the numerical percentage enters in the box and test on the rest of the data. Default value is 66% Click on “Start” to start classification. The output box named “classifier output” shows the output of classification. Output will look like this Now we will see the tree. Right click on the entry in “Result List” then click visualize tree.
  • 6. Decision tree will be visible in new window It gives the decision structure or flow of process to be followed during classification. For example if petal width is > 0.6, petal width <=1.7, petal length > 4.9 and petal width <= 1.5,it implies the iris is Virginica. Now look at the classifier output box. The rules describing the decision tree is described as given in the picture.
  • 7. As we can see in the decision tree we don’t require sepal length and width for classification. We require only petal length and width. Go to “classifier output box”. Scroll to the section “Evaluation on test split section”. We have split the data in two 66% for training and 33% for testing the model or tree. This section will be visible as follows Weka took 51 samples as 33% for test. Out of which 49 are classified correctly and 2 are classified incorrectly. If you look at the confusion matrix below in classifier output box. You will see all setosa(15) and all versicolor(19) are classified correctly but 2 out 0f 117 virginica are classified as versicolor. To find more information or to visualize how decision tree did on test samples. Right click on “Result list” and select “Visualize classifier errors”. A new window will open. Now as our tree has used on petal width and petal length to classify, we will select Petal Length for X axis and Petal Width for Y axis. Here “x” or cross represents correctly classified samples and squares represents incorrectly classified samples. Results of decision tree as Setosa, versicolor and virginica are represented in different colors as blue red and green. AS we can see why these are classified incorrectly as virginica, because they fall into the versicolor group considering petal length and width.
  • 8. The picture of window will appear as By left clicking on the squared instances circled black will give you information about that instance.
  • 9. As we can see 2 nodes out of 50 virginica samples (train +test) are classified incorrectly. Rest others are classified correctly for setosa and versicolor. There can be many reasons for it. Few are mentioned below. Attribute measurement error: It arises out of incorrect measurement of petal and sepal length and widths. Sample class identification error: It may arise because some classes are identified incorrectly. Say some versicolor are classified as virginica. Outlier samples: some infected or abnormal flower are sampled Inappropriate classification algorithm: the algorithm we chose is not suitable for the classification. Clustering Clustering is formation of groups on the basis of its attributes and is used to determine patterns from the data. Advantage of clustering over classification is each and every attribute is used to define a group but disadvantage of clustering is a user must know beforehand how many groups he wants to form. There are 2 types of clustering: Hierarchical clustering: This approach uses measure (generally squared Euclidean) of distance for identifying distance between objects to form a cluster. Process starts with all the objects as separate clusters. Then on the basis of shortest distance between clusters two objects closest are joined to form a cluster. And this cluster represents the new object. Now again the process continues until one cluster is formed or the required number of cluster is reached. Non-Hierarchical Clustering: It is the method of clustering in which partition of observations (say n in number) occur into k clusters. Each observation is assigned to nearest cluster and cluster mean is recalculated. In this paper we will study K-means clustering example. Applications of clustering includes Market segmentation Computer vision Geostatistics Understanding buyer behavior Data file: Data file talks about the BMW dealership. It contains data about how often customer makes a purchase, what cars they look at, how they walk through showroom and dealership. It contains 100 rows of data and where every attribute/column represent the steps that customer have achieved in their buying process. “1” represents they have reached this step whereas “0” represents they didn’t made it to this step. Download the data file from the
  • 10. link:http://www.ibm.com/developerworks/apps/download/index.jsp?contentid=487584&filen ame=os-weka2-Examples.zip&method=http&locale= Let us have a sneak peek into the data file. Now follow these steps to perform Clustering: Load the file into Weka by open file option under preprocess tab of weka explorer or by double clicking the file. The Weka explorer will look like
  • 11. To create clusters click on cluster tab. Click the command button “Choose” and select “SimpleKMeans”. Click on the text box next to choose button which displays the k means algorithm. It will open Weka GUI Generic Object Editor Change “numClusters” from 2 to 5. It define the number of clusters to be formed. Click ok Click Start to start clustering In “result List” box a entry will appear and Cluster output will display output of clustering. It will appear as follows. Cluster Results: Now we will have the clusters defined. You can have cluster data in a separate window by right clicking the entry in the “Result List” Box. There are 5 clusters formed named from “0” to “4“. If a attribute value for a cluster is “1” it means all the instances in the cluster have the same value “1” for that attribute. If a cluster has “0” values for an attribute it means all instances in the cluster have the “0” value for that attribute. To remind, the “0” value represent customer have not entered into that step of buying process and “1” represent customer have entered into the step.
  • 12. Clustered instances show how many instances belong to each cluster. Clustered instances is the heading given in the cluster output. For example in cluster “0” it have 26 instances or 26% instances (as there are 100 rows no. of instances is equal to percentage) The value for clusters in separate window is given in the picture below. Interpreting the clusters Cluster 0: It represents the group of non purchasers, as they may look for dealership, look for cars in a showroom but when it comes to purchasing a car they do nothing. This group just adds to cost but doesn’t bring any revenue. Cluster 1: This group is attracted towards M5 as it is quite visible that go straight towards the M5s ignoring 3Series car and paying no heed at all to Z4. They even
  • 13. don’t do the computer search. But as we can see this high footfall for does not bring sales accordingly. The reason for medium sales should be unearthed. Say if customer service is the problem we should increase the service quality over the M5 section by training sales executive better or if lack of no. of sales personnel to cater every customer is the problem we can provide more staff for the M5 section. Cluster 2: This group just contains 5 instances out of 100. They can be called “insignificant group”. They are not statistically important. We should not make any conclusion from such an insignificant group. It indicates we may reduce the no. of clusters Cluster 3: This is the group of customers we can call “sure shot buyers”. Because they will always buy a car. One thing to note is we should take care of their financing as they always go for financing. They lookout showroom for available cars and also do computer search for the available dealership. They generally don’t lookout for 3Series. It displays that we should make computer search for M5 and Z4 more visible and attractive in search results. Cluster 4: This group contains the ones that make least purchase after non- purchasers. They are the new ones in the category, because they don’t look for expensive cars like M5 instead lookout for 3Series. They walk into showrooms and they don’t involve in computer search. As we can see 50 percent of them get to the financing stage but only 32 percent end up buying a car. This means these are the ones buying their first BMW and know exactly their requirement and hence their car (3Series entry level model). They generally go for financing to afford the car. This means to increase the sales we should increase the conversion ratio from financing stage to purchasing stage. We should identify the problem there and take the appropriate step. For example making financing easier by collaborating with bank. By lowering the terms that repels customers.
  • 14. REFERENCES [1] Data mining by Jan H. witten, Eibe Frank and Mark A. Hall, 3rd edition, Morgan Kaufman Publisher [2]Tutorial for weka provided by university of Waikato, www.cs.waikato.ac.nz/ml/weka/ [3] Weka,Classification using decision trees based on Dr. Polczynski's Lecture, written by Prof. Andrzej Kochanski and Prof Marcin Perzyk, Faculty of Production Engineering, Warsaw University of Technology, Warsaw Poland, http://referensi.dosen.narotama.ac.id/files/2011/12/weka-tutorial-2.pdf [4] Classification via Decision Trees in WEKA, Computer science, Telecommunications, and Information systems, DePaul University, http://maya.cs.depaul.edu/classes/ect584/weka/classify.html [5] Data mining with WEKA, Part 2: classification and clustering, IBM developer works Michael Abernethy, http://www.ibm.com/developerworks/opensource/library/os- weka2/index.html?ca=drs-