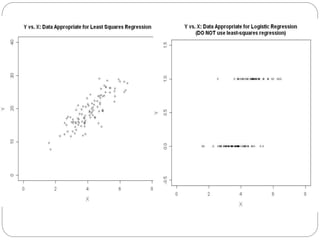
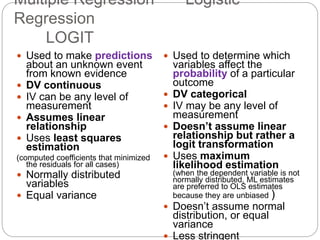
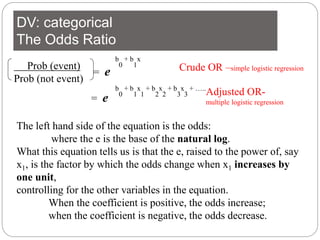
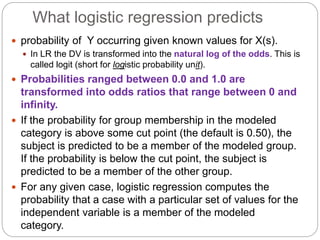
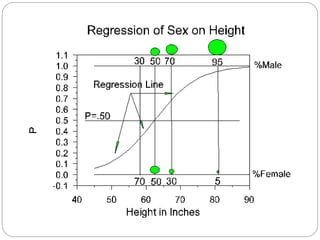
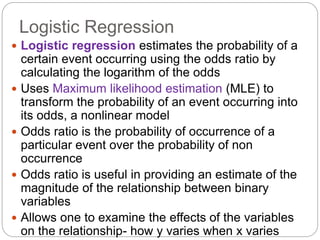
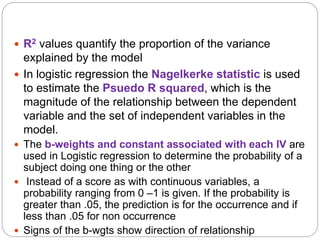
Logistic regression predicts the probability of a categorical outcome (usually dichotomous) based on one or more predictor variables. It transforms the probability into odds using the logit function and estimates coefficients using maximum likelihood estimation. The odds ratio describes the change in odds of the outcome occurring given a one-unit increase in the predictor, while controlling for other predictors. Logistic regression allows examination of the effects of variables on the relationship between the dichotomous outcome and predictors.
![DV: categorical (dichotomous )
Exploring Relationships
Is a variable related to the proportions of another?
The first step is to examine the data using crosstabs
Chi square test
Logistic regression relies on an estimation procedure
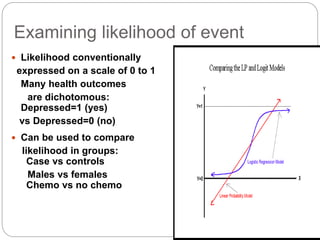
Models the probability of an outcome
Transforms the probability of an event occurring into its
odds
In logistic regression the regression coefficient (b) can
be interpreted as the change in the log odds associated
with a one-unit increase change in the associate
predictor variable.
ln[Y/(1−Y)]=a + bX](https://image.slidesharecdn.com/m8-220907112442-d8c40c45/85/M8-logreg-ppt-1-320.jpg)
![DV: categorical (dichotomous )
Exploring Relationships
Is a variable related to the proportions of another?
The first step is to examine the data using crosstabs
Chi square test
Logistic regression relies on an estimation procedure
Models the probability of an outcome
Transforms the probability of an event occurring into its
odds
In logistic regression the regression coefficient (b) can
be interpreted as the change in the log odds associated
with a one-unit increase change in the associate
predictor variable.
ln[Y/(1−Y)]=a + bX](https://image.slidesharecdn.com/m8-220907112442-d8c40c45/75/M8-logreg-ppt-1-2048.jpg)


![logistic model final_pptx__corected_one[1].pptx](https://cdn.slidesharecdn.com/ss_thumbnails/finalpptxcorectedone1-251124022241-c29356b7-thumbnail.jpg?width=640&height=640&fit=bounds)


![Polymer [ बहुलक ] Chemistry Notes PDF - Irfanullah Mehar - JJ Sir Chemistry.pdf](https://cdn.slidesharecdn.com/ss_thumbnails/polymerchemistrynotespdf-irfanullahmehar-jjsirchemistry-260210172118-3f9b37f7-thumbnail.jpg?width=640&height=640&fit=bounds)


