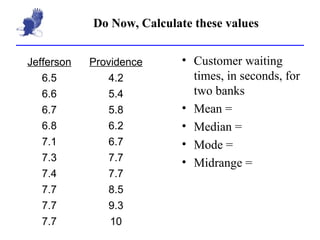
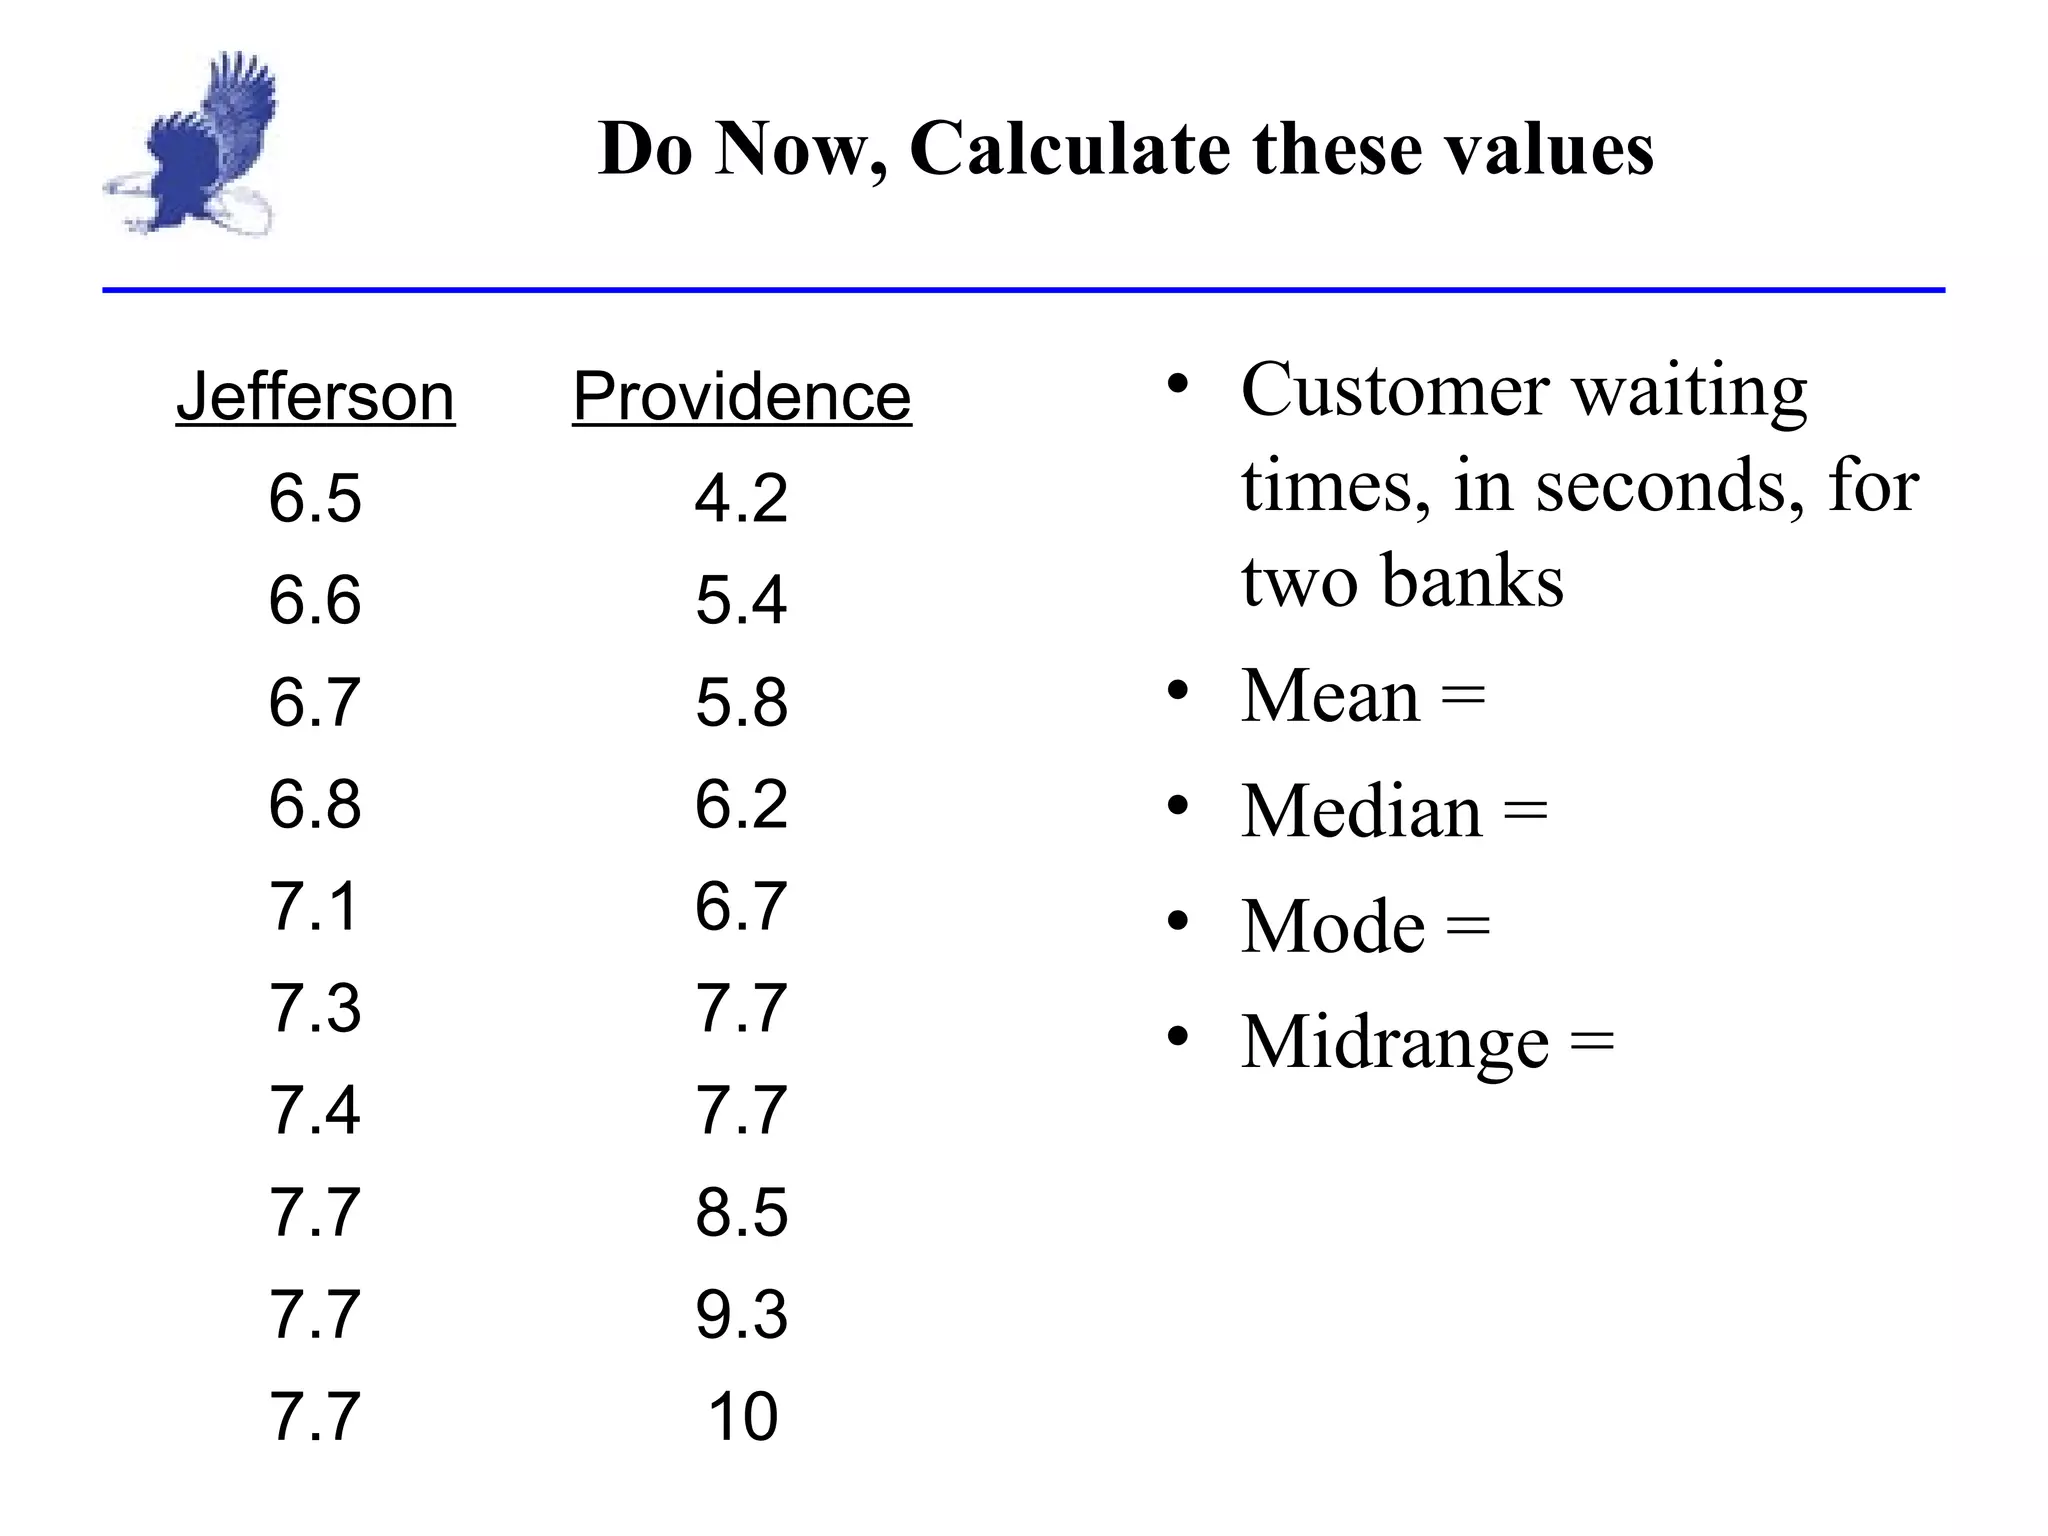
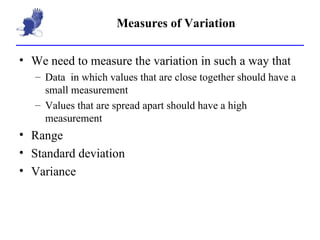
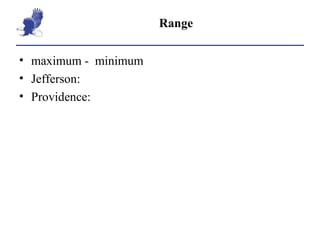
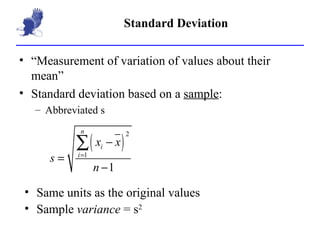
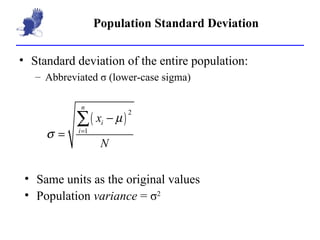
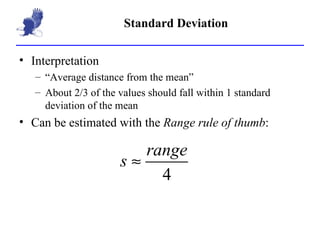
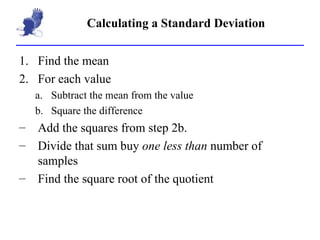
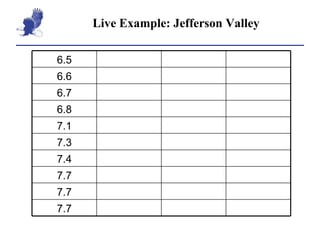
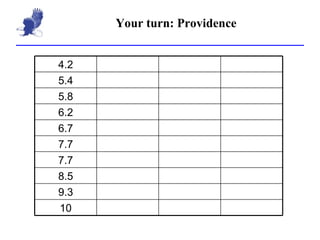
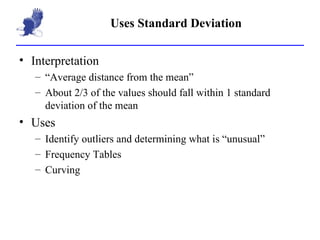
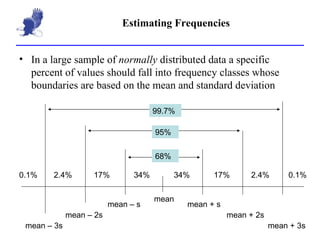
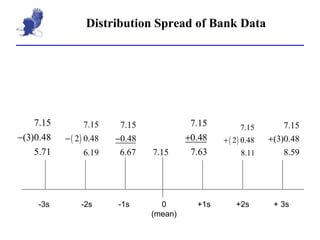
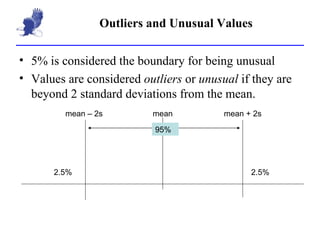
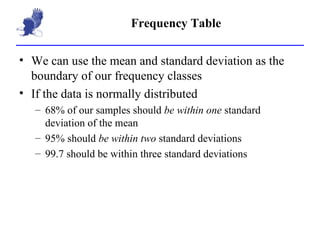
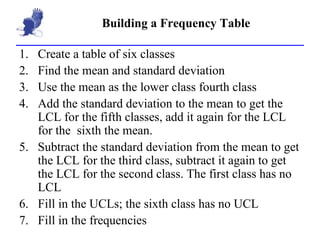
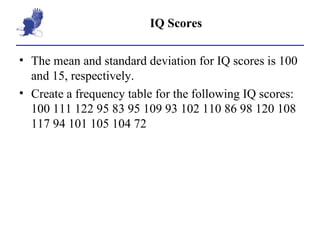
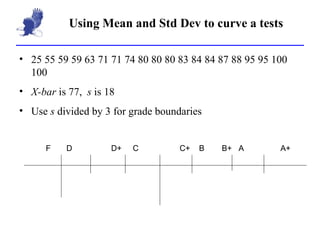
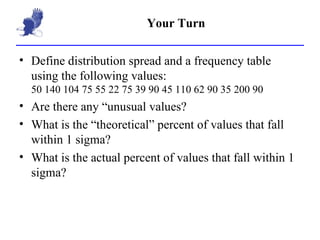
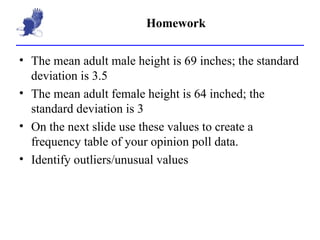
Do Now, Calculate these values Customer waiting times, in seconds, for two banks Mean = Median = Mode = Midrange = Providence Jefferson 10 7.7 9.3 7.7 8.5 7.7 7.7 7.4 7.7 7.3 6.7 7.1 6.2 6.8 5.8 6.7 5.4 6.6 4.2 6.5
Measures of Variation We need to measure the variation in such a way that Data  in which values that are close together should have a small measurement Values that are spread apart should have a high measurement Range Standard deviation Variance
Range maximum -  minimum Jefferson: Providence:
Standard Deviation “Measurement of variation of values about their mean” Standard deviation based on a  sample : Abbreviated s Same units as the original values Sample  variance  = s 2
Population Standard Deviation Standard deviation of the entire population: Abbreviated  σ  (lower-case sigma) Same units as the original values Population  variance  =  σ 2
Standard Deviation Interpretation “Average distance from the mean” About 2/3 of the values should fall within 1 standard deviation of the mean Can be estimated with the  Range rule of thumb :
Calculating a Standard Deviation Find the mean For each value Subtract the mean from the value Square the difference Add the squares from step 2b. Divide that sum buy  one less than  number of samples Find the square root of the quotient
Live Example: Jefferson Valley 7.7 7.7 7.7 6.5 7.4 7.3 7.1 6.8 6.7 6.6
Your turn: Providence 6.2 5.8 5.4 4.2 6.7 7.7 10 9.3 8.5 7.7
Rounding Round to one more decimal place that the original data. E.g., the mean of 14 15 9  16 and 12 would be 13.2 E.g., the mean of 1.04, 2.17, and 3.79 would be 2.333 Except for ‘well-know’ decimals 0.25, 0.75, 0.5 Round the standard deviation to one more place that the mean
Homework Find the standard deviation of Super Bowl Points Use the range rule of thumb to estimate the standard deviation of motor vehicle deaths and Sunspot number
Uses Standard Deviation Interpretation “Average distance from the mean” About 2/3 of the values should fall within 1 standard deviation of the mean Uses Identify outliers and determining what is “unusual” Frequency Tables Curving
Estimating Frequencies In a large sample of  normally  distributed data a specific percent of values should fall into frequency classes whose boundaries are based on the mean and standard deviation mean mean + s mean + 2s mean + 3s mean – 3s mean – 2s mean – s 34% 34% 17% 17% 2.4% 2.4% 0.1% 0.1% 68% 95% 99.7%
Distribution Spread of Bank Data 0 (mean) +1s +2s + 3s -3s -2s -1s
Outliers and Unusual Values 5% is considered the boundary for being unusual Values are considered  outliers  or  unusual  if they are beyond 2 standard deviations from the mean. mean mean + 2s mean – 2s 2.5% 2.5% 95%
Outliers and Unusual Values Outliers and/or unusual values are usually investigated Different category Bad data “Bad day” Outliers and/or unusual values might be trimmed from the list
Frequency Table We can use the mean and standard deviation as the boundary of our frequency classes If the data is normally distributed 68% of our samples should  be within one  standard deviation of the mean 95% should  be within two  standard deviations 99.7 should be within three standard deviations
Building a Frequency Table Create a table of six classes Find the mean and standard deviation Use the mean as the lower class fourth class Add the standard deviation to the mean to get the LCL for the fifth classes, add it again for the LCL for the  sixth the mean. Subtract the standard deviation from the mean to get the LCL for the third class, subtract it again to get the LCL for the second class. The first class has no LCL Fill in the UCLs; the sixth class has no UCL Fill in the frequencies
IQ Scores The mean and standard deviation for IQ scores is 100 and 15, respectively. Create a frequency table for the following IQ scores: 100 111 122 95 83 95 109 93 102 110 86 98 120 108 117 94 101 105 104 72
IQ Frequency Table Frequency UCB LCB
Using Mean and Std Dev to curve a tests 25 55 59 59 63 71 71 74 80 80 80 83 84 84 87 88 95 95 100 100 X-bar  is 77,  s  is 18 Use  s  divided by 3 for grade boundaries C+  B B+  A F  D D+  C A+
Your Turn Define distribution spread and a frequency table using the following values: 50 140 104 75 55 22 75 39 90 45 110 62 90 35 200 90 Are there any “unusual values? What is the “theoretical” percent of values that fall within 1 sigma? What is the actual percent of values that fall within 1 sigma?
IQ Frequency Table Frequency UCB LCB
Homework The mean adult male height is 69 inches; the standard deviation is 3.5 The mean adult female height is 64 inched; the standard deviation is 3 On the next slide use these values to create a frequency table of your opinion poll data. Identify outliers/unusual values
Frequency Table: Male Frequency UCB LCB
Frequency Table: Female Frequency UCB LCB

2 5 standard deviation

  • 1.
    Do Now, Calculatethese values Customer waiting times, in seconds, for two banks Mean = Median = Mode = Midrange = Providence Jefferson 10 7.7 9.3 7.7 8.5 7.7 7.7 7.4 7.7 7.3 6.7 7.1 6.2 6.8 5.8 6.7 5.4 6.6 4.2 6.5
  • 2.
    Measures of VariationWe need to measure the variation in such a way that Data in which values that are close together should have a small measurement Values that are spread apart should have a high measurement Range Standard deviation Variance
  • 3.
    Range maximum - minimum Jefferson: Providence:
  • 4.
    Standard Deviation “Measurementof variation of values about their mean” Standard deviation based on a sample : Abbreviated s Same units as the original values Sample variance = s 2
  • 5.
    Population Standard DeviationStandard deviation of the entire population: Abbreviated σ (lower-case sigma) Same units as the original values Population variance = σ 2
  • 6.
    Standard Deviation Interpretation“Average distance from the mean” About 2/3 of the values should fall within 1 standard deviation of the mean Can be estimated with the Range rule of thumb :
  • 7.
    Calculating a StandardDeviation Find the mean For each value Subtract the mean from the value Square the difference Add the squares from step 2b. Divide that sum buy one less than number of samples Find the square root of the quotient
  • 8.
    Live Example: JeffersonValley 7.7 7.7 7.7 6.5 7.4 7.3 7.1 6.8 6.7 6.6
  • 9.
    Your turn: Providence6.2 5.8 5.4 4.2 6.7 7.7 10 9.3 8.5 7.7
  • 10.
    Rounding Round toone more decimal place that the original data. E.g., the mean of 14 15 9 16 and 12 would be 13.2 E.g., the mean of 1.04, 2.17, and 3.79 would be 2.333 Except for ‘well-know’ decimals 0.25, 0.75, 0.5 Round the standard deviation to one more place that the mean
  • 11.
    Homework Find thestandard deviation of Super Bowl Points Use the range rule of thumb to estimate the standard deviation of motor vehicle deaths and Sunspot number
  • 12.
    Uses Standard DeviationInterpretation “Average distance from the mean” About 2/3 of the values should fall within 1 standard deviation of the mean Uses Identify outliers and determining what is “unusual” Frequency Tables Curving
  • 13.
    Estimating Frequencies Ina large sample of normally distributed data a specific percent of values should fall into frequency classes whose boundaries are based on the mean and standard deviation mean mean + s mean + 2s mean + 3s mean – 3s mean – 2s mean – s 34% 34% 17% 17% 2.4% 2.4% 0.1% 0.1% 68% 95% 99.7%
  • 14.
    Distribution Spread ofBank Data 0 (mean) +1s +2s + 3s -3s -2s -1s
  • 15.
    Outliers and UnusualValues 5% is considered the boundary for being unusual Values are considered outliers or unusual if they are beyond 2 standard deviations from the mean. mean mean + 2s mean – 2s 2.5% 2.5% 95%
  • 16.
    Outliers and UnusualValues Outliers and/or unusual values are usually investigated Different category Bad data “Bad day” Outliers and/or unusual values might be trimmed from the list
  • 17.
    Frequency Table Wecan use the mean and standard deviation as the boundary of our frequency classes If the data is normally distributed 68% of our samples should be within one standard deviation of the mean 95% should be within two standard deviations 99.7 should be within three standard deviations
  • 18.
    Building a FrequencyTable Create a table of six classes Find the mean and standard deviation Use the mean as the lower class fourth class Add the standard deviation to the mean to get the LCL for the fifth classes, add it again for the LCL for the sixth the mean. Subtract the standard deviation from the mean to get the LCL for the third class, subtract it again to get the LCL for the second class. The first class has no LCL Fill in the UCLs; the sixth class has no UCL Fill in the frequencies
  • 19.
    IQ Scores Themean and standard deviation for IQ scores is 100 and 15, respectively. Create a frequency table for the following IQ scores: 100 111 122 95 83 95 109 93 102 110 86 98 120 108 117 94 101 105 104 72
  • 20.
    IQ Frequency TableFrequency UCB LCB
  • 21.
    Using Mean andStd Dev to curve a tests 25 55 59 59 63 71 71 74 80 80 80 83 84 84 87 88 95 95 100 100 X-bar is 77, s is 18 Use s divided by 3 for grade boundaries C+ B B+ A F D D+ C A+
  • 22.
    Your Turn Definedistribution spread and a frequency table using the following values: 50 140 104 75 55 22 75 39 90 45 110 62 90 35 200 90 Are there any “unusual values? What is the “theoretical” percent of values that fall within 1 sigma? What is the actual percent of values that fall within 1 sigma?
  • 23.
    IQ Frequency TableFrequency UCB LCB
  • 24.
    Homework The meanadult male height is 69 inches; the standard deviation is 3.5 The mean adult female height is 64 inched; the standard deviation is 3 On the next slide use these values to create a frequency table of your opinion poll data. Identify outliers/unusual values
  • 25.
    Frequency Table: MaleFrequency UCB LCB
  • 26.
    Frequency Table: FemaleFrequency UCB LCB