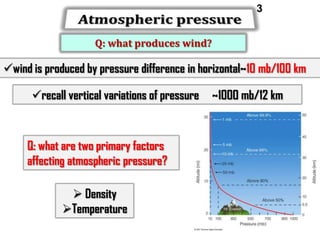
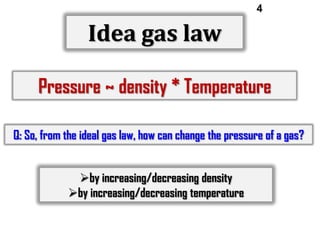
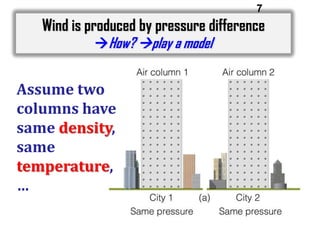
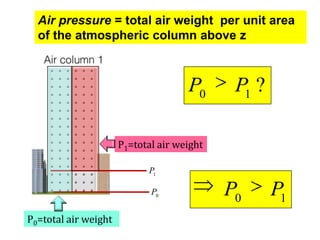
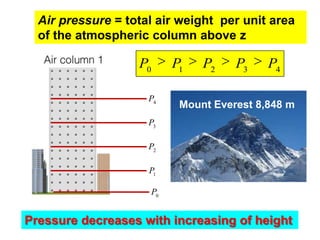
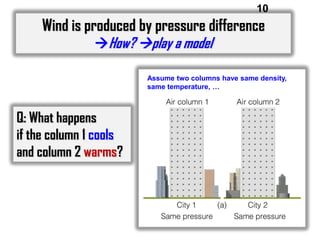
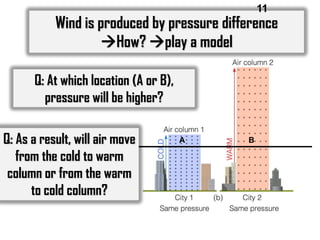
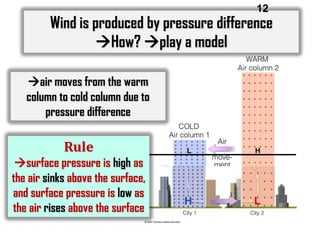
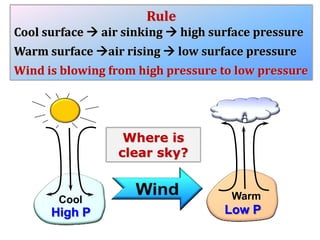
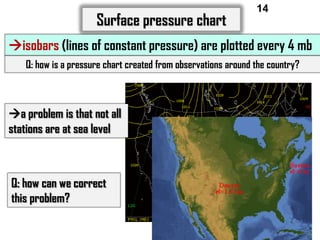
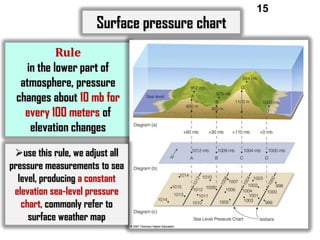
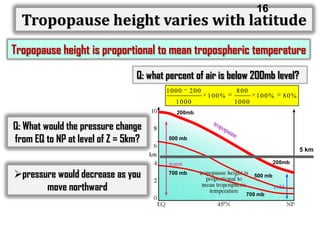
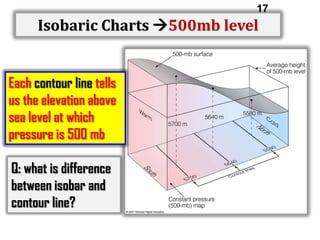
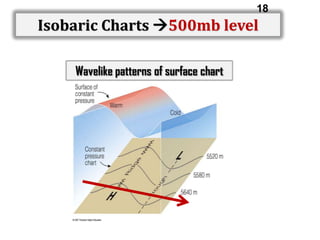
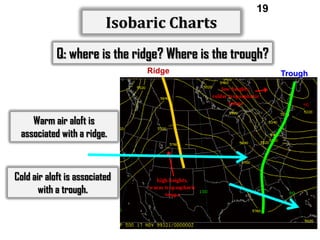
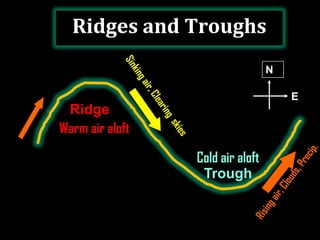
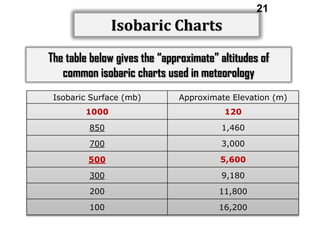
1
2

Wind
Atmospheric
Motion
3
Q: what produces wind?

wind is produced by pressure difference in horizontal~10 mb/100 km
recall vertical variations of pressure

Q: what are two primary factors
affecting atmospheric pressure?

 Density
Temperature

~1000 mb/12 km
4

Idea gas law
Pressure ~ density * Temperature
Q: So, from the ideal gas law, how can change the pressure of a gas?
by increasing/decreasing density
by increasing/decreasing temperature
What is this?

This is the model of a
person, but not real.
We are to use a model to understand how
an atmospheric circulation is produced.
7

Wind is produced by pressure difference
How? play a model

Assume two
columns have
same density,
same
temperature,
…
Air pressure = total air weight per unit area
of the atmospheric column above z

P0

P1 ?

P1=total air weight
P1
P0

P0=total air weight

P0

P1
Air pressure = total air weight per unit area
of the atmospheric column above z

P0

P1

P4

P2

P3

P4

Mount Everest 8,848 m

P3
P2
P1
P0

Pressure decreases with increasing of height
10

Wind is produced by pressure difference
How? play a model

Assume two columns have same density,
same temperature, …

Q: What happens
if the column 1 cools
and column 2 warms?
11

Wind is produced by pressure difference
How? play a model
Q: At which location (A or B),
pressure will be higher?
Q: As a result, will air move
from the cold to warm
column or from the warm
to cold column?

A

B

Fig. 6-2, p. 143
12

Wind is produced by pressure difference
How? play a model
air moves from the warm
column to cold column due to
pressure difference

Rule

surface pressure is high as
the air sinks above the surface,
and surface pressure is low as
the air rises above the surface

Fig. 6-2, p. 143
Rule
Cool surface  air sinking  high surface pressure
Warm surface air rising  low surface pressure
Wind is blowing from high pressure to low pressure

Where is
clear sky?

Cool

High P

Warm

Low P
Surface pressure chart

14

isobars (lines of constant pressure) are plotted every 4 mb
Q: how is a pressure chart created from observations around the country?

a problem is that not all
stations are at sea level

Q: how can we correct
this problem?
Surface pressure chart
Rule
in the lower part of
atmosphere, pressure
changes about 10 mb for
every 100 meters of
elevation changes
use this rule, we adjust all
pressure measurements to sea
level, producing a constant
elevation sea-level pressure
chart, commonly refer to
surface weather map

15
16

Tropopause height varies with latitude
Tropopause height is proportional to mean tropospheric temperature
Q: what percent of air is below 200mb level?
1000

200

1000

100%

800

100%

80%

1000

200mb

Q: What would the pressure change
from EQ to NP at level of Z = 5km?

500 mb

5 km
200mb

pressure would decrease as you
move northward

700 mb

500 mb

700 mb
17

Isobaric Charts 500mb level
Each contour line tells
us the elevation above
sea level at which
pressure is 500 mb
Q: what is difference
between isobar and
contour line?
18

Isobaric Charts 500mb level
Wavelike patterns of surface chart
Isobaric Charts

19

Q: where is the ridge? Where is the trough?
Ridge

Warm air aloft is
associated with a ridge.

Cold air aloft is associated
with a trough.

Trough
Ridges and Troughs
N
E

Ridge
Warm air aloft
Cold air aloft
Trough
21

Isobaric Charts
The table below gives the “approximate” altitudes of
common isobaric charts used in meteorology
Isobaric Surface (mb)

Approximate Elevation (m)

1000

120

850

1,460

700

3,000

500

5,600

300

9,180

200

11,800

100

16,200

Lecture9 oct9-bb

  • 1.
  • 2.
  • 3.
    3 Q: what produceswind? wind is produced by pressure difference in horizontal~10 mb/100 km recall vertical variations of pressure Q: what are two primary factors affecting atmospheric pressure?  Density Temperature ~1000 mb/12 km
  • 4.
    4 Idea gas law Pressure~ density * Temperature Q: So, from the ideal gas law, how can change the pressure of a gas? by increasing/decreasing density by increasing/decreasing temperature
  • 5.
    What is this? Thisis the model of a person, but not real.
  • 6.
    We are touse a model to understand how an atmospheric circulation is produced.
  • 7.
    7 Wind is producedby pressure difference How? play a model Assume two columns have same density, same temperature, …
  • 8.
    Air pressure =total air weight per unit area of the atmospheric column above z P0 P1 ? P1=total air weight P1 P0 P0=total air weight P0 P1
  • 9.
    Air pressure =total air weight per unit area of the atmospheric column above z P0 P1 P4 P2 P3 P4 Mount Everest 8,848 m P3 P2 P1 P0 Pressure decreases with increasing of height
  • 10.
    10 Wind is producedby pressure difference How? play a model Assume two columns have same density, same temperature, … Q: What happens if the column 1 cools and column 2 warms?
  • 11.
    11 Wind is producedby pressure difference How? play a model Q: At which location (A or B), pressure will be higher? Q: As a result, will air move from the cold to warm column or from the warm to cold column? A B Fig. 6-2, p. 143
  • 12.
    12 Wind is producedby pressure difference How? play a model air moves from the warm column to cold column due to pressure difference Rule surface pressure is high as the air sinks above the surface, and surface pressure is low as the air rises above the surface Fig. 6-2, p. 143
  • 13.
    Rule Cool surface air sinking  high surface pressure Warm surface air rising  low surface pressure Wind is blowing from high pressure to low pressure Where is clear sky? Cool High P Warm Low P
  • 14.
    Surface pressure chart 14 isobars(lines of constant pressure) are plotted every 4 mb Q: how is a pressure chart created from observations around the country? a problem is that not all stations are at sea level Q: how can we correct this problem?
  • 15.
    Surface pressure chart Rule inthe lower part of atmosphere, pressure changes about 10 mb for every 100 meters of elevation changes use this rule, we adjust all pressure measurements to sea level, producing a constant elevation sea-level pressure chart, commonly refer to surface weather map 15
  • 16.
    16 Tropopause height varieswith latitude Tropopause height is proportional to mean tropospheric temperature Q: what percent of air is below 200mb level? 1000 200 1000 100% 800 100% 80% 1000 200mb Q: What would the pressure change from EQ to NP at level of Z = 5km? 500 mb 5 km 200mb pressure would decrease as you move northward 700 mb 500 mb 700 mb
  • 17.
    17 Isobaric Charts 500mblevel Each contour line tells us the elevation above sea level at which pressure is 500 mb Q: what is difference between isobar and contour line?
  • 18.
    18 Isobaric Charts 500mblevel Wavelike patterns of surface chart
  • 19.
    Isobaric Charts 19 Q: whereis the ridge? Where is the trough? Ridge Warm air aloft is associated with a ridge. Cold air aloft is associated with a trough. Trough
  • 20.
    Ridges and Troughs N E Ridge Warmair aloft Cold air aloft Trough
  • 21.
    21 Isobaric Charts The tablebelow gives the “approximate” altitudes of common isobaric charts used in meteorology Isobaric Surface (mb) Approximate Elevation (m) 1000 120 850 1,460 700 3,000 500 5,600 300 9,180 200 11,800 100 16,200