Downloaded 2,105 times
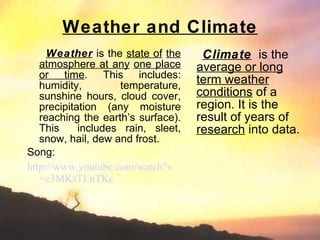
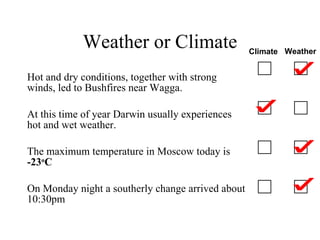
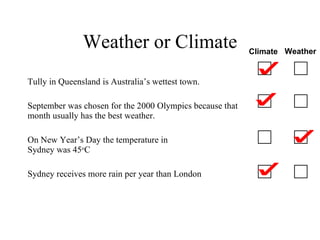
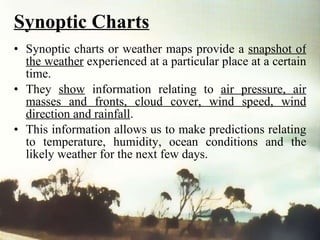
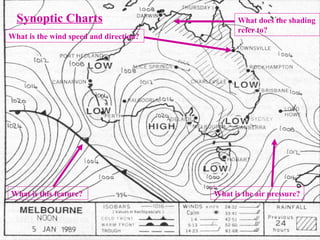
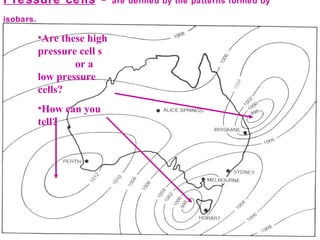
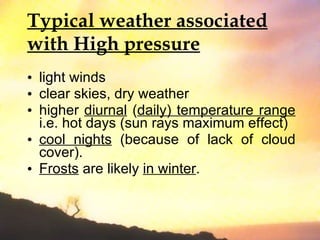
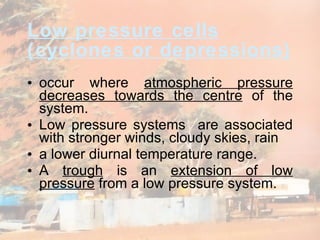
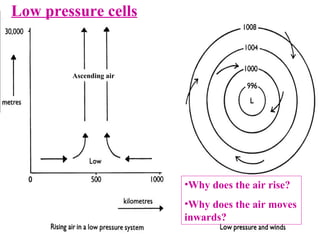
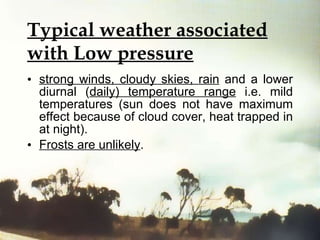
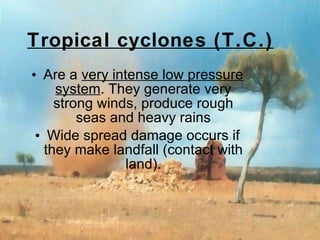
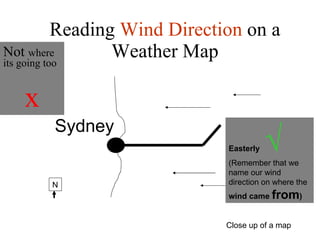
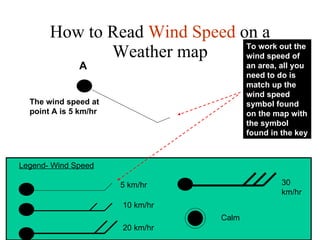
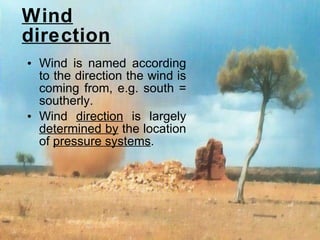
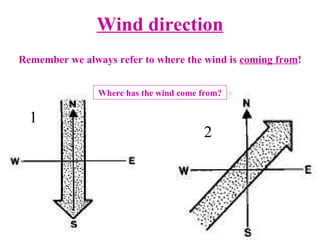
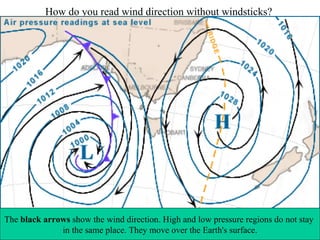
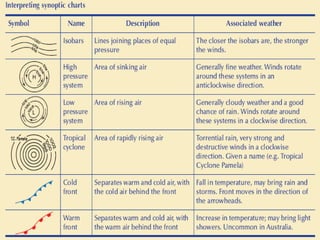
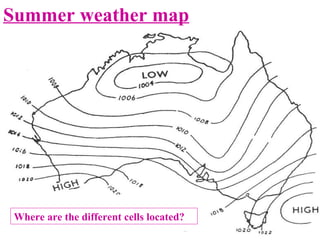
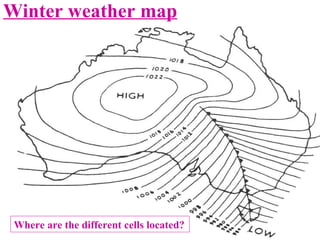
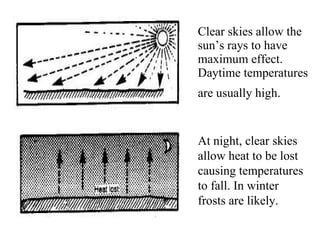
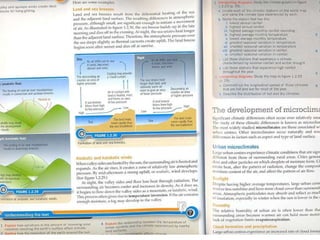

The document discusses various weather and climate concepts including: - Weather is the current atmospheric conditions while climate is the average weather over time. - High pressure systems are associated with clear skies and dry conditions while low pressure systems bring clouds and rain. - Weather maps use lines of equal pressure (isobars) and symbols to show wind speed and direction helping predict future conditions.


