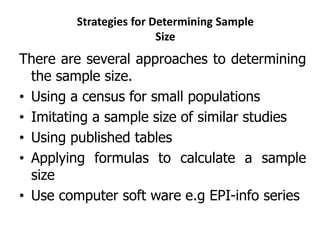
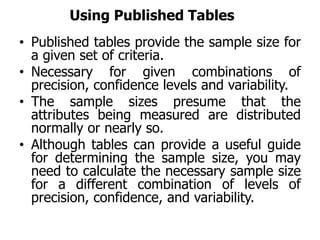
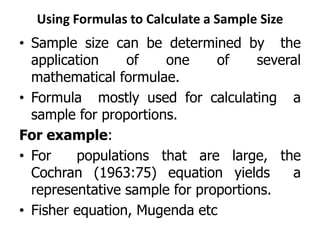
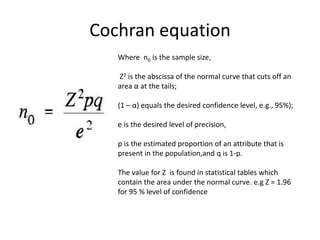
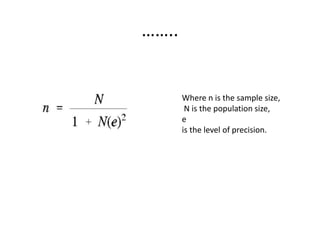
SlideShare a Scribd company logo
SAMPLE SIZE DETERMINATION
AND SAMPLING TECHNIQUES
BY AMUGUNE B.K
MENTAL HEALTH WORKSHOP
MAANZONI, 15TH OCTOBER 2014
What size sample do I need?”
The answer to this question is influenced by a
number of factors, including:
• the purpose of the study, population size,
the risk of selecting a “bad” sample and the
allowable sampling error.
• Data analysis plan e.g number of cells one
will have in cross tabulation
• Most of all whether undertaking a
qualitative or quantitative study
Sample size determination in
qualitative study
• Probability sampling not appropriate as
sample not intended to be statistically
representative
• But, sample should have ability to
represent salient characteristics in
population.
• Sample size taken until point of theoretical
saturation
…….
• Sample size is usually small to allow in-
depth exploration and understanding of
phenomena under investigation
• Ultimately a matter of judgement and
expertise in evaluating the quality of
information against final use, research
methodology , sampling strategy and results
is necessary.
• In practice, qualitative sampling usually
requires a flexible, pragmatic approach.
…..
• The researcher actively selects the most productive
sample to answer the research question.
• This can involve developing a framework of the
variables that might influence an individual's
contribution and will be based on the researcher's
practical knowledge of the research area, the
available literature and evidence from the study
itself.
• This is a more intellectual strategy than the simple
demographic stratification of epidemiological
studies, though age, gender and social class might
be important variables.
…….
• If the subjects are known to the researcher, they
may be stratified according to known public attitudes
or beliefs
• It may be advantageous to study a broad range of
subjects :
• (maximum variation sample)
• outliers (deviant sample)
• subjects who have specific experiences (critical
case sample)
• subjects with special expertise (key informant
sample).
…….
• The iterative process of qualitative study design
means that samples are usually theory driven (
theoretical sampling) to a greater or lesser
extent
• Theoretical sampling necessitates building
interpretative theories from the emerging data
and selecting a new sample to examine and
elaborate on this theory.
• It is the principal strategy for the grounded
theoretical approach .
Some suggestions of sample size in
qualitative studies
• The smallest number of participants should be 15
• Should lie under 50
• 6-8 participants for FGDs AND at least 2 FGDs per
population group
IMPORTANT
• Attainment of saturation
• Justification of choice of number
Sampling strategy in qualitative study/ Non-
Random Sampling Methods
1. Convenience sampling
• This is the least rigorous technique, involving the
selection
• of the subjects.
• Using group that is handy/available, most accessible (or
volunteers) in terms of time, effort and money,
• but may result in poor quality data and lacks intellectual
credibility.
• There is an element of convenience sampling in many
qualitative studies, but a more thoughtful approach to
selection of a sample is usually justified.
• Avoid, if possible, since tend not to be representative
due to homogeneity of groups
2. Purposive/ Judgment sampling
• most common
• Using personal judgment to select sample
that should be representative OR selecting
those who are known to have needed
information.
• Snowball is a type (used with hard to
identify groups such as addicts)
other considerations in qualitative in sample
size determination
• Multiple replications
– enhances generalization when non-random
sampling is used e.g use of > 1 FGD
• Ecological generalization may also be
used
– generalise to other settings/conditions, such
as using a method tested in math for English
class
Sample size determination in
quantitative study
Several criteria will need to be specified to
determine the appropriate sample size:
–Level of precision,
–Level of confidence or risk,
–Degree of variability in the attributes
being measured ( prevalence)
–External validity
…….
• The Level of Precision-sometimes called sampling
error
– range in which the true value of the population is
estimated to be.
– This range is often expressed in percentage
points (e.g., ±5 percent).
• The Confidence Level
– based on ideas encompassed under the Central
Limit Theorem.
– E.g a 95% confidence level is selected, 95 out of
100 samples will have the true population value
within the range of precision
…….
Degree of Variability
–refers to the distribution of attributes in
the population.
–The more heterogeneous a population,
the larger the sample size required to
obtain a given level of precision.
–The less variable (more homogeneous)
a population, the smaller the sample
size.
……
• A proportion of 50 % indicates a greater level of
variability than either 20% or 80%. This is
because 20% and 80% indicate that a large
majority do not or do, respectively, have the
attribute of interest.
• Because a proportion of 0.5 indicates the
maximum variability in a population, it is often
used in determining a more conservative sample
size, that is, the sample size may be larger than
if the true variability of the population attribute
were used.
……
• Sample size affects accuracy of
representation; Larger sample means less
chance of error
• Minimum suggested sample is 30 and upper
limit is 1,000
External validity – how well sample generalizes
to the population, a representative sample is
required (not the same thing as variety in a
sample)
Strategies for Determining Sample
Size
There are several approaches to determining
the sample size.
• Using a census for small populations
• Imitating a sample size of similar studies
• Using published tables
• Applying formulas to calculate a sample
size
• Use computer soft ware e.g EPI-info series
Using a Census for Small Populations
….
• One approach is to use the entire population as the
sample.
• Although cost considerations make this impossible for
large populations.
• Attractive for small populations (e.g., 200 or less).
• Eliminates sampling error and provides data on all
the individuals in the population.
• Some costs such as questionnaire design and
developing the sampling frame are “fixed,” that is,
they will be the same for samples of 50 or 200.
• Finally, virtually the entire population would have to
be sampled in small populations to achieve a
desirable level of precision
Using a Sample Size of a Similar Study
• Use the same sample size as those of studies
similar to the one you plan( Cite reference).
• Without reviewing the procedures employed
in these studies you may run the risk of
repeating errors that were made in
determining the sample size for another study.
• However, a review of the literature in your
discipline can provide guidance about
“typical” sample sizes that are used.
Using Published Tables
• Published tables provide the sample size for
a given set of criteria.
• Necessary for given combinations of
precision, confidence levels and variability.
• The sample sizes presume that the
attributes being measured are distributed
normally or nearly so.
• Although tables can provide a useful guide
for determining the sample size, you may
need to calculate the necessary sample size
for a different combination of levels of
precision, confidence, and variability.
Sample Size for ±5%, ±7% and ±10% Precision Levels
where Confidence Level Is 95% and P=.5.
Size of
Population
Sample Size (n) for Precision (e) of:
±5% ±7% ±10%
100 81 67 51
125 96 78 56
150 110 86 61
175 122 94 64
200 134 101 67
225 144 107 70
250 154 112 72
275 163 117 74
300 172 121 76
325 180 125 77
350 187 129 78
375 194 132 80
400 201 135 81
425 207 138 82
450 212 140 82
Using Formulas to Calculate a Sample Size
• Sample size can be determined by the
application of one of several
mathematical formulae.
• Formula mostly used for calculating a
sample for proportions.
For example:
• For populations that are large, the
Cochran (1963:75) equation yields a
representative sample for proportions.
• Fisher equation, Mugenda etc
Cochran equation
Where n0 is the sample size,
Z2 is the abscissa of the normal curve that cuts off an
area α at the tails;
(1 – α) equals the desired confidence level, e.g., 95%);
e is the desired level of precision,
p is the estimated proportion of an attribute that is
present in the population,and q is 1-p.
The value for Z is found in statistical tables which
contain the area under the normal curve. e.g Z = 1.96
for 95 % level of confidence
…..
A Simplified Formula For Proportions
• Yamane (1967:886) provides a simplified
formula to calculate sample sizes.
• ASSUMPTION:
– 95% confidence level
– P = .5 ;
……..
Where n is the sample size,
N is the population size,
e
is the level of precision.
Finite population correction for proportions
• With finite populations, correction for
proportions is necessary
• If the population is small then the sample size
can be reduced slightly.
• This is because a given sample size provides
proportionately more information for a small
population than for a large population.
• The sample size (n0) can thus be adjusted using
the corrected formulae
…..
Where n is the sample size
N is the population size.
no is calculated sample size
for infinite population
Note
• The sample size formulas provide the number
of responses that need to be obtained. Many
researchers commonly add 10 % to the
sample size to compensate for persons that
the researcher is unable to contact.
• The sample size also is often increased by 30
% to compensate for non-response ( e.g self
administered questionnaires).
Use of software in sample size determination
Depending on type of study and specific software Some
information will be required:
• Population sample size, population standard deviation,
population sampling error, confidence level, z –value,
power of study etc …
• 80% power in a clinical trial means that the study has
a 80% chance of ending up with a p value of less than
5% in a statistical test (i.e. a statistically significant
treatment effect) if there really was an important
difference (e.g. 10% versus 5% mortality) between
treatments.
Further considerations
• The above approaches to determining sample
size have assumed that a simple random
sample is the sampling design.
• More complex designs, e.g. case control
studies etc , one must take into account the
variances of sub-populations, strata, or
clusters before an estimate of the variability in
the population as a whole can be made.
Sampling strategies in quantitative
research
Simple random sampling
• e.g Names in a hat or table of random
numbers
• Larger samples more likely to represent
population
• Any difference between population and
sample is random and small (random
sampling error)
Stratified random sampling
• Ensures small subgroups (strata) are
represented
• Normally proportional to their part of
population
• Break population into strata, then
randomly select within strata
• Multistage sampling
Cluster random sampling
• Select groups as sample units rather than
individuals
• REQUIRES a large number of groups/clusters
• Multistage sampling
Systematic (Nth) sampling
• Either Considered random or non
random
• Random- if list is randomly ordered
• nonrandom- systematic with random
starting point
• Divide population size by sample size
to get N (population size/sample
size=Nth)

More Related Content

What's hot (20)

Sample size calculation
Sample size calculationSample size calculation
Sample size calculation
 
Sample size calculation
Sample  size calculationSample  size calculation
Sample size calculation
 
Sample size
Sample sizeSample size
Sample size
 
Sample size
Sample sizeSample size
Sample size
 
Cross sectional study
Cross sectional studyCross sectional study
Cross sectional study
 
Calculating p value
Calculating p valueCalculating p value
Calculating p value
 
SAMPLE SIZE CALCULATION IN DIFFERENT STUDY DESIGNS AT.pptx
SAMPLE SIZE CALCULATION IN DIFFERENT STUDY DESIGNS AT.pptxSAMPLE SIZE CALCULATION IN DIFFERENT STUDY DESIGNS AT.pptx
SAMPLE SIZE CALCULATION IN DIFFERENT STUDY DESIGNS AT.pptx
 
Sample and sample size
Sample and sample sizeSample and sample size
Sample and sample size
 
Study designs
Study designsStudy designs
Study designs
 
Bias in Research
Bias in ResearchBias in Research
Bias in Research
 
Health system research
Health system researchHealth system research
Health system research
 
Sample size calculations
Sample size calculationsSample size calculations
Sample size calculations
 
Study designs in epidemiology
Study designs in epidemiologyStudy designs in epidemiology
Study designs in epidemiology
 
Sample Size Determination
Sample Size DeterminationSample Size Determination
Sample Size Determination
 
Confidence Intervals: Basic concepts and overview
Confidence Intervals: Basic concepts and overviewConfidence Intervals: Basic concepts and overview
Confidence Intervals: Basic concepts and overview
 
Nested case control study
Nested case control studyNested case control study
Nested case control study
 
Sampling and sample size determination
Sampling and sample size determinationSampling and sample size determination
Sampling and sample size determination
 
Statistical Power
Statistical PowerStatistical Power
Statistical Power
 
Sampling and its variability
Sampling  and its variabilitySampling  and its variability
Sampling and its variability
 
Sampling and Sample Types
Sampling  and Sample TypesSampling  and Sample Types
Sampling and Sample Types
 

Similar to SAMPLE SIZE DETERMINATION.ppt

Similar to SAMPLE SIZE DETERMINATION.ppt (20)

GROUP 1 biostatistics ,sample size and epid.pptx
GROUP 1 biostatistics ,sample size and epid.pptxGROUP 1 biostatistics ,sample size and epid.pptx
GROUP 1 biostatistics ,sample size and epid.pptx
 
Sampling
SamplingSampling
Sampling
 
Sampling
SamplingSampling
Sampling
 
4 Inferential Statistics IV - April 7 2014.pdf
4 Inferential Statistics IV - April 7 2014.pdf4 Inferential Statistics IV - April 7 2014.pdf
4 Inferential Statistics IV - April 7 2014.pdf
 
2RM2 PPT.pptx
2RM2 PPT.pptx2RM2 PPT.pptx
2RM2 PPT.pptx
 
Chapter_2_Sampling.pptx
Chapter_2_Sampling.pptxChapter_2_Sampling.pptx
Chapter_2_Sampling.pptx
 
Sampling and sampling techniques as a part of research.pptx
Sampling and sampling techniques as a part of research.pptxSampling and sampling techniques as a part of research.pptx
Sampling and sampling techniques as a part of research.pptx
 
Sampling Theory.pdf
Sampling Theory.pdfSampling Theory.pdf
Sampling Theory.pdf
 
Mangasini ppt lect_sample size determination
Mangasini ppt lect_sample size determinationMangasini ppt lect_sample size determination
Mangasini ppt lect_sample size determination
 
samplesizecalculations-1801190731542.ppt
samplesizecalculations-1801190731542.pptsamplesizecalculations-1801190731542.ppt
samplesizecalculations-1801190731542.ppt
 
2_Lecture 2_Confidence_Interval_3.pdf
2_Lecture 2_Confidence_Interval_3.pdf2_Lecture 2_Confidence_Interval_3.pdf
2_Lecture 2_Confidence_Interval_3.pdf
 
Business research sampling
Business research samplingBusiness research sampling
Business research sampling
 
Bmgt 311 chapter_10
Bmgt 311 chapter_10Bmgt 311 chapter_10
Bmgt 311 chapter_10
 
Statr sessions 11 to 12
Statr sessions 11 to 12Statr sessions 11 to 12
Statr sessions 11 to 12
 
Introduction to sampling
Introduction to samplingIntroduction to sampling
Introduction to sampling
 
Sampling brm chap-4
Sampling brm chap-4Sampling brm chap-4
Sampling brm chap-4
 
Study Session 15.pptx
Study Session 15.pptxStudy Session 15.pptx
Study Session 15.pptx
 
AAU. Chapter.5 Sampling Methods.pptx
AAU. Chapter.5 Sampling Methods.pptxAAU. Chapter.5 Sampling Methods.pptx
AAU. Chapter.5 Sampling Methods.pptx
 
Brm chap-4 present-updated
Brm chap-4 present-updatedBrm chap-4 present-updated
Brm chap-4 present-updated
 
Sampling
SamplingSampling
Sampling
 

Recently uploaded

Mission to Decommission: Importance of Decommissioning Products to Increase E...
Mission to Decommission: Importance of Decommissioning Products to Increase E...Mission to Decommission: Importance of Decommissioning Products to Increase E...
Mission to Decommission: Importance of Decommissioning Products to Increase E...Product School
 
Integrating Telephony Systems with Salesforce: Insights and Considerations, B...
Integrating Telephony Systems with Salesforce: Insights and Considerations, B...Integrating Telephony Systems with Salesforce: Insights and Considerations, B...
Integrating Telephony Systems with Salesforce: Insights and Considerations, B...CzechDreamin
 
AI revolution and Salesforce, Jiří Karpíšek
AI revolution and Salesforce, Jiří KarpíšekAI revolution and Salesforce, Jiří Karpíšek
AI revolution and Salesforce, Jiří KarpíšekCzechDreamin
 
Unsubscribed: Combat Subscription Fatigue With a Membership Mentality by Head...
Unsubscribed: Combat Subscription Fatigue With a Membership Mentality by Head...Unsubscribed: Combat Subscription Fatigue With a Membership Mentality by Head...
Unsubscribed: Combat Subscription Fatigue With a Membership Mentality by Head...Product School
 
Measures in SQL (a talk at SF Distributed Systems meetup, 2024-05-22)
Measures in SQL (a talk at SF Distributed Systems meetup, 2024-05-22)Measures in SQL (a talk at SF Distributed Systems meetup, 2024-05-22)
Measures in SQL (a talk at SF Distributed Systems meetup, 2024-05-22)Julian Hyde
 
Exploring UiPath Orchestrator API: updates and limits in 2024 🚀
Exploring UiPath Orchestrator API: updates and limits in 2024 🚀Exploring UiPath Orchestrator API: updates and limits in 2024 🚀
Exploring UiPath Orchestrator API: updates and limits in 2024 🚀DianaGray10
 
How world-class product teams are winning in the AI era by CEO and Founder, P...
How world-class product teams are winning in the AI era by CEO and Founder, P...How world-class product teams are winning in the AI era by CEO and Founder, P...
How world-class product teams are winning in the AI era by CEO and Founder, P...Product School
 
Salesforce Adoption – Metrics, Methods, and Motivation, Antone Kom
Salesforce Adoption – Metrics, Methods, and Motivation, Antone KomSalesforce Adoption – Metrics, Methods, and Motivation, Antone Kom
Salesforce Adoption – Metrics, Methods, and Motivation, Antone KomCzechDreamin
 
Kubernetes & AI - Beauty and the Beast !?! @KCD Istanbul 2024
Kubernetes & AI - Beauty and the Beast !?! @KCD Istanbul 2024Kubernetes & AI - Beauty and the Beast !?! @KCD Istanbul 2024
Kubernetes & AI - Beauty and the Beast !?! @KCD Istanbul 2024Tobias Schneck
 
From Daily Decisions to Bottom Line: Connecting Product Work to Revenue by VP...
From Daily Decisions to Bottom Line: Connecting Product Work to Revenue by VP...From Daily Decisions to Bottom Line: Connecting Product Work to Revenue by VP...
From Daily Decisions to Bottom Line: Connecting Product Work to Revenue by VP...Product School
 
Unpacking Value Delivery - Agile Oxford Meetup - May 2024.pptx
Unpacking Value Delivery - Agile Oxford Meetup - May 2024.pptxUnpacking Value Delivery - Agile Oxford Meetup - May 2024.pptx
Unpacking Value Delivery - Agile Oxford Meetup - May 2024.pptxDavid Michel
 
ODC, Data Fabric and Architecture User Group
ODC, Data Fabric and Architecture User GroupODC, Data Fabric and Architecture User Group
ODC, Data Fabric and Architecture User GroupCatarinaPereira64715
 
From Siloed Products to Connected Ecosystem: Building a Sustainable and Scala...
From Siloed Products to Connected Ecosystem: Building a Sustainable and Scala...From Siloed Products to Connected Ecosystem: Building a Sustainable and Scala...
From Siloed Products to Connected Ecosystem: Building a Sustainable and Scala...Product School
 
Key Trends Shaping the Future of Infrastructure.pdf
Key Trends Shaping the Future of Infrastructure.pdfKey Trends Shaping the Future of Infrastructure.pdf
Key Trends Shaping the Future of Infrastructure.pdfCheryl Hung
 
Knowledge engineering: from people to machines and back
Knowledge engineering: from people to machines and backKnowledge engineering: from people to machines and back
Knowledge engineering: from people to machines and backElena Simperl
 
WSO2CONMay2024OpenSourceConferenceDebrief.pptx
WSO2CONMay2024OpenSourceConferenceDebrief.pptxWSO2CONMay2024OpenSourceConferenceDebrief.pptx
WSO2CONMay2024OpenSourceConferenceDebrief.pptxJennifer Lim
 
"Impact of front-end architecture on development cost", Viktor Turskyi
"Impact of front-end architecture on development cost", Viktor Turskyi"Impact of front-end architecture on development cost", Viktor Turskyi
"Impact of front-end architecture on development cost", Viktor TurskyiFwdays
 
Search and Society: Reimagining Information Access for Radical Futures
Search and Society: Reimagining Information Access for Radical FuturesSearch and Society: Reimagining Information Access for Radical Futures
Search and Society: Reimagining Information Access for Radical FuturesBhaskar Mitra
 
Future Visions: Predictions to Guide and Time Tech Innovation, Peter Udo Diehl
Future Visions: Predictions to Guide and Time Tech Innovation, Peter Udo DiehlFuture Visions: Predictions to Guide and Time Tech Innovation, Peter Udo Diehl
Future Visions: Predictions to Guide and Time Tech Innovation, Peter Udo DiehlPeter Udo Diehl
 
10 Differences between Sales Cloud and CPQ, Blanka Doktorová
10 Differences between Sales Cloud and CPQ, Blanka Doktorová10 Differences between Sales Cloud and CPQ, Blanka Doktorová
10 Differences between Sales Cloud and CPQ, Blanka DoktorováCzechDreamin
 

Recently uploaded (20)

Mission to Decommission: Importance of Decommissioning Products to Increase E...
Mission to Decommission: Importance of Decommissioning Products to Increase E...Mission to Decommission: Importance of Decommissioning Products to Increase E...
Mission to Decommission: Importance of Decommissioning Products to Increase E...
 
Integrating Telephony Systems with Salesforce: Insights and Considerations, B...
Integrating Telephony Systems with Salesforce: Insights and Considerations, B...Integrating Telephony Systems with Salesforce: Insights and Considerations, B...
Integrating Telephony Systems with Salesforce: Insights and Considerations, B...
 
AI revolution and Salesforce, Jiří Karpíšek
AI revolution and Salesforce, Jiří KarpíšekAI revolution and Salesforce, Jiří Karpíšek
AI revolution and Salesforce, Jiří Karpíšek
 
Unsubscribed: Combat Subscription Fatigue With a Membership Mentality by Head...
Unsubscribed: Combat Subscription Fatigue With a Membership Mentality by Head...Unsubscribed: Combat Subscription Fatigue With a Membership Mentality by Head...
Unsubscribed: Combat Subscription Fatigue With a Membership Mentality by Head...
 
Measures in SQL (a talk at SF Distributed Systems meetup, 2024-05-22)
Measures in SQL (a talk at SF Distributed Systems meetup, 2024-05-22)Measures in SQL (a talk at SF Distributed Systems meetup, 2024-05-22)
Measures in SQL (a talk at SF Distributed Systems meetup, 2024-05-22)
 
Exploring UiPath Orchestrator API: updates and limits in 2024 🚀
Exploring UiPath Orchestrator API: updates and limits in 2024 🚀Exploring UiPath Orchestrator API: updates and limits in 2024 🚀
Exploring UiPath Orchestrator API: updates and limits in 2024 🚀
 
How world-class product teams are winning in the AI era by CEO and Founder, P...
How world-class product teams are winning in the AI era by CEO and Founder, P...How world-class product teams are winning in the AI era by CEO and Founder, P...
How world-class product teams are winning in the AI era by CEO and Founder, P...
 
Salesforce Adoption – Metrics, Methods, and Motivation, Antone Kom
Salesforce Adoption – Metrics, Methods, and Motivation, Antone KomSalesforce Adoption – Metrics, Methods, and Motivation, Antone Kom
Salesforce Adoption – Metrics, Methods, and Motivation, Antone Kom
 
Kubernetes & AI - Beauty and the Beast !?! @KCD Istanbul 2024
Kubernetes & AI - Beauty and the Beast !?! @KCD Istanbul 2024Kubernetes & AI - Beauty and the Beast !?! @KCD Istanbul 2024
Kubernetes & AI - Beauty and the Beast !?! @KCD Istanbul 2024
 
From Daily Decisions to Bottom Line: Connecting Product Work to Revenue by VP...
From Daily Decisions to Bottom Line: Connecting Product Work to Revenue by VP...From Daily Decisions to Bottom Line: Connecting Product Work to Revenue by VP...
From Daily Decisions to Bottom Line: Connecting Product Work to Revenue by VP...
 
Unpacking Value Delivery - Agile Oxford Meetup - May 2024.pptx
Unpacking Value Delivery - Agile Oxford Meetup - May 2024.pptxUnpacking Value Delivery - Agile Oxford Meetup - May 2024.pptx
Unpacking Value Delivery - Agile Oxford Meetup - May 2024.pptx
 
ODC, Data Fabric and Architecture User Group
ODC, Data Fabric and Architecture User GroupODC, Data Fabric and Architecture User Group
ODC, Data Fabric and Architecture User Group
 
From Siloed Products to Connected Ecosystem: Building a Sustainable and Scala...
From Siloed Products to Connected Ecosystem: Building a Sustainable and Scala...From Siloed Products to Connected Ecosystem: Building a Sustainable and Scala...
From Siloed Products to Connected Ecosystem: Building a Sustainable and Scala...
 
Key Trends Shaping the Future of Infrastructure.pdf
Key Trends Shaping the Future of Infrastructure.pdfKey Trends Shaping the Future of Infrastructure.pdf
Key Trends Shaping the Future of Infrastructure.pdf
 
Knowledge engineering: from people to machines and back
Knowledge engineering: from people to machines and backKnowledge engineering: from people to machines and back
Knowledge engineering: from people to machines and back
 
WSO2CONMay2024OpenSourceConferenceDebrief.pptx
WSO2CONMay2024OpenSourceConferenceDebrief.pptxWSO2CONMay2024OpenSourceConferenceDebrief.pptx
WSO2CONMay2024OpenSourceConferenceDebrief.pptx
 
"Impact of front-end architecture on development cost", Viktor Turskyi
"Impact of front-end architecture on development cost", Viktor Turskyi"Impact of front-end architecture on development cost", Viktor Turskyi
"Impact of front-end architecture on development cost", Viktor Turskyi
 
Search and Society: Reimagining Information Access for Radical Futures
Search and Society: Reimagining Information Access for Radical FuturesSearch and Society: Reimagining Information Access for Radical Futures
Search and Society: Reimagining Information Access for Radical Futures
 
Future Visions: Predictions to Guide and Time Tech Innovation, Peter Udo Diehl
Future Visions: Predictions to Guide and Time Tech Innovation, Peter Udo DiehlFuture Visions: Predictions to Guide and Time Tech Innovation, Peter Udo Diehl
Future Visions: Predictions to Guide and Time Tech Innovation, Peter Udo Diehl
 
10 Differences between Sales Cloud and CPQ, Blanka Doktorová
10 Differences between Sales Cloud and CPQ, Blanka Doktorová10 Differences between Sales Cloud and CPQ, Blanka Doktorová
10 Differences between Sales Cloud and CPQ, Blanka Doktorová
 

SAMPLE SIZE DETERMINATION.ppt

  • 1. SAMPLE SIZE DETERMINATION AND SAMPLING TECHNIQUES BY AMUGUNE B.K MENTAL HEALTH WORKSHOP MAANZONI, 15TH OCTOBER 2014
  • 2. What size sample do I need?” The answer to this question is influenced by a number of factors, including: • the purpose of the study, population size, the risk of selecting a “bad” sample and the allowable sampling error. • Data analysis plan e.g number of cells one will have in cross tabulation • Most of all whether undertaking a qualitative or quantitative study
  • 3. Sample size determination in qualitative study • Probability sampling not appropriate as sample not intended to be statistically representative • But, sample should have ability to represent salient characteristics in population. • Sample size taken until point of theoretical saturation
  • 4. ……. • Sample size is usually small to allow in- depth exploration and understanding of phenomena under investigation • Ultimately a matter of judgement and expertise in evaluating the quality of information against final use, research methodology , sampling strategy and results is necessary. • In practice, qualitative sampling usually requires a flexible, pragmatic approach.
  • 5. ….. • The researcher actively selects the most productive sample to answer the research question. • This can involve developing a framework of the variables that might influence an individual's contribution and will be based on the researcher's practical knowledge of the research area, the available literature and evidence from the study itself. • This is a more intellectual strategy than the simple demographic stratification of epidemiological studies, though age, gender and social class might be important variables.
  • 6. ……. • If the subjects are known to the researcher, they may be stratified according to known public attitudes or beliefs • It may be advantageous to study a broad range of subjects : • (maximum variation sample) • outliers (deviant sample) • subjects who have specific experiences (critical case sample) • subjects with special expertise (key informant sample).
  • 7. ……. • The iterative process of qualitative study design means that samples are usually theory driven ( theoretical sampling) to a greater or lesser extent • Theoretical sampling necessitates building interpretative theories from the emerging data and selecting a new sample to examine and elaborate on this theory. • It is the principal strategy for the grounded theoretical approach .
  • 8. Some suggestions of sample size in qualitative studies • The smallest number of participants should be 15 • Should lie under 50 • 6-8 participants for FGDs AND at least 2 FGDs per population group IMPORTANT • Attainment of saturation • Justification of choice of number
  • 9. Sampling strategy in qualitative study/ Non- Random Sampling Methods 1. Convenience sampling • This is the least rigorous technique, involving the selection • of the subjects. • Using group that is handy/available, most accessible (or volunteers) in terms of time, effort and money, • but may result in poor quality data and lacks intellectual credibility. • There is an element of convenience sampling in many qualitative studies, but a more thoughtful approach to selection of a sample is usually justified. • Avoid, if possible, since tend not to be representative due to homogeneity of groups
  • 10. 2. Purposive/ Judgment sampling • most common • Using personal judgment to select sample that should be representative OR selecting those who are known to have needed information. • Snowball is a type (used with hard to identify groups such as addicts)
  • 11. other considerations in qualitative in sample size determination • Multiple replications – enhances generalization when non-random sampling is used e.g use of > 1 FGD • Ecological generalization may also be used – generalise to other settings/conditions, such as using a method tested in math for English class
  • 12. Sample size determination in quantitative study Several criteria will need to be specified to determine the appropriate sample size: –Level of precision, –Level of confidence or risk, –Degree of variability in the attributes being measured ( prevalence) –External validity
  • 13. ……. • The Level of Precision-sometimes called sampling error – range in which the true value of the population is estimated to be. – This range is often expressed in percentage points (e.g., ±5 percent). • The Confidence Level – based on ideas encompassed under the Central Limit Theorem. – E.g a 95% confidence level is selected, 95 out of 100 samples will have the true population value within the range of precision
  • 14. ……. Degree of Variability –refers to the distribution of attributes in the population. –The more heterogeneous a population, the larger the sample size required to obtain a given level of precision. –The less variable (more homogeneous) a population, the smaller the sample size.
  • 15. …… • A proportion of 50 % indicates a greater level of variability than either 20% or 80%. This is because 20% and 80% indicate that a large majority do not or do, respectively, have the attribute of interest. • Because a proportion of 0.5 indicates the maximum variability in a population, it is often used in determining a more conservative sample size, that is, the sample size may be larger than if the true variability of the population attribute were used.
  • 16. …… • Sample size affects accuracy of representation; Larger sample means less chance of error • Minimum suggested sample is 30 and upper limit is 1,000 External validity – how well sample generalizes to the population, a representative sample is required (not the same thing as variety in a sample)
  • 17. Strategies for Determining Sample Size There are several approaches to determining the sample size. • Using a census for small populations • Imitating a sample size of similar studies • Using published tables • Applying formulas to calculate a sample size • Use computer soft ware e.g EPI-info series
  • 18. Using a Census for Small Populations …. • One approach is to use the entire population as the sample. • Although cost considerations make this impossible for large populations. • Attractive for small populations (e.g., 200 or less). • Eliminates sampling error and provides data on all the individuals in the population. • Some costs such as questionnaire design and developing the sampling frame are “fixed,” that is, they will be the same for samples of 50 or 200. • Finally, virtually the entire population would have to be sampled in small populations to achieve a desirable level of precision
  • 19. Using a Sample Size of a Similar Study • Use the same sample size as those of studies similar to the one you plan( Cite reference). • Without reviewing the procedures employed in these studies you may run the risk of repeating errors that were made in determining the sample size for another study. • However, a review of the literature in your discipline can provide guidance about “typical” sample sizes that are used.
  • 20. Using Published Tables • Published tables provide the sample size for a given set of criteria. • Necessary for given combinations of precision, confidence levels and variability. • The sample sizes presume that the attributes being measured are distributed normally or nearly so. • Although tables can provide a useful guide for determining the sample size, you may need to calculate the necessary sample size for a different combination of levels of precision, confidence, and variability.
  • 21. Sample Size for ±5%, ±7% and ±10% Precision Levels where Confidence Level Is 95% and P=.5. Size of Population Sample Size (n) for Precision (e) of: ±5% ±7% ±10% 100 81 67 51 125 96 78 56 150 110 86 61 175 122 94 64 200 134 101 67 225 144 107 70 250 154 112 72 275 163 117 74 300 172 121 76 325 180 125 77 350 187 129 78 375 194 132 80 400 201 135 81 425 207 138 82 450 212 140 82
  • 22. Using Formulas to Calculate a Sample Size • Sample size can be determined by the application of one of several mathematical formulae. • Formula mostly used for calculating a sample for proportions. For example: • For populations that are large, the Cochran (1963:75) equation yields a representative sample for proportions. • Fisher equation, Mugenda etc
  • 23. Cochran equation Where n0 is the sample size, Z2 is the abscissa of the normal curve that cuts off an area α at the tails; (1 – α) equals the desired confidence level, e.g., 95%); e is the desired level of precision, p is the estimated proportion of an attribute that is present in the population,and q is 1-p. The value for Z is found in statistical tables which contain the area under the normal curve. e.g Z = 1.96 for 95 % level of confidence
  • 24. ….. A Simplified Formula For Proportions • Yamane (1967:886) provides a simplified formula to calculate sample sizes. • ASSUMPTION: – 95% confidence level – P = .5 ;
  • 25. …….. Where n is the sample size, N is the population size, e is the level of precision.
  • 26. Finite population correction for proportions • With finite populations, correction for proportions is necessary • If the population is small then the sample size can be reduced slightly. • This is because a given sample size provides proportionately more information for a small population than for a large population. • The sample size (n0) can thus be adjusted using the corrected formulae
  • 27. ….. Where n is the sample size N is the population size. no is calculated sample size for infinite population
  • 28. Note • The sample size formulas provide the number of responses that need to be obtained. Many researchers commonly add 10 % to the sample size to compensate for persons that the researcher is unable to contact. • The sample size also is often increased by 30 % to compensate for non-response ( e.g self administered questionnaires).
  • 29. Use of software in sample size determination Depending on type of study and specific software Some information will be required: • Population sample size, population standard deviation, population sampling error, confidence level, z –value, power of study etc … • 80% power in a clinical trial means that the study has a 80% chance of ending up with a p value of less than 5% in a statistical test (i.e. a statistically significant treatment effect) if there really was an important difference (e.g. 10% versus 5% mortality) between treatments.
  • 30. Further considerations • The above approaches to determining sample size have assumed that a simple random sample is the sampling design. • More complex designs, e.g. case control studies etc , one must take into account the variances of sub-populations, strata, or clusters before an estimate of the variability in the population as a whole can be made.
  • 31. Sampling strategies in quantitative research Simple random sampling • e.g Names in a hat or table of random numbers • Larger samples more likely to represent population • Any difference between population and sample is random and small (random sampling error)
  • 32. Stratified random sampling • Ensures small subgroups (strata) are represented • Normally proportional to their part of population • Break population into strata, then randomly select within strata • Multistage sampling
  • 33. Cluster random sampling • Select groups as sample units rather than individuals • REQUIRES a large number of groups/clusters • Multistage sampling
  • 34. Systematic (Nth) sampling • Either Considered random or non random • Random- if list is randomly ordered • nonrandom- systematic with random starting point • Divide population size by sample size to get N (population size/sample size=Nth)