Download to read offline
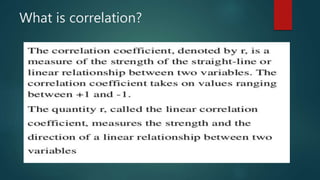
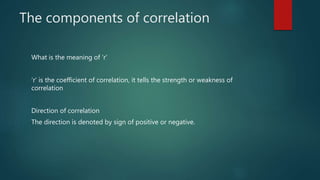
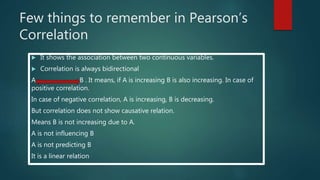
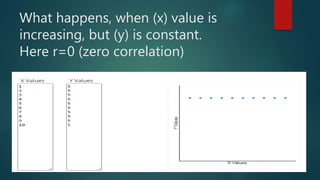
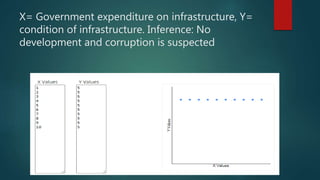
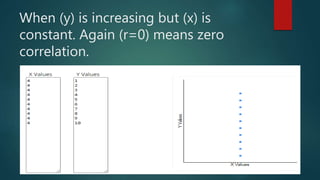
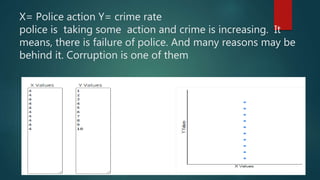
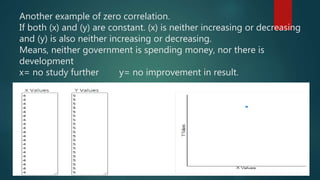
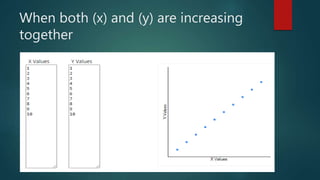

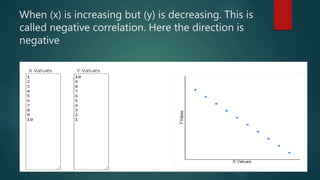
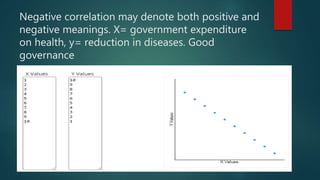
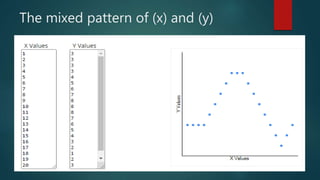
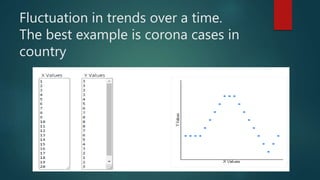
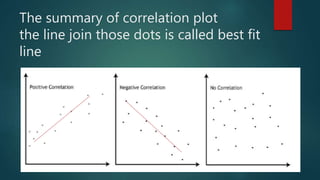
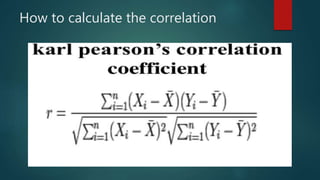
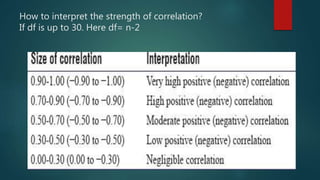


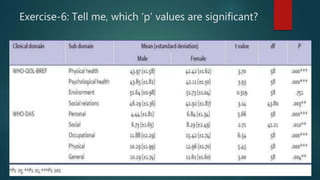

This document discusses the basic concepts of correlation including: 1. Correlation measures the strength and direction of association between two continuous variables. A positive correlation means both variables increase together, while a negative correlation means one increases as the other decreases. 2. The coefficient of correlation, r, indicates the strength of correlation, ranging from -1 to 1. Zero correlation means there is no linear relationship between the variables. 3. Correlation does not imply causation - it only shows association. Changes in one variable may not cause changes in the other. 4. Examples are provided to illustrate different correlation strengths and directions between variables like government spending/infrastructure development, police action/crime rates, and study


![[DSC Europe 25] Srdj Stanisic - Local and Private AI in UX.pdf](https://cdn.slidesharecdn.com/ss_thumbnails/vwmetykqmztgmokmmkfa-3-srdjan-stanisic-local-and-small-ai-in-ux-260120105855-55a31869-thumbnail.jpg?width=640&height=640&fit=bounds)
![[DSC Europe 25] Harshvardhan Jain - From Pre-Trained to Purpose-Built: Fine-T...](https://cdn.slidesharecdn.com/ss_thumbnails/zru4zmiseku5tgvu2dgw-harshvardhan-jain-from-pre-trained-to-purpose-built-fine-tuning-llms-for-high-i-260119101520-8335585f-thumbnail.jpg?width=640&height=640&fit=bounds)

![[DSC Europe 25] Tali Fulman - Guild Meetings, Then What? Building Data Commun...](https://cdn.slidesharecdn.com/ss_thumbnails/fgohhi33rwmhqdowdj5k-tali-fulman-guild-meetings-then-what-building-data-communities-that-actually-ch-260120105855-528492c3-thumbnail.jpg?width=640&height=640&fit=bounds)
![[DSC Europe 25] Borko Kozomora - Optimizing business workflows with advances ...](https://cdn.slidesharecdn.com/ss_thumbnails/hbgekyb0txw0xpo4yfml-borko-kozomora-leading-ai-transformation-260122103838-cc29ee38-thumbnail.jpg?width=640&height=640&fit=bounds)

![[DSC Europe 25] Paula Garcia Esteban -Building the Future: The Role of Data S...](https://cdn.slidesharecdn.com/ss_thumbnails/9ld1r1bsqpwve8qfvphy-paula-garcia-esteban-building-the-future-260122103838-4171f5cb-thumbnail.jpg?width=640&height=640&fit=bounds)
![[DSC Europe 25] Dubravko Culibrk - Deep Learning for Mammography.pptx](https://cdn.slidesharecdn.com/ss_thumbnails/yiscimuktacgqoiu4dkp-deep-learning-for-mammography-260119121559-aad59182-thumbnail.jpg?width=640&height=640&fit=bounds)

![[DSC Europe 25] Egor Krasheninnikov - The Control Stack: Building Guardrails ...](https://cdn.slidesharecdn.com/ss_thumbnails/3lzcz7hxqmo51mtalv4u-the-control-stack-260119101520-ea90841a-thumbnail.jpg?width=640&height=640&fit=bounds)


![[DSC Europe 25] Milos Belcevic - Product Professional's Journey to Full-Stack...](https://cdn.slidesharecdn.com/ss_thumbnails/1zovd6fgsycdg4wvgvls-milos-belcevic-product-professionals-journey-to-full-stack-product-developer-260123083019-d993120d-thumbnail.jpg?width=640&height=640&fit=bounds)
